Scalping PullBack Tool R1
Penulis:ChaoZhang, Tarikh: 2022-05-20 16:20:53Tag:EMAPAC
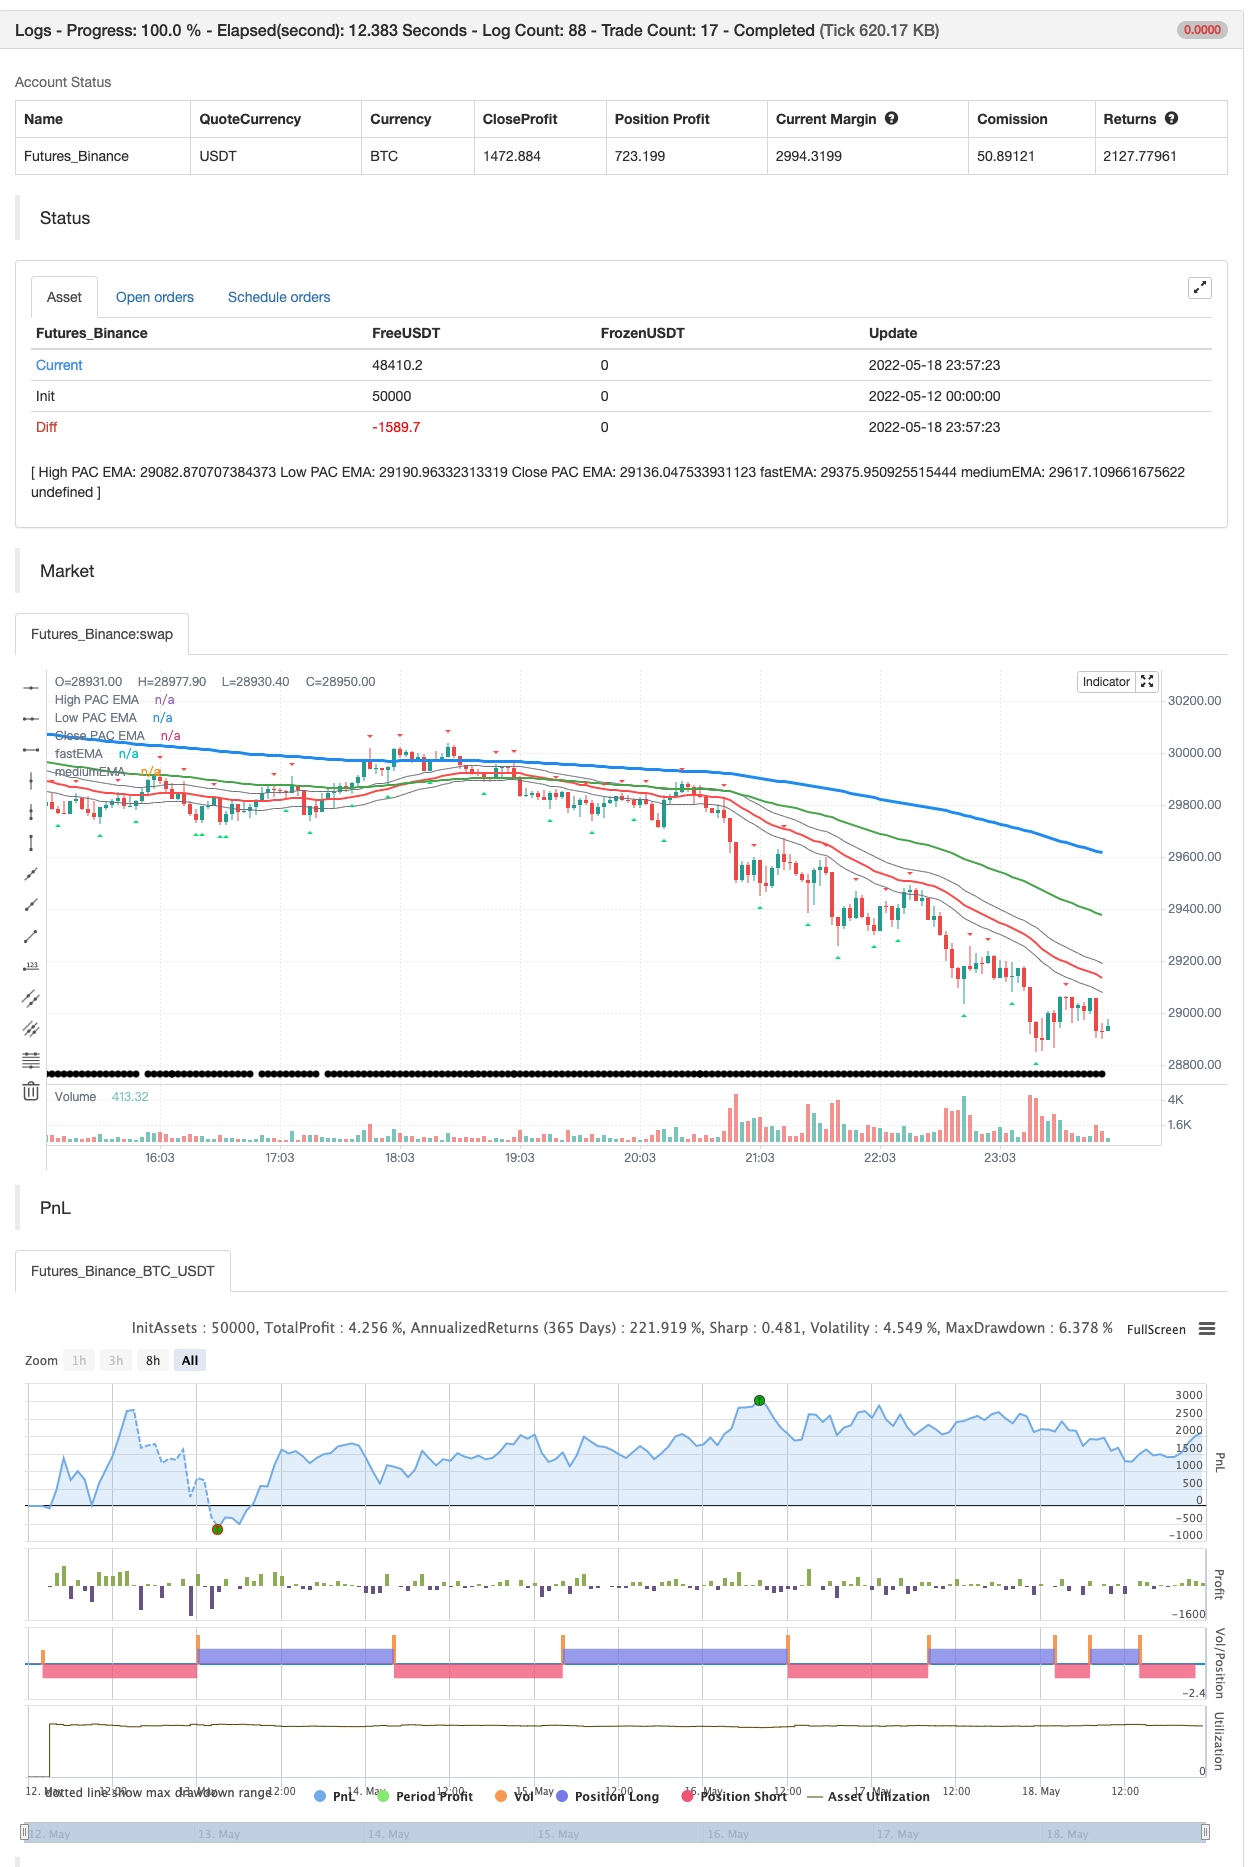
Projek kajian ini adalah Scalping Pullback Trading Tool yang menggabungkan majoriti penunjuk yang diperlukan untuk menganalisis dan scalp Trend untuk Pull Back dan pembalikan pada carta 1min, 5min atau 15min.
- Industri utama (Bank) mengakui EMA penting dalam EMA Ribbon: Hijau = EMA89 Biru = EMA200 Hitam = EMA633
- 36EMA (default) Saluran Tindakan Harga Tinggi/Rendah+Tutup (PAC).
- Fraktal
- Pencari HH, LH, LL, HL untuk membantu menggambar garis Trend dan garis Trend mini.
- Pencahayaan tinggi bar berwarna berdasarkan PAC:
biru = bar tertutup di atas PAC
merah = bar ditutup di bawah PAC
kelabu = bar tertutup di dalam PAC
Garis merah = EMA36 penutupan bar
Setup dan petua:
Tetapkan carta ke lilin Heikin Ashi.
Tambah indikator
Sweetspot Gold10 ke carta juga untuk membantu mencari sokongan dan rintangan dan menunjukkan di mana garis 00 dan 0 yang penting. Apabila harga di atas PAC ((bar biru) kita hanya mencari untuk membeli kerana harga kembali ke PAC Apabila harga di bawah PAC ((bar merah), kita hanya mencari untuk menjual apabila harga kembali ke PAC Apa yang kita cari apabila harga kembali ke PAC kita melukis trendline mini menggunakan fraktal dan titik HH / LL untuk memandu lukisan TL anda. Sekarang cari trend untuk menarik balik dan memecahkan TL yang ditarik. Oleh itu, kami mencari isyarat kesinambungan dari segi penurunan yang kuat dan didorong oleh momentum (biasanya jangka pendek 10-20 pip) dari EMA36. EMA yang lain berada di sana untuk memeriksa untuk Pullbacks lain apabila EMA36 terputus. Selain daripada penunjuk SweetSpot Gold10, anda tidak perlu sebarang penunjuk lain untuk melihat penurunan.
Ujian belakang
/*backtest
start: 2022-05-12 00:00:00
end: 2022-05-18 23:59:00
period: 3m
basePeriod: 1m
exchanges: [{"eid":"Futures_Binance","currency":"BTC_USDT"}]
*/

//@version=4
//

study(title="Scalping PullBack Tool R1.1 by JustUncleL", shorttitle="SCALPTOOL R1.1", overlay=true)

//
// Revision:        1.1
// Original Author: JustUncleL
//
// Description:
//    This study project is a Scalping Pullback trading Tool that incorporates the majority of the indicators
//    needed to analyse and scalp Trends for Pull Backs and reversals intended for lower time frame
//    charts upto 15min, but it should work just as well on higher time frame charts for
//    longer term trades.
//
//    This Tool can be used with Heikin Ashi (HA) candle charts or normal candle charts, HA candles
//    will show a cleaner/smoother looking candle trend  but not show true prices.
//
//    Incorporated within this tool are the following indicators:
//    1. Trader selectable important EMAs in an EMA style Ribbon:
//       - Green = fast EMA (default=89)
//       - Blue  = medium EMA (default=200)
//       - Black = slow EMA (default=600)
//    2. The PAC EMA (default=34) High/Low+Close creates the Price Action Channel (PAC).
//    3. Fractals
//    4. HH, LH, LL, HL finder may help with drawing Trend lines and mini Trend Lines.
//    5. Coloured coded Bar high lighting based on the PAC:
//       - blue = bar closed  above PAC
//       - red  = bar closed below PAC
//       - gray = bar closed inside PAC
//       - red line = PAC EMA (34) of bar close
//    6. Coloured chart Background to indicate Trend direction
//       (NOTE: slow EMA(600) is not used in this Algo):
//       - green  = Trend direction is up when PAC and fast EMA(89) are above medium EMA(200).
//       - red    = Trend direction is down when PAC and fast EMA(89) are below medium EMA(200).
//       - yellow = Trend direction is in transition.
//    7. Pullback is defined as Price starts outside the PAC and then pulls back into the PAC
//       closing the opposite side of the PAC centre line, then a recovery arrow can occur.
//    8. Coloured Alert Arrows:
//       - maroon down arrow  = Pullback recovery Sell alert
//       - green up arrow     = Pullback recovery Buy alert
//    9. Option to force Heikin Ashi candles in Algo calculations.
//
// Setup and hints:
//
//  - I also add "Sweetspot Gold RN" indicator to the chart as well to help with support and resistance
//    finding and shows where the important "00" and "0" lines are.
//  - When price is above the PAC(blue bars) we are only looking to buy as price comes back to the PAC
//    When price is below the PAC(red bars), we are only looking to sell when price comes back to the PAC
//  - What we’re looking for when price comes back into the PAC we draw mini Trendlines (TL) uitilising the
//    Fractals and HH/LL points to guide your TL drawing.
//  - Now look for the trend to pull back and break the drawn mini TL. That's is where we can place the scalp
//    trade.
//  - So we are looking for continuation signals in terms of a strong, momentum driven pullbacks
//    of the PAC EMA(34).
//  - The other EMAs are there to check for other Pullbacks when PAC EMA (34) is broken.
//  - Other than the "SweetSpot Gold RN" indicator, you should not need any other indicator to scalp
//    for pullbacks.
//  - If you want to trade shallower Pullbacks for quicker scalps, try reducing the
//    PAC and EMA combination lengths for example:
//      * 21 PAC and 55, 144, 377 for fast, medium, slow EMAs
//      * 13 PAC and 34, 89, 233 for fast, medium, slow EMAs
//  - Each alert should be evaluated on it's own merits, the alerts are designed to highlight possible
//    scalping trades from Pullback recoveries around the PAC.
//
// References:
//  - [RS]Fractals V8 by RicardoSantos
//  - Price Action Trading System v0.3 by JustUncleL
//  - SweetSpot Gold RN by JustUncleL
//  - http://www.swing-trade-stocks.com/pullbacks.html
//  - https://www.forexstrategiesresources.com/scalping-forex-strategies/106-1-min-scalping-with-34-exponential-moving-average-channel/
//
// Modifications:
//  4-Feb-2020  Release R1.1 changes made to provide a more versitile tool
//      - Upgraded to Pinescript R4
//      - Reodered code into more logical blocks
//      - Added option for PAC filtered Alerts and Alarms.
//      - Added option to alter the default EMA lengths.
//      - Added option to Show each EMA line.
//      - Added option to use Heikin  Ashi candles for Algo calculations
//        even when normal candles are displayed on chart.
//

// === INPUTS ===
HiLoLen         = input(34, minval=2, title="High Low PAC channel Length")
fastEMAlength   = input(89, minval=2)
mediumEMAlength = input(200, minval=2)
slowEMAlength   = input(600, minval=2)
ShowFastEMA     = input(true)
ShowMediumEMA   = input(true)
ShowSlowEMA     = input(false)
ShowHHLL        = input(false)
ShowFractals    = input(true)
filterBW        = input(false, title="Show Ideal Fractals Only")
ShowBarColor    = input(true, title="Show coloured Bars around PAC")
ShowBuySell     = input(true, title="Show Buy/Sell Alert Arrows")
Lookback        = input(3, minval=1, title="Pullback Lookback for PAC Cross Check")
DelayArrow      = input(false, title="Show Alert Arrows Only on Closed Candles")
Delay           = DelayArrow ? 1 : 0
ShowTrendBGcolor= input(true)
UseHAcandles    = input(true, title="Use Heikin Ashi Candles in Algo Calculations")
//
// === /INPUTS ===

// === BASE FUNCTIONS ===

haClose = UseHAcandles ? security(heikinashi(syminfo.tickerid), timeframe.period, close) : close
haOpen  = UseHAcandles ? security(heikinashi(syminfo.tickerid), timeframe.period, open) : open
haHigh  = UseHAcandles ? security(heikinashi(syminfo.tickerid), timeframe.period, high) : high
haLow   = UseHAcandles ? security(heikinashi(syminfo.tickerid), timeframe.period, low) : low


//  ||---   Fractal Recognition Functions:  ---------------------------------------------------------------||
isRegularFractal(mode) =>
    ret = mode == 1 ? high[4] < high[3] and high[3] < high[2] and high[2] > high[1] and
       high[1] > high[0] : mode == -1 ?
       low[4] > low[3] and low[3] > low[2] and low[2] < low[1] and low[1] < low[0] :
       false
    ret

isBWFractal(mode) =>
    ret = mode == 1 ? high[4] < high[2] and high[3] <= high[2] and high[2] >= high[1] and
       high[2] > high[0] : mode == -1 ?
       low[4] > low[2] and low[3] >= low[2] and low[2] <= low[1] and low[2] < low[0] :
       false
    ret
//  ||-----------------------------------------------------------------------------------------------------||

//
// === /BASE FUNCTIONS ===

// === SERIES SETUP ===
//

//  ||---   Setup Moving Averages and PAC channel:
//  ||-----------------------------------------------------------------------------------------------------||
fastEMA     = ema(haClose, fastEMAlength)
mediumEMA   = ema(haClose, mediumEMAlength)
slowEMA     = ema(haClose, slowEMAlength)
pacC        = ema(haClose, HiLoLen)
pacL        = ema(haLow, HiLoLen)
pacU        = ema(haHigh, HiLoLen)
TrendDirection = fastEMA > mediumEMA and pacL > mediumEMA ? 1 :
   fastEMA < mediumEMA and pacU < mediumEMA ? -1 : 0

//  ||---   Fractal Recognition:
//  ||-----------------------------------------------------------------------------------------------------||
filteredtopf = filterBW ? isRegularFractal(1) : isBWFractal(1)
filteredbotf = filterBW ? isRegularFractal(-1) : isBWFractal(-1)
//  ||-----------------------------------------------------------------------------------------------------||
//  ||---   Higher Highs, Lower Highs, Higher Lows, Lower Lows  -------------------------------------------||
valuewhen_H0 = valuewhen(filteredtopf == true, high[2], 0)
valuewhen_H1 = valuewhen(filteredtopf == true, high[2], 1)
valuewhen_H2 = valuewhen(filteredtopf == true, high[2], 2)
//
higherhigh = filteredtopf == false ? false :
   valuewhen_H1 < valuewhen_H0 and valuewhen_H2 < valuewhen_H0
lowerhigh = filteredtopf == false ? false :
   valuewhen_H1 > valuewhen_H0 and valuewhen_H2 > valuewhen_H0
valuewhen_L0 = valuewhen(filteredbotf == true, low[2], 0)
valuewhen_L1 = valuewhen(filteredbotf == true, low[2], 1)
valuewhen_L2 = valuewhen(filteredbotf == true, low[2], 2)
//
higherlow = filteredbotf == false ? false :
   valuewhen_L1 < valuewhen_L0 and valuewhen_L2 < valuewhen_L0
lowerlow = filteredbotf == false ? false :
   valuewhen_L1 > valuewhen_L0 and valuewhen_L2 > valuewhen_L0

//
// === /SERIES ===

//
// === PLOTTING ===
//
// Plot the Price Action Channel (PAC) base on EMA high,low and close
L = plot(pacL, color=color.gray, linewidth=1, title="High PAC EMA", transp=50)
U = plot(pacU, color=color.gray, linewidth=1, title="Low PAC EMA", transp=50)
C = plot(pacC, color=color.red, linewidth=2, title="Close PAC EMA", transp=0)
fill(L, U, color=color.gray, transp=90, title="Fill HiLo PAC")

// Colour bars according to the close position relative to the PAC selected.
BARcolor = haClose > pacU ? color.blue : haClose < pacL ? color.red : color.gray
barcolor(ShowBarColor ? BARcolor : na, title="Bar Colours")
//
BGcolor = TrendDirection == 1 ? color.green :
   TrendDirection == -1 ? color.red : color.yellow
bgcolor(ShowTrendBGcolor ? BGcolor : na, transp=90, title="Trend BG Color")

// Draw the EMA ribbon
plot(ShowFastEMA ? fastEMA : na, color=color.green, linewidth=2, transp=20, title="fastEMA")
plot(ShowMediumEMA ? mediumEMA : na, color=color.blue, linewidth=3, transp=20, title="mediumEMA")
plot(ShowSlowEMA ? slowEMA : na, color=color.black, linewidth=4, transp=20, title="slowEMA")
//
plotshape(ShowFractals ? filteredtopf : na, title='Filtered Top Fractals', style=shape.triangledown, location=location.abovebar, color=color.red, offset=-2)
plotshape(ShowFractals ? filteredbotf : na, title='Filtered Bottom Fractals', style=shape.triangleup, location=location.belowbar, color=color.lime, offset=-2)
//
plotshape(ShowHHLL ? higherhigh : na, title='Higher High', style=shape.square, location=location.abovebar, color=color.maroon, text="[HH]", offset=-2)
plotshape(ShowHHLL ? lowerhigh : na, title='Lower High', style=shape.square, location=location.abovebar, color=color.maroon, text="[LH]", offset=-2)
plotshape(ShowHHLL ? higherlow : na, title='High Low', style=shape.square, location=location.belowbar, color=color.green, text="[HL]", offset=-2)
plotshape(ShowHHLL ? lowerlow : na, title='Lower Low', style=shape.square, location=location.belowbar, color=color.green, text="[LL]", offset=-2)
//
// === /PLOTTING ===


// === ALERTING ===
//

// Initialise Trading state.
TradeDirection = 0
TradeDirection := nz(TradeDirection[1])
//
pacExitU = haOpen < pacU and haClose > pacU and barssince(haClose<pacC)<=Lookback
pacExitL = haOpen > pacL and haClose < pacL and barssince(haClose>pacC)<=Lookback
plotshape(barssince(haClose<pacC),color=na,location=location.bottom,title="barssince(haClose<pacC)")
plotshape(barssince(close>pacC),color=na,location=location.bottom,title="barssince(haClose>pacC)")
//
Buy = TrendDirection == 1 and pacExitU
Sell = TrendDirection == -1 and pacExitL
//
// Keep Current trading state until Pullback occurs or New Recovery.
TradeDirection := TradeDirection == 1 and haClose<pacC ? 0 :
   TradeDirection == -1 and haClose>pacC ? 0 :
   TradeDirection == 0 and Buy ? 1 :
   TradeDirection == 0 and Sell ? -1 : TradeDirection

// Show buy/sell arrows
//plotarrow(ShowBuySell and nz(TradeDirection[1+Delay]) == 0 and TradeDirection[Delay] != 0 ? TradeDirection[Delay] : na, offset=-Delay,
//          colorup=color.green, colordown=color.maroon, transp=20, minheight=20, maxheight=50, title="Buy/Sell Arrow")
//
// Create alerts for TradingView Alarm subsystem.
Long = nz(TradeDirection[1]) == 0 and TradeDirection == 1
Short = nz(TradeDirection[1]) == 0 and TradeDirection == -1
alertcondition(Long, title="Buy Condition", message="BUY")
alertcondition(Short, title="Sell Condition", message="SELL")
//
// === /ALERTING ===

// === eof.

if Long
    strategy.entry("Enter Long", strategy.long)
else if Short
    strategy.entry("Enter Short", strategy.short)
Berkaitan
- Alat Perdagangan Swing Scalping R1-4
- EMA/SMA berwarna purata bergerak
- Sidboss
- Julat Penapis Beli dan Jual 5min [Strategi]
- Sistem CM Sling Shot
- Bermain salib
- Beli / Jual Strat
- Palu terbalik - Pilihan yang diperluaskan
- stok supertrd atr 200ma
- Perdagangan jangka masa berbilang
Lebih lanjut
- Aliran Volume v3
- Crypto niaga hadapan scalping jam dengan ma & rsi - ogcheckers
- ATR dihaluskan
- Pencari Blok Perintah
- TrendScalp-FractalBox-3EMA
- Isyarat QQE
- U-bit grid amplitude penyaringan
- CM MACD Indikator Sesuai - Kerangka Masa Berbilang - V2
- HODL LINE
- 2 Pengesanan Arah Rata-rata Bergerak Warna
- Strategi Beli&Jual bergantung kepada AO+Stoch+RSI+ATR
- EMA TREND CLOUD
- Rasio Tenaga Arah RedK Volume-Pengcepat
- Donchian Breakout tiada cat semula
- Bar Momentum RedK
- SuperJump Turn Back Bollinger Band
- Trend Fukuiz
- BOT Johny
- SSL Hibrid
- Keluar Chandelier