Alat Perdagangan Swing Scalping R1-4
Penulis:ChaoZhang, Tarikh: 2022-05-25 15:58:26Tag:EMAPAC
Penerangan:
Projek kajian ini adalah
Digabungkan dalam alat ini adalah penunjuk berikut:
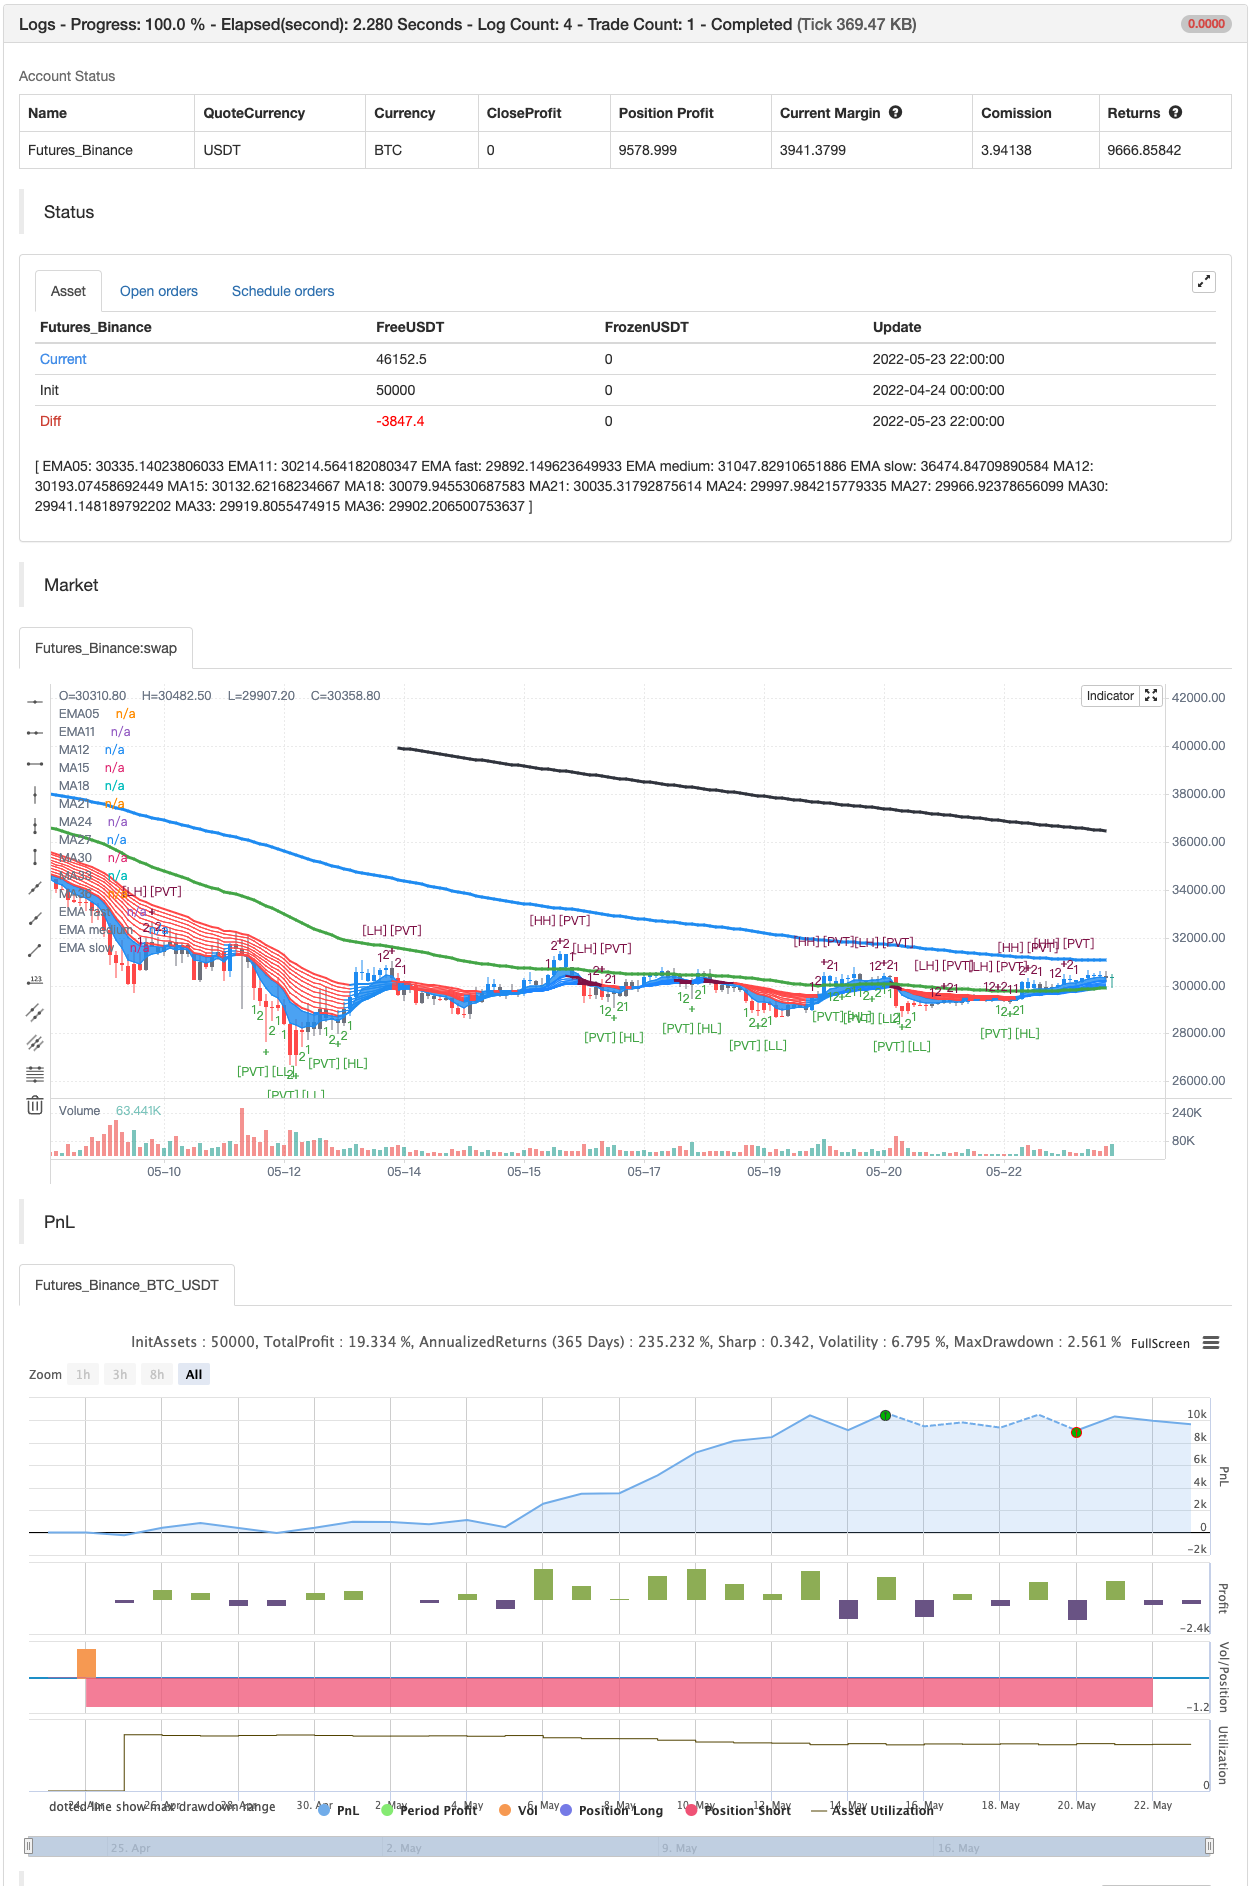
- EMA berikut diambil secara automatik: Hijau = EMA89 (15min TF) = EMA75 (1min TF) Biru = EMA200 (15min TF) = EMA180 (1min TF) Hitam = EMA633 (15min TF) = EMA540 (1min TF)
- 10EMA (default) Saluran Tindakan Harga Tinggi/Rendah+Tutup (PAC), saluran PAC paparan dilumpuhkan secara lalai.
- Pilihan memaparkan Fraktal dan tahap Fraktal pilihan
- Pilihan HH, LH, LL, HL pencari.
- Pencahayaan tinggi bar berwarna berdasarkan PAC: biru = bar tertutup di atas PAC merah = bar ditutup di bawah PAC kelabu = bar tertutup di dalam PAC Line lime = EMA10 penutupan bar
- Titik Pivot (menonaktifkan Fractals secara automatik apabila dipilih) dengan label pilihan.
- Saluran EMA5-12 dipaparkan secara lalai.
- EMA12-36 Ribbon dipaparkan secara lalai
- Pilihan menunjukkan EMA36 dan PAC bukannya EMA12-36 Ribbon.
Setup dan petua: Saya tidak dapat memberikan penerangan lengkap di sini, kerana Pullback Trading menggabungkan Metodologi perdagangan yang lengkap, terdapat beberapa artikel dan buku yang ditulis mengenai subjek ini.
Tetapkan ke dua panel carta TradingView, set panel pertama kepada 15min dan kedua kepada 1min.
Tetapkan carta untuk Heikin Ashi lilin (pilihan).
Saya juga menambah penunjuk
Ujian belakang
/*backtest
start: 2022-04-24 00:00:00
end: 2022-05-23 23:59:00
period: 2h
basePeriod: 15m
exchanges: [{"eid":"Futures_Binance","currency":"BTC_USDT"}]
*/

//@version=3
//

study(title = "Scalping Swing Trading Tool R1-6 by JustUncleL", shorttitle = "SCALPSWING R1-6", overlay = true)

//
// Revision:        1
// Original Author: JustUncleL
//
// Description:
//    This study project is a Scalping Swing trading Tool designed for a two pane TradingView chart layout:
//    - the first pane set to 15min Time Frame;
//    - the second pane set to 1min Time Frame(TF).
//    The tools incorporates the majority of the indicators needed to analyse and scalp Trends for Swings,
//    PullBacks and reversals on 15min charts and 1min charts. The set up optionally utilies Heikin Ashi
//    candle charts.
//
//    NOTE: A Pullback is synomous to Retracement, generally a Pullback refers to a large Retracement of 100pips
//    or more. In the context of this Tool and any comments related to it, a Pullback will be the
//    same as a Retracement.
//
//    Incorporated within this tool are the following indicators:
//    1. The following EMAs:
//       - Green = EMA89  (15min TF) = EMA75  (1min TF)
//       - Blue  = EMA200 (15min TF) = EMA180 (1min TF)
//       - Black = EMA633 (15min TF) = EMA540 (1min TF)
//    2. The 10EMA (default) High/Low+Close Price Action Channel (PAC).
//    3. Fractals
//    4. HH, LH, LL, HL finder to help with drawing Trend lines and mini Trend Lines.
//    5. Coloured coded Bar high lighting based on the PAC:
//       - blue = bar closed  above PAC
//       - red  = bar closed below PAC
//       - gray = bar closed inside PAC
//       - red line = EMA36 of bar close
//    6. Optionally display Pivot points (disables Fractals automatically when selected).
//    7. Display EMA5-12 Channel
//    8. Display EMA12-36 Ribbon
//    9. Optionally display EMA36 and PAC instead of EMA12-36 Ribbon.
//
// Setup and hints:
//
//  - Set to two pane TradingView chart, set first pane to 15Min and second to 1min.
//  - Set the chart to Heikin Ashi Candles in both panes (optional).
//  - I also add "Sweetspot Gold2" indicator to the chart as well to help with support and resistance
//    finding and shows where the important "00" and "0" lines are.
//  - Use the EMA200 on the 15min pane as the anchor. So when prices above EMA200 we only trade long (buy)
//    and when prices below the EMA200 we only trade short (sell).
//  - On the 15min chart draw any obvious Vertical Trend Lines (VTL), use Pivots point as a guide.
//  - On the 15min chart what we’re looking for price to Pullback into the EMA5-12 Channel or EMA12-36 ribbon
//    we Trendlines uitilising the Pivot points or Fractals to guide your TL drawing.
//  - On the 15min chart look for the trend to resume and break through the drawn TL. The bar color needs to
//    change back to the trend direction colour to confirm as a break.
//  - Now this break can be traded as a 15min trade or now look to the 1min chart.
//  - On the 1min chart draw any Pullback into any of the EMAs.
//  - On the 1min chart look for the trend to resume and break through the drawn TL. The bar color needs to
//    change back to the trend direction colour to confirm as a break.
//  - Now this break can be traded as a 1min trade.
//  - So we are looking for continuation signals in terms of a strong, momentumdriven pullbacks of the EMA36.
//  - The other EMAs are there to check for other Pullbacks when EMA36 is broken.
//  - There is also an option to select Pristine (ie Ideal) filtered Fractals, which look like tents or V shape
//    5-candle patterns. These are actually used to calculate the Pivot points as well.
//  - Other than the SweetSpot Gold2 indicator, you should not need any other indicator to scalp
//    for pullbacks.
//
// Revisions:
//  R1 by JustUncleL
//  - Original version.
//
//  R1-6 23-June-2019
//  - Updated to version 3 of Pinescript
//  - Added optional PAC swing alerts, with optional 200ema filter (PAC has to above/below 200ema)
//  - Added alarms for swing arrows
//  - Removed security calls for sources, problematic
//
//
// References:
//  - [RS]Fractals V8 by RicardoSantos
//  - Price Action Trading System v0.3 by JustUncleL
//  - SweetSpot Gold2 R1 by JustUncleL
//  - http://www.swing-trade-stocks.com/pullbacks.html
//  - https://www.forexstrategiesresources.com/scalping-forex-strategies/106-1-min-scalping-with-34-exponential-moving-average-channel/
//

// === INPUTS ===
ShowPAC_    = input(true, title="Show Price Action Channel (PAC)")
scolor      = input(true, title="Show coloured Bars close relative on PAC")
HiLoLen     = input(10,minval=2,title="High Low PAC Length")
ShowPACexit = input(false, title="Show PAC Swing Alerts")
UseBigArrows = input(false, title="Use Big Arrows for Swing Alerts")
filterEMA200 = input(true,  title="Filter PAC Alerts with 200ema")
ShowEMA12_Channel= input(true)
ShowEMA36_Ribbon = input(true)
ShowPAC = HiLoLen>30 ? ShowEMA36_Ribbon? false: ShowPAC_: ShowEMA12_Channel? false : ShowPAC_
ShowPivots  = input(true)
ShowPivotLabels = input(true)
// Disable Fractal drawing if Pivots enabled
ShowHHLL_   = input(false)
ShowHHLL    = ShowPivots?false:ShowHHLL_
ShowFractals_= input(true)
ShowFractals = ShowPivots?false:ShowFractals_
ShowFractalLevels =input(false)
//ShowFractalLevels = ShowPivots?false:ShowFractalLevels_
filterBW_   = input(false, title="Filter for Pristine (Ideal) Fractals")
// Need Williams Filter for Pivots.
filterBW    = ShowPivots?true:filterBW_

// --- CONSTANTS ---
DodgerBlue  = #1E90FF
//
// --- SOURCES ---
close_ = close //security(ticker, period, close,  barmerge.gaps_off, barmerge.lookahead_on)
open_ = open //security(ticker, period, open, barmerge.gaps_off, barmerge.lookahead_on)
high_ = high //security(ticker, period, high, barmerge.gaps_off, barmerge.lookahead_on)
low_ = low //security(ticker, period, low, barmerge.gaps_off, barmerge.lookahead_on)

exitClose = close_ //UseHAexit ? security(heikinashi(tickerid), period, close) : close_
exitOpen  = open_ //UseHAexit ? security(heikinashi(tickerid), period, open)  : open_

//
// === /INPUTS ===

//  ||---   Fractal Recognition Functions:  ---------------------------------------------------------------||
isRegularFractal(mode) =>
    ret = mode == 1 ? high_[5] < high_[4] and high_[4] < high_[3] and high_[3] > high_[2] and high_[2] > high_[1] :
          mode == -1 ? low_[5] > low_[4] and low_[4] > low_[3] and low_[3] < low_[2] and low_[2] < low_[1] : false

isBWFractal(mode) =>
    ret = mode == 1 ? high_[5] < high_[3] and high_[4] < high_[3] and high_[3] > high_[2] and high_[3] > high_[1] :
          mode == -1 ? low_[5] > low_[3] and low_[4] > low_[3] and low_[3] < low_[2] and low_[3] < low_[1] : false
//  ||-----------------------------------------------------------------------------------------------------||

// MA Colour finder for EMA Ribbon plot.
maColor(maBase, ma, maRef) =>
      change(ma)>=0 and maBase>maRef ? DodgerBlue
     :change(ma)<0 and maBase>maRef ? maroon
     :change(ma)<=0 and maBase<maRef ? red
     :change(ma)>=0 and maBase<maRef ? blue
     :gray

// === /FUNCTIONS ===

// === SERIES SETUP ===

// Price action channel
pacC        = ema(close_,HiLoLen)
pacL        = ema(low_,HiLoLen)
pacU        = ema(high_,HiLoLen)

// All other EMAs
EMA05       = ema(close_, 05)
EMA11       = ema(close_, 11)
EMA12       = ema(close_, 12)
EMA15       = ema(close_, 15)
EMA18       = ema(close_, 18)
EMA21       = ema(close_, 21)
EMA24       = ema(close_, 24)
EMA27       = ema(close_, 27)
EMA30       = ema(close_, 30)
EMA33       = ema(close_, 33)
EMA36       = ema(close_, 36)
EMA75       = ema(close_, 75)
EMA89       = ema(close_, 89)
EMA180      = ema(close_, 180)
EMA200      = ema(close_, 200)
EMA540      = ema(close_, 540)
EMA633      = ema(close_, 633)

// === /SERIES ===

// === PLOTTING ===
//
// If selected, Plot the Price Action Channel (PAC) base on EMA high,low and close
L=plot(ShowPAC ?pacL:na, color=gray, linewidth=1, title="High PAC EMA",transp=50)
U=plot(ShowPAC ?pacU:na, color=gray, linewidth=1, title="Low PAC EMA",transp=50)
C=plot(ShowPAC ?pacC:na, color=lime, linewidth=1, title="Close PAC EMA",transp=0)
fill(L,U, color=gray,transp=92,title="Fill HiLo PAC")

// Colour bars according to the close position relative to the PAC selected.
bColour     = close>=pacU? blue : close<=pacL? red : gray
barcolor(scolor?bColour:na, title = "Bar Colours")

// Draw the EMA12 ribbon
ema05=plot(ShowEMA12_Channel?EMA05:na,  color=blue,linewidth=1,transp=92,title="EMA05")
ema11=plot(ShowEMA12_Channel?EMA11:na,  color=blue,linewidth=1,transp=92,title="EMA11")
fill(ema05,ema11, color=blue,transp=92,title="Fill EMA5-12")
//
// If this is the 1min Time Frame select 15* EMAs
emaFast   = timeframe.isintraday?  EMA75  : EMA89
emaMedium = timeframe.isintraday?  EMA180 : EMA200
emaSlow   = timeframe.isintraday?  EMA540 : EMA633

plot(emaFast,  color=green,linewidth=3,transp=20,title="EMA fast")
plot(emaMedium, color=blue,linewidth=3,transp=20,title="EMA medium")
plot(emaSlow, color=black,linewidth=3,transp=20,title="EMA slow")

// Draw the EMA36 ribbon
plot( ShowEMA36_Ribbon?EMA12:na, color=maColor(EMA12,EMA12,EMA36), style=line, title="MA12", linewidth=2,transp=20)
plot( ShowEMA36_Ribbon?EMA15:na, color=maColor(EMA12,EMA15,EMA36), style=line, title="MA15", linewidth=1,transp=20)
plot( ShowEMA36_Ribbon?EMA18:na, color=maColor(EMA12,EMA18,EMA36), style=line, title="MA18", linewidth=1,transp=20)
plot( ShowEMA36_Ribbon?EMA21:na, color=maColor(EMA12,EMA21,EMA36), style=line, title="MA21", linewidth=1,transp=20)
plot( ShowEMA36_Ribbon?EMA24:na, color=maColor(EMA12,EMA24,EMA36), style=line, title="MA24", linewidth=1,transp=20)
plot( ShowEMA36_Ribbon?EMA27:na, color=maColor(EMA12,EMA27,EMA36), style=line, title="MA27", linewidth=1,transp=20)
plot( ShowEMA36_Ribbon?EMA30:na, color=maColor(EMA12,EMA30,EMA36), style=line, title="MA30", linewidth=1,transp=20)
plot( ShowEMA36_Ribbon?EMA33:na, color=maColor(EMA12,EMA33,EMA36), style=line, title="MA33", linewidth=1,transp=20)
plot( EMA36, color=ShowEMA36_Ribbon?maColor(EMA12,EMA36,EMA36):red, style=line, title="MA36", linewidth=2,transp=20)
// === /SERIES ===

// === PLOTTING ===


//  ||---   Fractal Recognition:
//  ||-----------------------------------------------------------------------------------------------------||
filteredtopf = filterBW ? isRegularFractal(1) : isBWFractal(1)
filteredbotf = filterBW ? isRegularFractal(-1) : isBWFractal(-1)

plotshape(ShowFractals? filteredtopf :na, title='Filtered Top Fractals', style=shape.triangledown, location=location.abovebar, color=red, offset=-3,transp=0)
plotshape(ShowFractals? filteredbotf :na, title='Filtered Bottom Fractals', style=shape.triangleup, location=location.belowbar, color=lime, offset=-3,transp=0)

topfractals = na
botfractals = na
topfractals := filteredtopf ? high_[3] : topfractals[1]
botfractals := filteredbotf ? low_[3] : botfractals[1]

topfcolor = na
botfcolor = na
topfcolor := topfractals != topfractals[1] ? na : green
botfcolor := botfractals != botfractals[1] ? na : red

plot(ShowFractalLevels? topfractals : na, color=topfcolor, transp=0, linewidth=2)
plot(ShowFractalLevels? botfractals : na, color=botfcolor, transp=0, linewidth=2)


//  ||-----------------------------------------------------------------------------------------------------||
//  ||---   Higher Highs, Lower Highs, Higher Lows, Lower Lows  -------------------------------------------||
higherhigh = filteredtopf == false ? false : ( valuewhen(filteredtopf == true, high_[3], 1) < valuewhen(filteredtopf == true, high_[3], 0) and
                                               (ShowPivots or valuewhen(filteredtopf == true, high_[3], 2) < valuewhen(filteredtopf == true, high_[3], 0)))
lowerhigh = filteredtopf == false ? false : ( valuewhen(filteredtopf == true, high_[3], 1) > valuewhen(filteredtopf == true, high_[3], 0)  and
                                              (ShowPivots or valuewhen(filteredtopf == true, high_[3], 2) > valuewhen(filteredtopf == true, high_[3], 0)))
higherlow = filteredbotf == false ? false : ( valuewhen(filteredbotf == true, low_[3], 1) < valuewhen(filteredbotf == true, low_[3], 0) and
                                              (ShowPivots or valuewhen(filteredbotf == true, low_[3], 2) < valuewhen(filteredbotf == true, low_[3], 0)))
lowerlow = filteredbotf == false ? false : ( valuewhen(filteredbotf == true, low_[3], 1) > valuewhen(filteredbotf == true, low_[3], 0) and
                                              (ShowPivots or valuewhen(filteredbotf == true, low_[3], 2) > valuewhen(filteredbotf == true, low_[3], 0)))

// If selected show HH/LL on top/below candles.
plotshape(ShowHHLL ? higherhigh : na, title='HH', style=shape.square, location=location.abovebar, color=maroon, text="[HH]", offset=-3,transp=0)
plotshape(ShowHHLL ? lowerhigh : na, title='LH', style=shape.square, location=location.abovebar, color=maroon, text="[LH]", offset=-3,transp=0)
plotshape(ShowHHLL ? higherlow : na, title='HL', style=shape.square, location=location.belowbar, color=green, text="[HL]", offset=-3,transp=0)
plotshape(ShowHHLL ? lowerlow : na, title='LL', style=shape.square, location=location.belowbar, color=green, text="[LL]", offset=-3,transp=0)

// If selected display Pivot points
plotshape(ShowPivots and ShowPivotLabels? higherhigh : na, title='Higher High', style=shape.cross, location=location.abovebar, color=maroon, text="[HH]\n[PVT]", offset=-3,transp=0)
plotshape(ShowPivots and not ShowPivotLabels? higherhigh : na, title='Higher High+', style=shape.cross, location=location.abovebar, color=maroon, offset=-3,transp=0)
//
plotshape(ShowPivots  and ShowPivotLabels? lowerhigh : na, title='Lower High', style=shape.cross, location=location.abovebar, color=maroon, text="[LH]\n[PVT]", offset=-3,transp=0)
plotshape(ShowPivots  and not ShowPivotLabels? lowerhigh : na, title='Lower High+', style=shape.cross, location=location.abovebar, color=maroon, offset=-3,transp=0)
//
plotshape(ShowPivots  and ShowPivotLabels? higherlow : na, title='Higher Low', style=shape.cross, location=location.belowbar, color=green, text="[PVT]\n[HL]", offset=-3,transp=0)
plotshape(ShowPivots  and not ShowPivotLabels? higherlow : na, title='Higher Low+', style=shape.cross, location=location.belowbar, color=green, offset=-3,transp=0)
//
plotshape(ShowPivots  and ShowPivotLabels? lowerlow : na, title='Lower Low', style=shape.cross, location=location.belowbar, color=green, text="[PVT]\n[LL]", offset=-3,transp=0)
plotshape(ShowPivots  and not ShowPivotLabels? lowerlow : na, title='Lower Low+', style=shape.cross, location=location.belowbar, color=green, offset=-3,transp=0)
//
// Number candles on Pivot patterns.
plotchar(ShowPivots ? filteredtopf: na, title='High 1u', location=location.abovebar, color=maroon, char="1", offset=-5,transp=0)
plotchar(ShowPivots ? filteredtopf: na, title='High 2u', location=location.abovebar, color=maroon, char="2", offset=-4,transp=0)
plotchar(ShowPivots ? filteredtopf: na, title='High 2d', location=location.abovebar, color=maroon, char="2", offset=-2,transp=0)
plotchar(ShowPivots ? filteredtopf: na, title='High 1d', location=location.abovebar, color=maroon, char="1", offset=-1,transp=0)
//
plotchar(ShowPivots ? filteredbotf: na, title='Low 1d', location=location.belowbar, color=green, char="1", offset=-5,transp=0)
plotchar(ShowPivots ? filteredbotf: na, title='Low 2d', location=location.belowbar, color=green, char="2", offset=-4,transp=0)
plotchar(ShowPivots ? filteredbotf: na, title='Low 2u', location=location.belowbar, color=green, char="2", offset=-2,transp=0)
plotchar(ShowPivots ? filteredbotf: na, title='Low 1u', location=location.belowbar, color=green, char="1", offset=-1,transp=0)


// === /PLOTTING ===

// === ALERTS ===

// Check for 1st Heikin Ashi Bar exit the PAC
isup =    exitClose>exitOpen and exitClose>pacU and exitClose[1]<pacU[1] and (not filterEMA200 or pacC>emaMedium)
isdown =  exitClose<exitOpen and exitClose<pacL and exitClose[1]>pacL[1] and (not filterEMA200 or pacC<emaMedium)

// Check have alert
//up_alert = isup and (not filterEMA200 or (pacC>EMAmedm) ) ? na(up_alert[1]) ? 1 : up_alert[1]+1 : 0
//dn_alert = isdown and (not filterEMA200 or (pacC<EMAmedm) ) ? na(dn_alert[1]) ? 1 : dn_alert[1]+1 : 0
up_alert = 0
dn_alert = 0
up_alert := isup  ? na(up_alert[1]) ? 1 : up_alert[1]+1 : 0
dn_alert := isdown ? na(dn_alert[1]) ? 1 : dn_alert[1]+1 : 0
//
//plotarrow(ShowPACexit and UseBigArrows? up_alert[1]==1? 1 : dn_alert[1]==1? -1 : na : na, colorup=aqua, colordown=fuchsia, transp=20,minheight=10,maxheight=60, title="SCALPSWING Alert Arrows")
plotshape(ShowPACexit and not UseBigArrows? up_alert[1]==1? true : na : na, title='SCALPSWING Buy Arrow', location=location.belowbar, color=green,   style=shape.arrowup, text="BUY", textcolor=green,transp=0)
plotshape(ShowPACexit and not UseBigArrows? dn_alert[1]==1? true : na : na, title='SCALPSWING Sell Arrow', location=location.abovebar, color=red, style=shape.arrowdown, text="SELL",textcolor=red,transp=0)


// generate an alert if required.
alertcondition(up_alert==1, title="SCAPSWING alert Up", message="SWING_UP")
alertcondition(dn_alert==1, title="SCAPSWING alert Down", message="SWING_DN")

// === /ALERTS ===

// === eof

if isup
    strategy.entry("Enter Long", strategy.long)
else if isdown
    strategy.entry("Enter Short", strategy.short)
- Scalping PullBack Tool R1
- 3EMA
- Sistem CM Sling Shot
- Beli / Jual Strat
- stok supertrd atr 200ma
- Julat Penapis Beli dan Jual 5min [Strategi]
- Bermain salib
- Sidboss
- Palu terbalik - Pilihan yang diperluaskan
- Trend Z-Score Mengikut Strategi
- SAR Parabolik Beli dan Jual
- Pivot Berasaskan Trailing Maxima & Minima
- Nick Rypock Berbalik belakang (NRTR)
- ZigZag PA Strategi V4.1
- Beli/Jual dalam hari
- Broken Fractal: impian seseorang yang rosak adalah keuntungan anda!
- Maximizer Keuntungan PMax
- Strategi Kemenangan yang Sempurna
- Stochastic + RSI, Strategi Ganda
- Strategi Swing Hull/rsi/EMA
- BEST Engulfing + Breakout Strategi
- Bollinger Awesome Alert R1
- Plugin yang disambungkan ke pelbagai bursa
- Ganjaran segitiga (menghasilkan mata wang kecil dengan harga yang berbeza)
- bybit reverse contract dynamic grid (grid khas)
- Peringatan TradingView untuk MT4 MT5 + pembolehubah dinamik
- Siri Matriks
- Super Scalper - 5 minit 15 minit
- Indeks Kekuatan Relatif - Perbezaan - Libertus
- Regresi Linear ++