Strategi perdagangan bingkai berbilang masa berdasarkan RSI dan purata bergerak

Gambaran keseluruhan
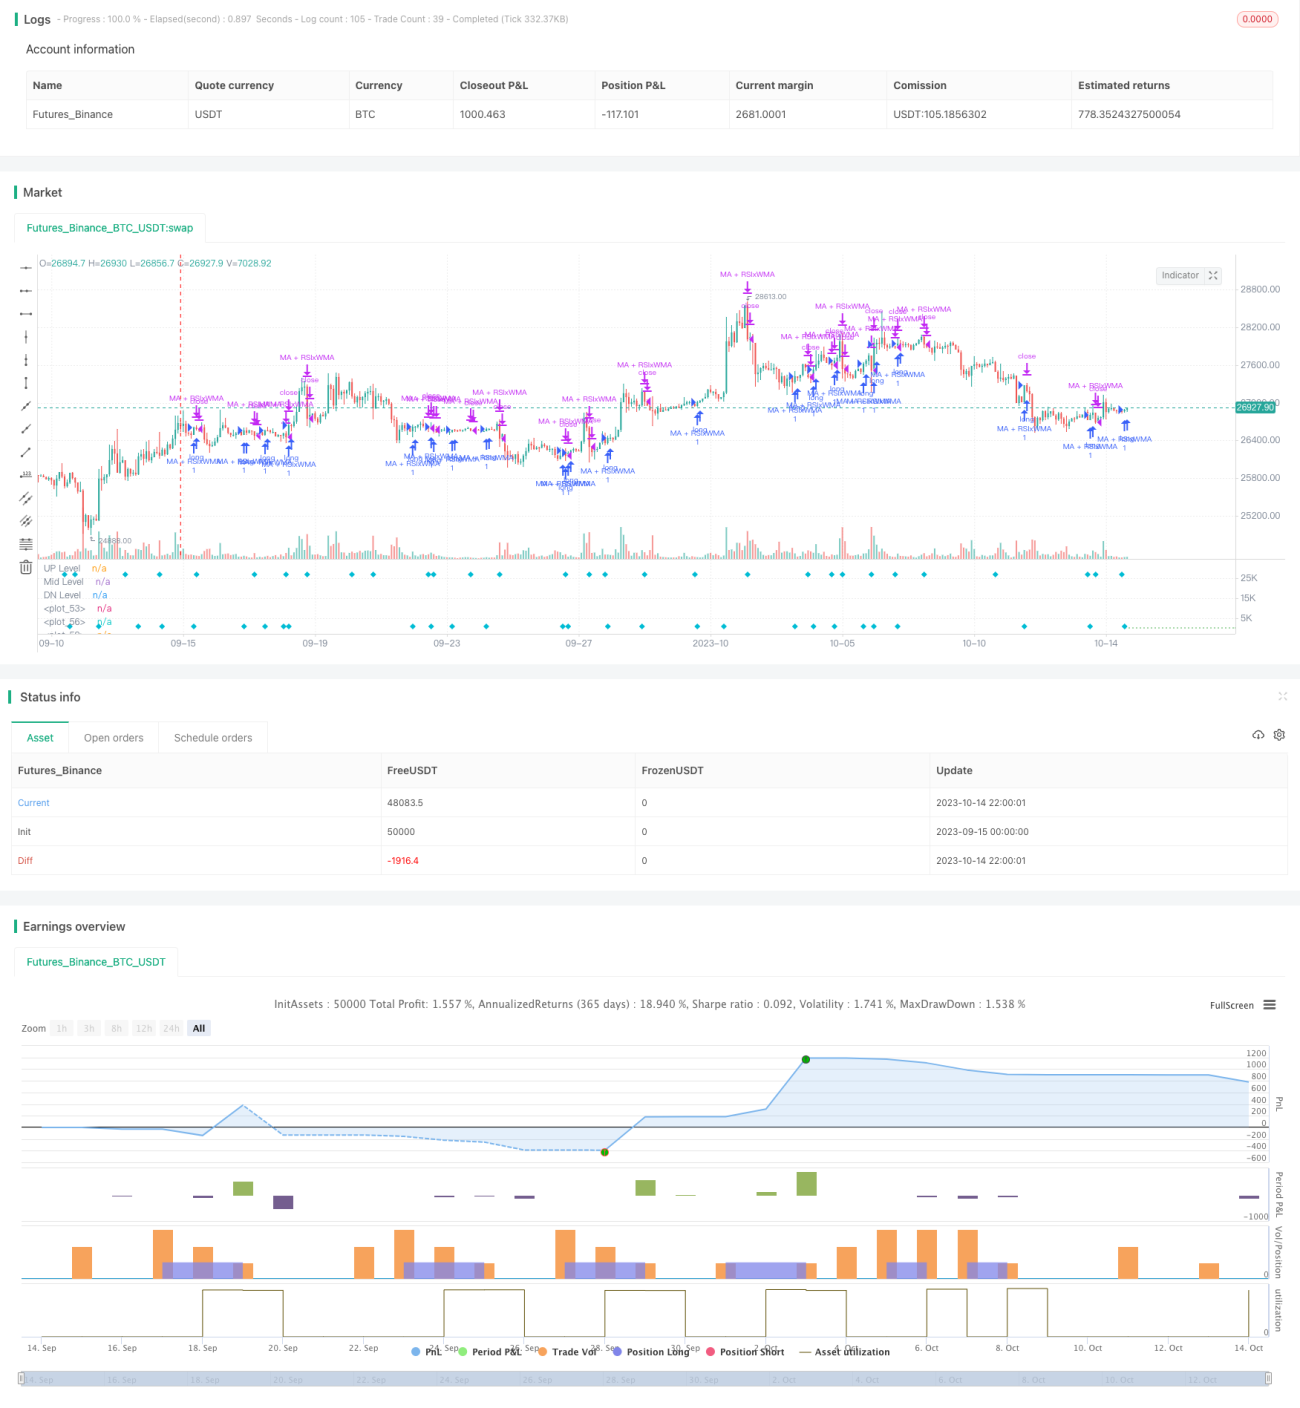
Idea teras strategi ini adalah untuk menggunakan indeks yang agak kuat (RSI) dan purata bergerak dari tempoh masa yang berbeza untuk mengenal pasti titik-titik perubahan trend, untuk menangkap trend garis panjang dan garis pendek pada masa yang sama. Strategi ini menggabungkan pelbagai isyarat perdagangan untuk meningkatkan kadar kejayaan perdagangan.
Prinsip Strategi
- Hitung RSI, EMA garis pantas dan WMA garis perlahan.
- Sinyal beli / jual dihasilkan apabila garis RSI menembusi purata bergerak WMA.
- Apabila garis pantas EMA menembusi garis perlahan WMA, ia menghasilkan isyarat beli/jual.
- Apabila RSI dan EMA meletupkan WMA pada masa yang sama, ia menghasilkan isyarat beli/jual yang kuat.
- Pada masa yang sama, isyarat utama boleh diperkuat apabila harga menembusi purata bergerak tambahan.
- Tetapkan keadaan berhenti dan hentikan
Strategi ini mengintegrasikan isyarat penembusan dari pelbagai petunjuk teknikal, moving averages dengan parameter yang berbeza untuk mengenal pasti trend dalam tempoh yang berbeza, dan dengan itu meningkatkan kebolehpercayaan strategi. Indeks RSI menilai keadaan overbought dan oversold, EMA yang cepat menilai trend jangka pendek, WMA yang perlahan menilai trend pertengahan, harga dan penembusan yang disahkan oleh purata tambahan.
Analisis kelebihan
- Menggunakan ciri-ciri pembalikan RSI, anda boleh mengambil peluang pembalikan di kawasan overbought dan oversold.
- Membantu purata bergerak sebagai penapis trend untuk mengelakkan pecah palsu.
- Dalam kombinasi dengan pelbagai tempoh masa, ia boleh mengesan trend garis panjang dan menangkap peluang garis pendek.
- Dengan menggunakan pelbagai isyarat indikator, ia dapat meningkatkan kadar kejayaan dagangan.
- Tetapkan strategi stop loss untuk mengawal risiko secara proaktif.
Analisis risiko
- RSI mudah menghasilkan isyarat palsu dan memerlukan penapis purata bergerak tambahan.
- Rebound di bawah trend kitaran besar mungkin mencetuskan isyarat perdagangan terbalik dan perlu diambil dengan berhati-hati.
- Pengaturan parameter yang perlu dioptimumkan, seperti tempoh kitaran RSI, kitaran purata bergerak dan sebagainya.
- Pengaturan titik henti perlu berhati-hati untuk mengelakkan terhalang.
Risiko boleh dikurangkan dengan cara seperti pengoptimuman parameter, strategi penutupan kerugian yang ketat, dan mempertimbangkan trend kitaran besar.
Arah pengoptimuman
- Optimumkan parameter RSI untuk mencari panjang kitaran yang optimum.
- Uji pelbagai jenis gabungan purata bergerak.
- Menambah indikator kadar turun naik seperti ATR, penyesuaian dinamik stop loss stop position.
- Tambah modul pengurusan jumlah transaksi.
- Menggunakan teknologi pembelajaran mesin untuk optimasi parameter dan penilaian kualiti isyarat.
ringkaskan
Strategi ini mengintegrasikan trend tracking dan pemikiran perdagangan berbalik titik, dengan analisis pelbagai kerangka masa dan penggunaan pelbagai indikator secara komprehensif, dengan tujuan untuk meningkatkan kadar kemenangan perdagangan. Kunci adalah untuk mengawal risiko dengan baik, mengoptimumkan parameter, dan mempertimbangkan kesan trend kitaran besar terhadap perdagangan apabila sesuai.
- 1