Strategi perdagangan dua hala berdasarkan RSI dan SuperTrend
Gambaran keseluruhan
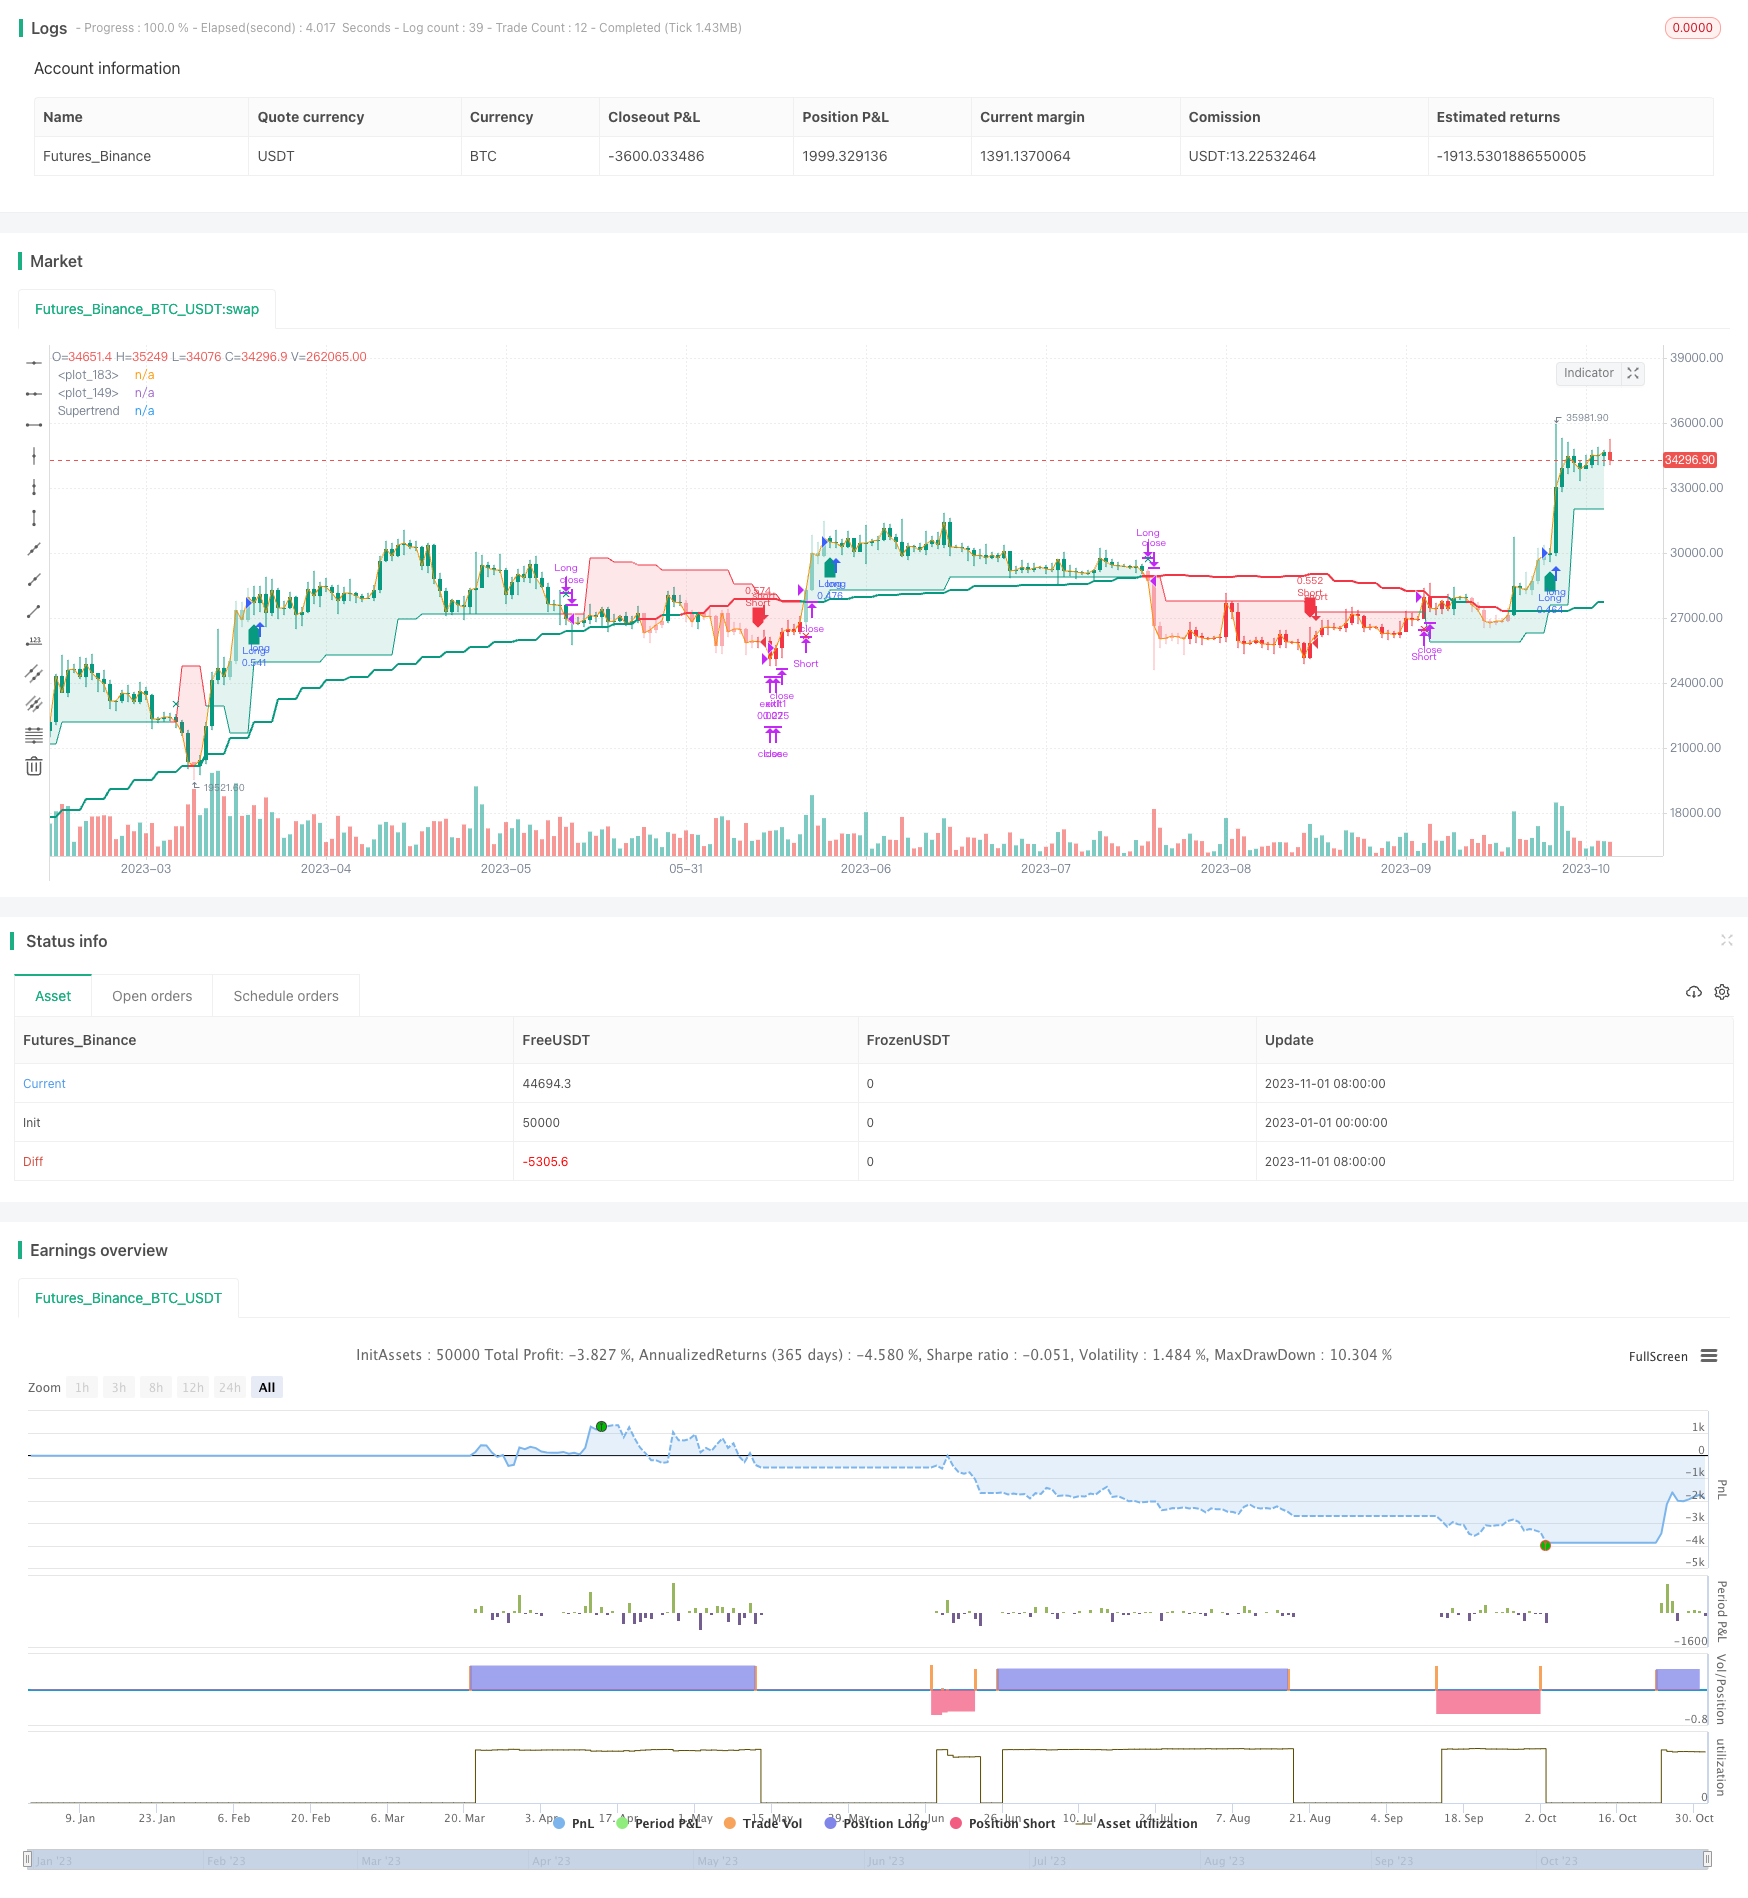
Ini adalah strategi perdagangan dua hala yang menggunakan RSI dan SuperTrend secara komprehensif. Strategi ini bertujuan untuk mengenal pasti kekuatan dan kelemahan pasaran dan menukar kedudukan tepat pada masanya apabila arah trend berubah untuk mendapatkan keuntungan yang lebih tinggi.
Prinsip Strategi
Strategi ini berdasarkan kepada prinsip-prinsip berikut:
Menggunakan RSI untuk menilai kekuatan dan kelemahan pasaran semasa. Apabila RSI lebih tinggi daripada 50, ia adalah pasaran yang kuat, dan apabila ia lebih rendah daripada 50, ia adalah pasaran yang lemah.
Menggunakan indikator SuperTrend sebagai penapis trend. Isyarat perdagangan dikeluarkan hanya apabila harga menembusi SuperTrend.
Apabila RSI memberi isyarat yang kuat, jika harga menembusi ke atas, lakukan lebih banyak; jika harga menembusi ke bawah, lakukan kedudukan yang sama.
Apabila RSI memberi isyarat kelemahan, jika harga menembusi ke bawah, ia akan ditutup; jika harga menembusi ke atas, ia akan ditutup.
Dengan penukaran multi-kawasan RSI untuk menangkap titik-titik perubahan trend, operasi pertukaran kedudukan dilakukan tepat pada masanya.
Pelaksanaan
Hitung nilai RSI, panjang 14, dengan 50 sebagai sempadan untuk menilai kekuatan dan kelemahan.
Hitung Indeks SuperTrend, panjang 10, kali 2 .
Apabila RSI lebih tinggi daripada 50 dan harga menembusi SuperTrend, buat lebih banyak. Apabila RSI lebih rendah daripada 50 dan harga menembusi SuperTrend, buat kosong.
Apabila telah dilakukan lebih banyak, jika RSI melemah dan harga menembusi SuperTrend, maka ia akan diatasi. Apabila telah dibuat kosong, jika RSI melemah dan harga menembusi SuperTrend, maka ia akan diatasi.
Ia boleh dikonfigurasikan untuk melakukan lebih atau kosong sahaja.
Kelebihan Strategik
Strategi ini menggabungkan trend tracking dan overbought/oversold dengan kelebihan berikut:
Ia boleh menangkap perubahan trend pada masa yang tepat, mengurangkan risiko yang tidak perlu diambil.
Indeks RSI dapat menentukan kawasan overbought dan oversold dengan berkesan untuk mengelakkan kenaikan dan penurunan sebelum pasaran bertukar.
SuperTrend lebih baik untuk menghapuskan bunyi bising di pasaran dan mengikuti trend garis tengah-panjang.
Gabungan RSI dan SuperTrend dapat meningkatkan kestabilan strategi.
Parameter strategi ini mempunyai ruang yang luas untuk pengoptimuman dan boleh disesuaikan dengan varieti dan kitaran yang berbeza.
Menyokong hanya melakukan banyak atau hanya melakukan apa-apa mod, dapat bertindak secara fleksibel untuk pelbagai jenis situasi.
Risiko Strategik
Strategi ini mempunyai beberapa risiko:
Indeks RSI mudah menghasilkan isyarat palsu, yang perlu digabungkan dengan harga yang disahkan secara empirik.
Tetapan parameter penunjuk SuperTrend yang tidak betul boleh menyebabkan titik celah atau mengejar tinggi membunuh rendah.
Kombinasi dua indikator mempunyai risiko penyebaran, perlu menyesuaikan parameter untuk kecocokan optimum.
Apabila keadaan berubah secara mendadak, hentian boleh dikeluarkan, dan anda perlu menetapkan kedudukan hentian yang wajar.
Elakkan daripada melakukan reverse positioning berhampiran kawasan sokongan dan rintangan yang penting.
Pengoptimuman Strategi
Strategi ini juga boleh dioptimumkan dengan:
Sesuaikan parameter RSI untuk mencari panjang optimum untuk menapis isyarat palsu.
Mengoptimumkan parameter SuperTrend untuk meningkatkan kesan pengesanan trend.
Uji kombinasi parameter untuk pelbagai jenis dan tempoh yang berbeza untuk mencari parameter yang optimum.
Menambah penapis untuk penunjuk lain seperti MACD, KDJ dan lain-lain untuk meningkatkan ketepatan isyarat.
Menambah sokongan penting untuk keputusan, isyarat strategi kualitatif, seperti rintangan, garis Brin, dan purata pergerakan.
Mengoptimumkan strategi hentikan kerugian, meminimumkan kebarangkalian hentikan kerugian yang dikeluarkan dalam sekejap, dengan syarat untuk memastikan keberkesanan hentikan kerugian.
ringkaskan
Strategi ini mengintegrasikan kelebihan kedua-dua petunjuk RSI dan SuperTrend, dapat mengenal pasti perubahan trend pasaran dalam jangka masa pertengahan dengan berkesan, dan melakukan operasi pertukaran antara kenaikan harga dan kenaikan harga. Dengan pengoptimuman parameter, ia dapat disesuaikan dengan keadaan pasaran yang lebih luas. Tetapi juga perlu berhati-hati dengan beberapa masalah biasa, seperti isyarat palsu, ParameterSet, dan lain-lain.
/*backtest
start: 2023-01-01 00:00:00
end: 2023-11-02 00:00:00
period: 1d
basePeriod: 1h
exchanges: [{"eid":"Futures_Binance","currency":"BTC_USDT"}]
*/

// This source code is subject to the terms of the Mozilla Public License 2.0 at https://mozilla.org/MPL/2.0/
//@version=5
//Created by @CITIAlgo
// —————————————————————————————————————————————————————————————————————————————————————————————————————————

strategy('CITI Trends A with RSI Candles', shorttitle = "CITI Trends A" , overlay = true ,
         initial_capital   = 10000,
         commission_value  = 0.025,
         default_qty_value = 25,
         slippage          = 1,
         pyramiding        = 0,
         max_lines_count   = 500,
         max_labels_count  = 500,
         currency          = currency.USD,
         default_qty_type  = strategy.percent_of_equity)

bullColor1 =  #089981
bearColor1 =  #f23645
bullColor2 =  #3873e3
bearColor2 =  #630ef5
neutralColor1 = #d5d5d5

//Base Settings
groupBase = "Base Settings ---------------------------------------"
Repaint_type = input.string('Non-Repainting', "Allow Repainting ?", options = ['Non-Repainting', 'Repainting'], inline ='repaint' , group = groupBase , tooltip = 'The default value is Non-Repainting. To learn more visit https://www.tradingview.com/pine-script-docs/en/v5/concepts/Repainting.html')

//Configure trade direction
tradeDirection = input.string("Both", title="Trade Direction", options=["Long", "Short", "Both"] , group=groupBase , inline = 'Type' )

longOK  = tradeDirection == "Long" or tradeDirection == "Both"
shortOK = tradeDirection == "Short" or tradeDirection == "Both"

var bool PlotEntries = input.bool (true, "Show Entries" ,group=groupBase , inline = 'Signals' )
var bool PlotExits = input.bool (true, "Show Exits" , group=groupBase, inline = 'Signals' )

//Display Settings
groupDisplay = "Display Settings ------------------------------------"

MomBars = input.bool( true , title="Apply Bar Colors", inline = 'candles' , group=groupDisplay)

cbullColor = input.color( bullColor1  , 'Candle Colors' ,  inline = 'candles1a',group=groupDisplay)
cbearColor =  input.color( bearColor1  , '' ,  inline = 'candles1a',group=groupDisplay)

//Candle & label Colors
Bullish_Bars    = color.new( cbullColor , 0)
WBullish_Bars   = color.new( cbullColor , 60)
Bearish_Bars    = color.new( cbearColor , 0)
WBearish_Bars   = color.new( cbearColor , 60)

lbullColor = input.color( bullColor1  , 'Long/Short Labels' ,  group=groupDisplay, inline = 'Signals1' )
lbearColor =  input.color( bearColor1 , ''  , group=groupDisplay, inline = 'Signals1' )

st_status = input.bool( true , title="Show Supertrend", inline = 'st' , group=groupDisplay)
st_bullColor = input.color( bullColor1  , '' ,  group=groupDisplay, inline = 'st' )
st_bearColor =  input.color( bearColor1 , ''  , group=groupDisplay, inline = 'st' )

//Build Your Signals Settings
groupEntry = " Trend & Signal Settings---------------------"
Entry1a = input.bool(true, title= "Entry", inline='entry1a', group=groupEntry)
Exit1a  = input.bool(false, title= "Exit | Strong/Weak Momentum", inline='entry1a', group=groupEntry)
Entry1b = input.bool(false,  title=  'Entry'  , inline='entry1b', group=groupEntry)
Exit1b  = input.bool(false, title= 'Exit | Bull/Bear Momentum'  , inline='entry1b', group=groupEntry)

Entry3a = input.bool(false, title= "Filter", inline='entry3a', group=groupEntry)
Exit3a  = input.bool(false, title= "Exit | MA ", inline='entry3a', group=groupEntry)

Entry4a = input.bool(false, title= "Filter | Disable RSI Ranges ", inline='entry4a', group=groupEntry)
Entry4b = input.bool(true, title= "Filter", inline='entry4b', group=groupEntry)
Exit4b  = input.bool(true, title= "Exit | Supertrend ", inline='entry4b', group=groupEntry)
Entry4c = input.bool(true, title= "Filter | Disable Supertrend Ranges ", inline='entry4c', group=groupEntry)
// —————————————————————————————————————MTF FUNCTIONS
// —————————— PineCoders MTF Selection Framework functions
// ————— Converts current "timeframe.multiplier" plus the TF into minutes of type float.
f_resInMinutes() =>
    _resInMinutes = timeframe.multiplier * (timeframe.isseconds ? 1. / 60. : timeframe.isminutes ? 1. : timeframe.isdaily ? 1440. : timeframe.isweekly ? 10080. : timeframe.ismonthly ? 43800. : na)
    _resInMinutes

// Get current resolution in float minutes.
var ResInMinutes = f_resInMinutes()

// ————— Returns resolution of _resolution period in minutes.
f_tfResInMinutes(_res) =>
    // _res: resolution of any TF (in "timeframe.period" string format).
    request.security(syminfo.tickerid, _res, f_resInMinutes())

// ————— Returns a multiple of current resolution as a string in "timeframe.period" format usable with "security()".
f_multipleOfRes(_res, _mult) =>
    // _res:  current resolution in minutes, in the fractional format supplied by f_resInMinutes() companion function.
    // _mult: Multiple of current TF to be calculated.
    // Convert current float TF in minutes to target string TF in "timeframe.period" format.
    _targetResInMin = _res * math.max(_mult, 1)
    // Find best string to express the resolution.
    _targetResInMin <= 0.083 ? '5S' : _targetResInMin <= 0.251 ? '15S' : _targetResInMin <= 0.501 ? '30S' : _targetResInMin <= 1440 ? str.tostring(math.round(_targetResInMin)) : _targetResInMin <= 43800 ? str.tostring(math.round(math.min(_targetResInMin / 1440, 365))) + 'D' : str.tostring(math.round(math.min(_targetResInMin / 43800, 12))) + 'M'

// ————— Converts current resolution
f_resInString(_res) =>
    // _res: resolution of any TF (in "timeframe.period" string format).
      _res  == "1"   ? "1m"  :
      _res  == "3"   ? "3m"  :
      _res  == "5"   ? "5m"  :
      _res  == "15"  ? "15m" :
      _res  == "30"  ? "30m" :
      _res  == "45"  ? "45m" :
      _res  == "60"  ? "1h"  :
      _res  == "120" ? "2h"  :
      _res  == "180" ? "3h"  :
      _res  == "240" ? "4h"  :
      _res  == "1D"  ? "D"   :
      _res  == "1W"  ? "W"   :
      _res  == "1M"  ? "M"   : _res

//Set repaint security function
repaint_sw = Repaint_type == 'Non-Repainting' ? false : true
f_security(_symbol, _res, _src, _repaint) => request.security(_symbol, _res, _src[_repaint ? 0 : barstate.isrealtime ? 1 : 0] , barmerge.gaps_off, barmerge.lookahead_on)[_repaint ? 0 : barstate.isrealtime ? 0 : 1]
f_source(_res , source) => f_security(syminfo.tickerid , _res , source , repaint_sw )

Type1 = 'Auto Multiplied TF'
Type2 = 'Fixed TF'
//---------------------------------------------------------------------------
//RSI Settings // INPUTS
groupRange   = "RSI Settings  ----------------------------------"

TF1type = input.string( Type1, 'TF' ,  options=[Type1,Type2] , inline ='tf1' , group=groupRange)
setHTF1a = input.int( 4 , '' , inline ='tf1', group=groupRange)
setHTF1b = input.timeframe( 'D' , '' , inline ='tf1', group=groupRange)
// Get HTF from user-defined mode.
var TF1 = TF1type == Type1 ? f_multipleOfRes(ResInMinutes, setHTF1a) : setHTF1b

mLength    =  input.int( 14  ,  "RSI Length"  ,inline='lines', group=groupRange)
BullLevel  = input.int( 50 ,  "Bullish Level | Above 50       ",inline='lines1a', group=groupRange)
BearLevel  = input.int( 50 , "Bearish Level | Below 50        ",inline='lines1b', group=groupRange)

ma_length  = input.int( 21  ,  "MA Length"  ,inline='ma', group=groupRange)
ma_status  = input.bool( true ,  "Show MA" ,inline='ma1', group=groupRange)
ma_bullColor = input.color( bullColor1  , '' ,  inline='ma1', group=groupRange)
ma_bearColor =  input.color( bearColor1 , ''  , inline='ma1', group=groupRange)
//--------------------------------------------------------------------------
//Momentum Calculations
f_momTF( _tf ) =>
    _isShow =  f_tfResInMinutes(_tf) >= f_resInMinutes()
    close_ = f_source(_tf , close)
    rsi_ = _isShow ? f_security(syminfo.tickerid , _tf, ta.rsi( close_, mLength) , repaint_sw) : na
    ma = _isShow ? f_security(syminfo.tickerid , _tf, ta.vwma( hlc3 , ma_length ) , repaint_sw) : na
    [rsi_ , ma]

[ rsi , ma ] = f_momTF(TF1)

ma_color = close > ma ? ma_bullColor : ma_bearColor
plot( ma_status ? ma : na , color = ma_color , linewidth = 2 , style = plot.style_line)
//---------------------------------------------------------------------------
//Supertrend Settings // INPUTS
groupST   = "Supertrend Settings  ----------------------------------"

TF2type = input.string( Type1, 'TF' ,  options=[Type1,Type2] , inline ='tf2' , group=groupST)
setHTF2a = input.int( 4 , '' , inline ='tf2', group=groupST)
setHTF2b = input.timeframe( 'D' , '' , inline ='tf2', group=groupST)
// Get HTF from user-defined mode.
var TF2 = TF2type == Type1 ? f_multipleOfRes(ResInMinutes, setHTF2a) : setHTF2b

stLength =  input.int( 10  ,  "Supertrend Length"  ,inline='lines', group=groupST)
stmult =  input.int( 2  ,  "Mult"  ,inline='lines', group=groupST)
stHighlights        = input.bool( true ,  "Highlights",inline='lines1a', group=groupST)

f_st( _tf) =>
    _isShow =  f_tfResInMinutes(_tf) >= f_resInMinutes()
    close_ = f_source(_tf , close)
    atr= f_security(syminfo.tickerid , _tf, ta.atr(stLength) , repaint_sw)
    Up=close_ -(stmult*atr)
    Dn=close_ +(stmult*atr)
    TrendUp = 0.0
    TrendUp := close_[1]>TrendUp[1] ? math.max(Up,TrendUp[1]) : Up
    TrendDown = 0.0
    TrendDown := close_[1]<TrendDown[1]? math.min(Dn,TrendDown[1]) : Dn
    Trend = 0.0
    Trend := close_ > TrendDown[1] ? 1: close_< TrendUp[1]? -1: nz(Trend[1],1)
    stLine = Trend==1? TrendUp: TrendDown
    [Trend, stLine]
[Trend, stLine] = f_st( TF2 )

stTrend = close > stLine ? 1:-1
stplot = plot( st_status? stLine : na , color=  stTrend ==1 ? st_bullColor : st_bearColor , linewidth=1 ,title ="Supertrend")

priceLineP = plot( close , color=  na , linewidth=1 , display = display.none)
fill(priceLineP , stplot , color = stHighlights ? stTrend ==1 ? color.new(st_bullColor , 85) : color.new( st_bearColor , 85 ) : na )

//---------------------------------------------------------------------------
//Momentum BarColors

mom2a = rsi > BullLevel  ? Bullish_Bars : WBullish_Bars
mom2b = rsi < BearLevel  ? Bearish_Bars : WBearish_Bars
mom2_color = close > ma ? mom2a : mom2b

mom_color = MomBars ? mom2_color : na
barcolor(mom_color)
//-------------------------------------------------
//Momentum Strength & Values
momVal2a = rsi > BullLevel  ? 2 : 1
momVal2b = rsi < BearLevel  ? -2 : -1
momVal2 = close > ma   ? momVal2a : momVal2b

momVal = momVal2

///==============================================================================================================
//Long Trend Conditions
Entry1aL = Entry1a ? momVal == 2 : true
Entry1bL = Entry1b ? momVal == 1 or momVal == 2 : true

Entry3aL = Entry3a ? close > ma : true
Entry4aL = Entry4a ? rsi > BullLevel : true
Entry4bL = Entry4b ? close > stLine : true
Entry4cL = Entry4c ? stLine > stLine[1] : true
//------
noEntry = Entry1a == false and Entry1b  == false and Entry3a == false and Entry4a == false and Entry4b == false and Entry4c == false ? false : true
noExit  = Exit1a == false and Exit1b == false and Exit3a == false  and Exit4b == false  ? false : true
//------
EntryL =  noEntry and Entry1aL and Entry1bL and Entry3aL and Entry4aL and Entry4bL and Entry4cL

Exit1aL = Exit1a ? momVal == 1 and momVal[1] == 2 : true
Exit1bL = Exit1b ? momVal == -1  or momVal == -2 : true
Exit3aL = Exit3a ? close < ma : true
Exit4bL = Exit4b ? close < stLine  : true

ExitL = noExit and Exit1aL  and Exit3aL and Exit1bL and Exit4bL

//Short Trend Conditions
Entry1aS = Entry1a ? momVal == -2 : true
Entry1bS = Entry1b ? momVal == -1 or momVal == -2 : true

Entry3aS = Entry3a ? close < ma  : true
Entry4aS = Entry4a ? rsi < BearLevel  : true
Entry4bS = Entry4b ? close < stLine  : true
Entry4cS = Entry4c ? stLine < stLine[1] : true

EntryS =  noEntry and Entry1aS and Entry1bS and Entry3aS  and Entry4aS and Entry4bS and Entry4cS

Exit1aS = Exit1a ? momVal == -1 and momVal[1] == -2 : true
Exit1bS = Exit1b ? momVal == 1 or momVal == 2 : true
Exit3aS = Exit3a ? close > ma : true
Exit4bS = Exit4b ? close > stLine : true

ExitS  = noExit and Exit1aS and Exit3aS and Exit1bS and Exit4bS

///==============================================================================================================
//Entry & exit conditions

isLong = false
isLong := nz(isLong[1], false)
isShort = false
isShort := nz(isShort[1], false)

goLong = not isLong and EntryL and not ExitL and longOK and barstate.isconfirmed
goShort = not isShort and EntryS and not ExitS and shortOK and barstate.isconfirmed
longExit = isLong and ExitL and barstate.isconfirmed
shortExit = isShort and ExitS and barstate.isconfirmed

if (goLong)
    isLong := true
    isShort := false

if (goShort)
    isLong := false
    isShort := true

if (longExit)
    isLong := false
if (shortExit)
    isShort := false

//------------------------------------------------------------------------------
// ——Backtester
grouptime           = 'Step 5 - 📆 Time Filter 📆-------------'
startTime      = input    (group=grouptime, title="Start Timeㅤㅤ", defval=timestamp('UTC 01 Jan 2020 00:00'),  inline="Start")
endTime        = input    (group=grouptime, title="End Time ㅤ ㅤ", defval=timestamp('UTC 31 Dec 2025 23:45'),  inline="End")

dateRange = true
//------------------------------------------------------------------------------
// Risk Managment
grouprisk               = 'Step 6 - Risk Management-------------'

takeprofit = input.bool(true,title = "TP Price %",group=grouprisk, inline="profit")
tppercent = input.float(1, '', group=grouprisk, inline="profit") / 100
q1 = input.int    (5 ,              "Quantity %",group=grouprisk , inline="profit")

stoploss = input.bool(false,title = "SL Price %",group=grouprisk, inline="loss")
stoppercent = input.float(5, '', group=grouprisk, inline="loss") / 100

// Determine where you've entered and in what direction
longtp = strategy.position_avg_price * (1 + tppercent)
longStop = strategy.position_avg_price * (1 - stoppercent)
shorttp = strategy.position_avg_price * (1 - tppercent)
shortStop = strategy.position_avg_price * (1 + stoppercent)

QTYMethod               = input.string ('EQUITY',        'Order Size',    group=grouprisk, inline=' ', options=['NONE', 'EQUITY', 'SIZE', 'CONTRACTS'])
useNetProfit            = input.bool   (true,            'Use Net Profit',     group=grouprisk, inline=' ', tooltip='Use Net Profit- On/Off the use of profit in the following trades. *Only works if the type is EQUITY')
riskPerc                = input.int    (30,              '🇪🇶🇺🇮🇹🇾 %',              group=grouprisk, inline='.', minval=1, maxval=100)
riskSize                = input.int    (10000,            '🇸🇮🇿🇪',                group=grouprisk, inline='.', minval=1)
riskCntr                = input.int    (1,               '🇨🇴🇳🇹🇷🇦🇨🇹🇸',           group=grouprisk, inline='.', minval=1, tooltip='Order Size: \nNone- Use the default position size settings in Tab "Properties". \nEquity% - per trade from the initial capital. \nSize- Fixed size amount of trade. \nContracts- The fixed amount of the deal in contracts. \n')

// —————— Order Size
eqty = switch QTYMethod
    'NONE'      => na
    'EQUITY'    => riskPerc / close
    'SIZE'      => riskSize / close
    'CONTRACTS' => riskCntr
//-----------------------------------------------------------------------------
// —————— Trade variables
entry        = strategy.position_avg_price
sizePos      = strategy.position_size
inLong       = sizePos > 0
inShort      = sizePos < 0
inTrade      = inLong or inShort
inPos        = (inLong and not inShort[1]) or (inShort and not inLong[1])
var ID       = 'TradeID'
var tpPrice  = float(na)
var slPrice  = float(na)

///==============================================================================================================
// ALERTS
groupalerts = 'Step 7 - Alerts & Bot Trading Settings-------------'

broker = input.string('Binance', "Broker", options=['Binance', 'Alpaca', 'Kucoin', '3Commas'], group=groupalerts, tooltip = 'Choose which type you are using to send the correct Json Alert message for entry and exit alerts.')
my_sym = input("FTMM/USDT", "Ticker", group = 'Cloud Function Server', tooltip = 'Only used with Alerts to fix ticker ID in json message. Some exchanges use the forward slash and some do not.')
my_pass = input('Passphrase', "Passphrase" , group = 'Cloud Function Server', tooltip = 'Only enter your Passphrase and nothing else goes here. Only needed when using a Cloud Function Server.')
i_alert_3CID_txt = input('Bot ID', "Bot ID", group =groupalerts, tooltip = 'Only enter your 3Commas Bot ID and nothing else goes here.')
i_alert_3CET_txt = input('Bot Email Token', title = 'Bot Email Token', group =groupalerts , tooltip = 'Only enter your 3Commas Bot Email Token and nothing else goes here.')

Alert='{"passphrase": "'+str.tostring(my_pass)+'","symbol": "'+ str.tostring(my_sym) +'","type":"market", "side":"{{strategy.order.action}}","amount":"{{strategy.order.contracts}}","price": "' + str.tostring(close) + '"}'
//---------------------------------------------------------------------------------
// JSON alert message used for 3Commas Bots
C3_EntryAlert ='{"message_type": "bot",  "bot_id": ' + i_alert_3CID_txt + ',  "email_token": "' + i_alert_3CET_txt + '", "delay_seconds": 0 }'
C3_ExitAlert ='{"action": "close_at_market_price_all",  "message_type": "bot",  "bot_id": ' + i_alert_3CID_txt + ',  "email_token": "' + i_alert_3CET_txt + '", "delay_seconds": 0}'
//---------------------------------------------------------------------------------
// JSON alert message used for setting up a Google Cloud Function Server works when using Alpaca Exchange
Alert_Alpaca = '{"symbol": "{{ticker}}", "quantity": "{{strategy.order.contracts}}", "side": "{{strategy.order.action}}", "order_type": "market", "time_in_force": "gtc", "passphrase": "' + str.tostring(my_pass) + '"}'

entryAlert = broker == 'Binance' ? Alert : broker == 'Alpaca' ? Alert_Alpaca : broker == 'Kucoin' ? Alert : C3_EntryAlert
exitAlert = broker == 'Binance' ? Alert : broker == 'Alpaca' ? Alert_Alpaca : broker == 'Kucoin' ? Alert : C3_ExitAlert
strategy.initial_capital = 50000
// —————— Entry's
goLongEntry = goLong and dateRange and barstate.isconfirmed
goShortEntry = goShort and dateRange and barstate.isconfirmed

eqty(qty) => QTYMethod=='EQUITY' ? qty / 100 * (strategy.initial_capital + (useNetProfit ? strategy.netprofit : 0)) : QTYMethod=='SIZE' ? qty / syminfo.pointvalue : qty
if goLongEntry
    ID := 'Long'
    strategy.entry(ID, strategy.long,  qty=eqty(eqty), comment=ID, alert_message = entryAlert)

if goShortEntry
    ID := 'Short'
    strategy.entry(ID, strategy.short, qty=eqty(eqty), comment=ID, alert_message = entryAlert)

// —————— Exit's
qty(perc) => math.abs(sizePos*perc/100)

if longExit
    strategy.close("Long",comment='X', alert_message= exitAlert)
strategy.exit ("exit1", from_entry="Long", limit=takeprofit ? longtp : na, stop=stoploss ? longStop : na, comment_profit='TP', comment_loss='SL', qty_percent=q1)
strategy.exit ("exit2", from_entry="Long", stop=stoploss ? longStop : na, comment_loss='SL')

if shortExit
    strategy.close("Short",comment='X', alert_message= exitAlert)
strategy.exit ("exit1", from_entry="Short", limit=takeprofit ? shorttp : na, stop=stoploss ? shortStop : na, comment_profit='TP', comment_loss='SL', qty_percent=q1)
strategy.exit ("exit2", from_entry="Short", stop=stoploss ? shortStop : na, comment_loss='SL')

///==============================================================================================================

//Style- Plots on Chart
posH = high + 2 * stLine
posL = low - 2 * stLine

plotshape( goLong and PlotEntries ? posL : na ,'Long Entry Signals' , text= '' , location=location.belowbar, style=shape.labelup , size=size.small ,  color=lbullColor , textcolor = color.white )
plotshape( longExit and PlotExits ? posH : na  ,'Long Exit' , location=location.abovebar, style= shape.xcross  , size=size.small,  color=lbullColor )
plotshape( goShort and PlotEntries ? posH : na ,'Short Entry Signals'  , text= '' , location=location.abovebar, style=shape.labeldown , size=size.small  , color=lbearColor  , textcolor = color.white )
plotshape( shortExit and PlotExits ? posL : na  ,'Short Exit' , location=location.belowbar, style=shape.xcross   , size=size.small ,   color=lbearColor )

///==============================================================================================================
// Alerts
alertcondition( goLong  , 'Long Entry Alerts', 'Long Alerts')
alertcondition( goShort , 'Short Entry Alerts', 'Short Alerts')