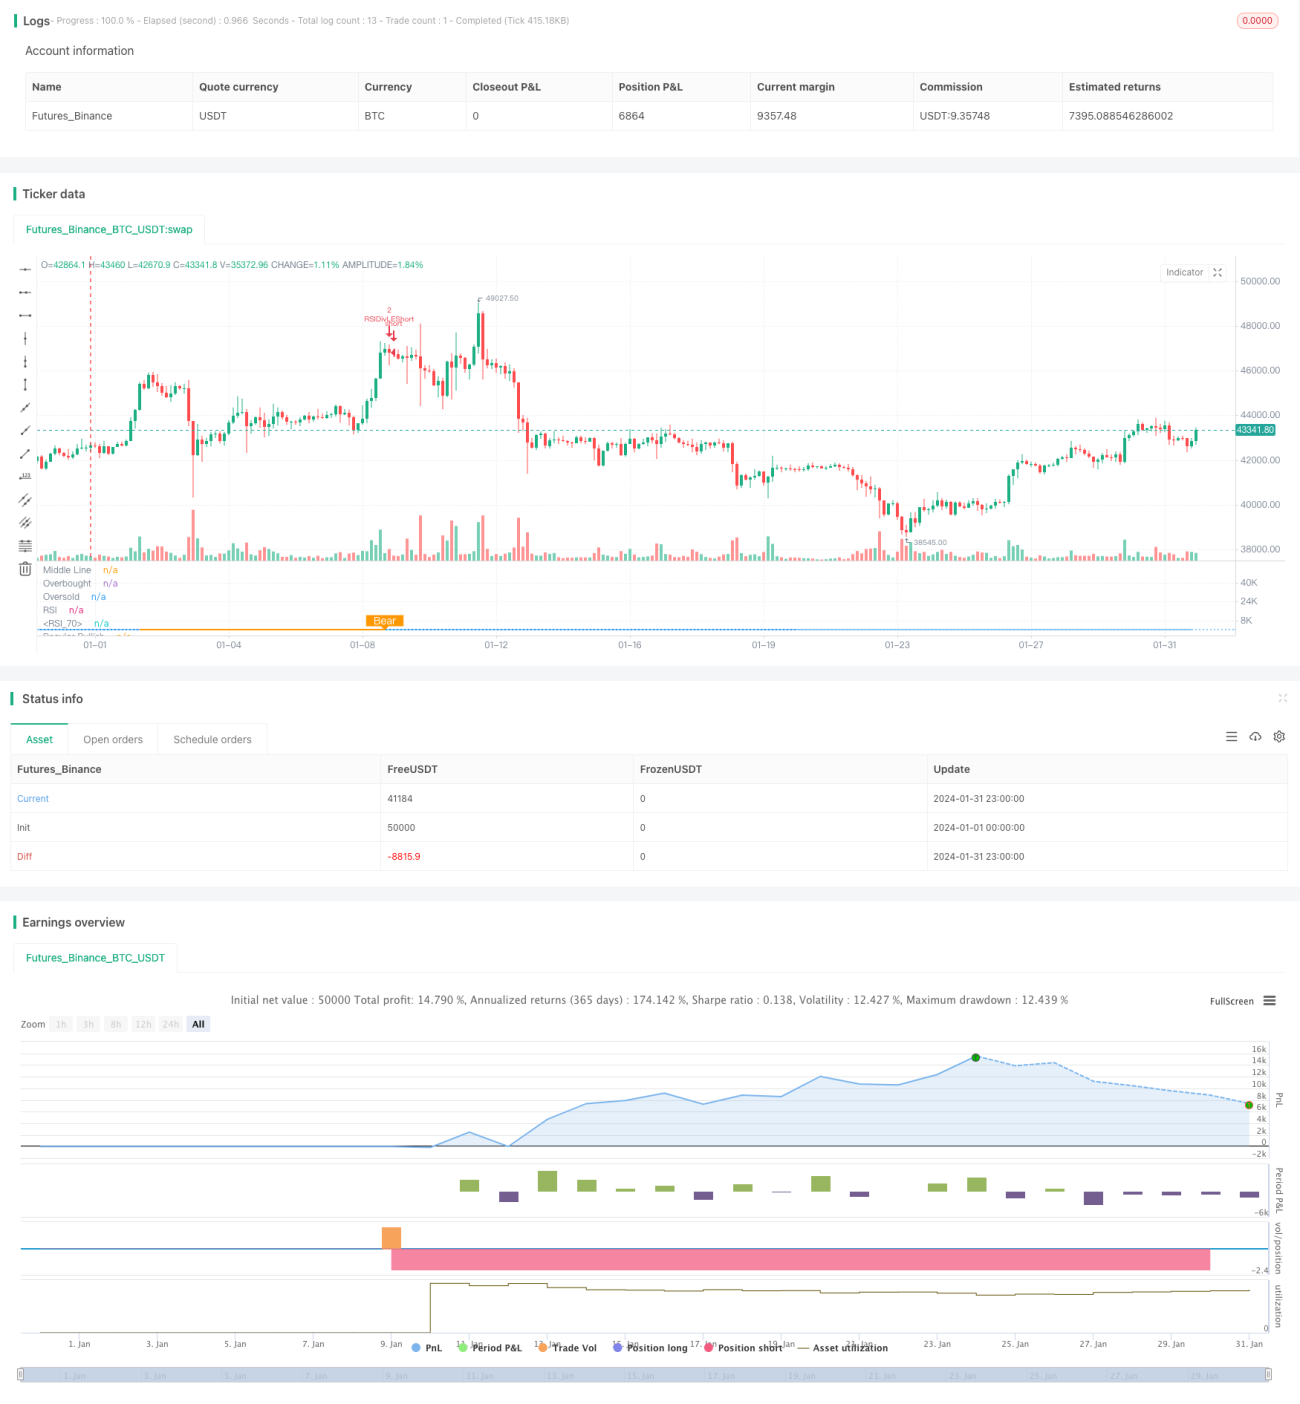
Strategi ini menggunakan RSI untuk mengenal pasti fenomena perpecahan kosong dan membuat keputusan perdagangan berdasarkan itu. Gagasan utamanya adalah apabila harga muncul rendah tetapi RSI muncul tinggi, membentuk tanda pelincir kepala yang menunjukkan bahawa dasar telah terbentuk, lakukan lebih banyak; apabila harga muncul tinggi tetapi RSI muncul rendah, membentuk tanda pelincir kepala yang menunjukkan bahawa puncak telah terbentuk, lakukan kosong.
Strategi ini menggunakan indikator RSI untuk mengenal pasti perbezaan antara harga dan RSI.
Dengan mengenal pasti perbezaan antara harga dan RSI, anda dapat menangkap titik perubahan harga lebih awal dan membuat keputusan perdagangan berdasarkannya.
Strategi ini mempunyai kelebihan utama:
Strategi ini juga mempunyai risiko:
RSI tidak selalu menunjukkan bahawa harga akan berpatah balik dengan serta-merta, dan mungkin ada perbezaan masa, yang menyebabkan risiko tercetus. Penyelesaian adalah dengan melonggarkan stop loss dengan tepat, memberi harga masa yang cukup untuk mengesahkan isyarat pemisahan.
Penyelesaian adalah dengan menggunakan rSI yang lebih lama atau RSI yang lebih lama sebagai syarat penapisan.
Perbezaan terlalu kecil juga tidak dapat mengesahkan perubahan trend, dan perlu membesarkan jarak pengulangan dengan betul untuk mencari perpecahan RSI yang lebih jelas.
Strategi ini juga boleh dioptimumkan dalam beberapa arah:
Mengoptimumkan parameter RSI untuk mencari kombinasi parameter terbaik
Cuba tanda teknikal lain seperti MACD, KD dan lain-lain untuk mengenal pasti fenomena pemisahan kosong
Menambah syarat penapisan yang sesuai untuk mengelakkan lebih banyak kesalahan transaksi semasa tempoh gejolak
Mencari isyarat gabungan yang terbaik dengan RSI yang mempunyai lebih banyak kitaran masa
Strategi dagangan pemisahan ruang RSI dengan mengenal pasti fenomena pemisahan ruang antara indikator RSI dan harga, menilai titik peralihan pergerakan harga, dan berdasarkan itu membina isyarat perdagangan. Strategi ini mudah digunakan, dengan mengoptimumkan parameter dan menambah syarat penapisan, anda dapat meningkatkan peluang keuntungan lebih lanjut.
/*backtest
start: 2024-01-01 00:00:00
end: 2024-01-31 23:59:59
period: 3h
basePeriod: 15m
exchanges: [{"eid":"Futures_Binance","currency":"BTC_USDT"}]
*/
// This source code is subject to the terms of the Mozilla Public License 2.0 at https://mozilla.org/MPL/2.0/
// © Nextep
//@version=4
strategy(title="RSI top&bottom destroy ", overlay=false, pyramiding=4, default_qty_value=2, default_qty_type=strategy.fixed, initial_capital=10000, currency=currency.USD)
// INPUT Settings --------------------------------------------------------------------------------------------------------------------------------------------------
len = input(title="RSI Period", minval=1, defval=13)
src = input(title="RSI Source", defval=close)
// defining the lookback range for shorts
lbRshort = input(title="Short Lookback Right", defval=1)
lbLshort = input(title="Short Lookback Left", defval=47)
// defining the lookback range for longs
lbRlong = input(title="Long Lookback Right", defval=2)
lbLlong = input(title="Long Lookback Left", defval=14)
rangeUpper = input(title="Max of Lookback Range", defval=400)
rangeLower = input(title="Min of Lookback Range", defval=1)
// take profit levels
takeProfitLongRSILevel = input(title="Take Profit at RSI Level", minval=0, defval=75)
takeProfitShortRSILevel = input(title="Take Profit for Short at RSI Level", minval=0, defval=25)
// Stop loss settings
longStopLossType = input("PERC", title="Long Stop Loss Type", options=['ATR','PERC', 'FIB', 'NONE'])
shortStopLossType = input("PERC", title="Short Stop Loss Type", options=['ATR','PERC', 'FIB', 'NONE'])
longStopLossValue = input(title="Long Stop Loss Value", defval=14, minval=0)
shortStopLossValue = input(title="Short Stop Loss Value", defval=5, minval=-10)
// PLOTTING THE CHARTS --------------------------------------------------------------------------------------------------------------------------------------------------
// Plotting the Divergence
plotBull = input(title="Plot Bullish", defval=true)
plotBear = input(title="Plot Bearish", defval=true)
bearColor = color.orange
bullColor = color.green
textColor = color.white
noneColor = color.new(color.white, 100)
// Adding the RSI oscillator
osc = rsi(src, len)
ma_len = 14 // Length for the moving average
rsi_ma = sma(osc, ma_len) // Calculate the moving average of RSI
plot(osc, title="RSI", linewidth=1, color=color.purple)
plot(rsi_ma, color=color.blue, title="RSI MA") // Plot the RSI MA
// Adding the lines of the RSI oscillator
plot(osc, title="RSI", linewidth=1, color=color.purple)
hline(50, title="Middle Line", linestyle=hline.style_dotted)
obLevel = hline(75, title="Overbought", linestyle=hline.style_dotted)
osLevel = hline(25, title="Oversold", linestyle=hline.style_dotted)
fill(obLevel, osLevel, title="Background", color=color.purple, transp=80)
atrLength = input(14, title="ATR Length (for Trailing stop loss)")
atrMultiplier = input(3.5, title="ATR Multiplier (for Trailing stop loss)")
// RSI PIVOTS --------------------------------------------------------------------------------------------------------------------------------------------------
// Define a condition for RSI pivot low
isFirstPivotLowlong = not na(pivotlow(osc, lbLlong, lbRlong))
// Define a condition for RSI pivot high
isFirstPivotHighlong = not na(pivothigh(osc, lbLlong, lbRlong))
// Define a condition for the first RSI value
firstPivotRSIValuelong = isFirstPivotLowlong ? osc[lbRlong] : na
// Define a condition for the second RSI value
secondPivotRSIValuelong = isFirstPivotLowlong ? valuewhen(isFirstPivotLowlong, osc[lbRlong], 1) : na
// Define a condition for RSI pivot low
isFirstPivotLowshort = not na(pivotlow(osc, lbLshort, lbRshort))
// Define a condition for RSI pivot high
isFirstPivotHighshort = not na(pivothigh(osc, lbLshort, lbRshort))
// Define a condition for the first RSI value
firstPivotRSIValueshort = isFirstPivotLowshort ? osc[lbRshort] : na
// Define a condition for the second RSI value
secondPivotRSIValueshort = isFirstPivotLowshort ? valuewhen(isFirstPivotLowshort, osc[lbRshort], 1) : na
_inRange(cond) =>
bars = barssince(cond == true)
rangeLower <= bars and bars <= rangeUpper
// ADDITIONAL ENTRY CRITERIA --------------------------------------------------------------------------------------------------------------------------------------------------
// RSI crosses RSI MA up by more than 2 points and subsequently down
rsiUpCross = crossover(osc, rsi_ma + 1)
rsiDownCross = crossunder(osc, rsi_ma - 1)
// Calculate the daily RSI
rsiDaily = security(syminfo.ticker, "D", rsi(src, 14))
// BULLISH CONDITIONS --------------------------------------------------------------------------------------------------------------------------------------------------
// LOWER LOW PRICE & HIGHER LOW OSC
// Price: Lower Low
priceLL = na(isFirstPivotLowlong[1]) ? false : (low[lbRlong] < valuewhen(isFirstPivotLowlong, low[lbRlong], 1))
// Osc: Higher Low
oscHL = na(isFirstPivotLowlong[1]) ? false : (osc[lbRlong] > valuewhen(isFirstPivotLowlong, osc[lbRlong], 1) and _inRange(isFirstPivotLowlong[1]))
// BULLISH PLOT
bullCond = plotBull and priceLL and oscHL and isFirstPivotLowlong
plot(
isFirstPivotLowlong ? osc[lbRlong] : na,
offset=-lbRlong,
title="Regular Bullish",
linewidth=2,
color=(bullCond ? bullColor : noneColor),
transp=0
)
plotshape(
bullCond ? osc[lbRlong] : na,
offset=-lbRlong,
title="Regular Bullish Label",
text=" Bull ",
style=shape.labelup,
location=location.absolute,
color=bullColor,
textcolor=textColor,
transp=0
)
// BEARISH CONDITIONS --------------------------------------------------------------------------------------------------------------------------------------------------
// HIGHER HIGH PRICE & LOWER LOW OSC
// Osc: Lower High
oscLH = na(isFirstPivotHighshort[1]) ? false : (osc[lbRshort] < valuewhen(isFirstPivotHighshort, osc[lbRshort], 1) and _inRange(isFirstPivotHighshort[1]))
// Price: Higher High
priceHH = na(isFirstPivotHighshort[1]) ? false : (high[lbRshort] > valuewhen(isFirstPivotHighshort, high[lbRshort], 1))
// BEARISH PLOT
bearCond = plotBear and priceHH and oscLH and isFirstPivotHighshort
plot(
isFirstPivotHighshort ? osc[lbRshort] : na,
offset=-lbRshort,
title="Regular Bearish",
linewidth=2,
color=(bearCond ? bearColor : noneColor),
transp=0
)
plotshape(
bearCond ? osc[lbRshort] : na,
offset=-lbRshort,
title="Regular Bearish Label",
text=" Bear ",
style=shape.labeldown,
location=location.absolute,
color=bearColor,
textcolor=textColor,
transp=0
)
// ENTRY CONDITIONS --------------------------------------------------------------------------------------------------------------------------------------------------
longCondition = false
shortCondition = false
// Entry Conditions
longCondition := bullCond
shortCondition := bearCond
// Conditions to prevent entering trades based on daily RSI
longCondition := longCondition and rsiDaily >= 23
shortCondition := shortCondition and rsiDaily <= 80
// STOPLOSS CONDITIONS --------------------------------------------------------------------------------------------------------------------------------------------------
// Stoploss Conditions
long_sl_val =
longStopLossType == "ATR" ? longStopLossValue * atr(atrLength)
: longStopLossType == "PERC" ? close * longStopLossValue / 100 : 0.00
long_trailing_sl = 0.0
long_trailing_sl := strategy.position_size >= 1 ? max(low - long_sl_val, nz(long_trailing_sl[1])) : na
// Calculate Trailing Stop Loss for Short Entries
short_sl_val =
shortStopLossType == "ATR" ? 1 - shortStopLossValue * atr(atrLength)
: shortStopLossType == "PERC" ? close * (shortStopLossValue / 100) : 0.00 //PERC = shortstoplossvalue = -21300 * 5 / 100 = -1065
short_trailing_sl = 0.0
short_trailing_sl := strategy.position_size <= -1 ? max(high + short_sl_val, nz(short_trailing_sl[1])) : na
// RSI STOP CONDITION
rsiStopShort = (strategy.position_avg_price != 0.0 and close <= strategy.position_avg_price * 0.90) or (strategy.position_avg_price != 0.0 and rsi(src, 14) >= 75)
rsiStopLong = (strategy.position_avg_price != 0.0 and close >= strategy.position_avg_price * 1.10) or (strategy.position_avg_price != 0.0 and rsi(src, 14) <= 25)
// LONG CONDITIONS --------------------------------------------------------------------------------------------------------------------------------------------------
strategy.entry(id="RSIDivLELong", long=true, when=longCondition)
strategy.entry(id="RSIDivLEShort", long=false, when=shortCondition)
// Close Conditions
shortCloseCondition = bullCond // or cross(osc, takeProfitShortRSILevel)
strategy.close(id="RSIDivLEShort", comment="Close All="+tostring(-close + strategy.position_avg_price, "####.##"), when=abs(strategy.position_size) <= -1 and shortStopLossType == "NONE" and shortCloseCondition )
strategy.close(id="RSIDivLEShort", comment="TSL="+tostring(-close + strategy.position_avg_price, "####.##"), when=abs(strategy.position_size) >= -1 and ((shortStopLossType == "PERC" or shortStopLossType == "ATR") and cross(short_trailing_sl,high))) // or rsiStopShort)// or rsiStopShort)
longCloseCondition = bearCond
strategy.close(id="RSIDivLELong", comment="Close All="+tostring(close - strategy.position_avg_price, "####.##"), when=abs(strategy.position_size) >= 1 and longStopLossType == "NONE" and longCloseCondition)
strategy.close(id="RSIDivLELong", comment="TSL="+tostring(close - strategy.position_avg_price, "####.##"), when=abs(strategy.position_size) >= 1 and ((longStopLossType == "PERC" or longStopLossType == "ATR") and cross(long_trailing_sl,low))) //or rsiStopLong