BRAHMASTRA
Autora:ChaoZhang, Data: 2022-05-13 14:39:00Tags:WMA
Em qualquer momento, você verá até 4 linhas de tendência neste script.
▶ Linha de tendência que se une às altas pivô em condição de tendência ascendente ▶ Linha de tendência que se une aos mínimos do pivô em tendência ascendente ▶ Linha de tendência que se une às altas pivô em condição de tendência descendente ▶ Linha de tendência que se junta a pivots mínimos em condições de tendência descendente
A linha mais antiga permanecerá até que a nova venha através do mesmo tipo. portanto, você ainda será capaz de ver as linhas de tendência alta e baixa de tendência ascendente para os instrumentos de tendência descendente que foram criados há muito tempo!! Além disso, as novas linhas de tendência substituem as antigas apenas se forem mais fortes (conectar a mais pivots com menos transbordamento)
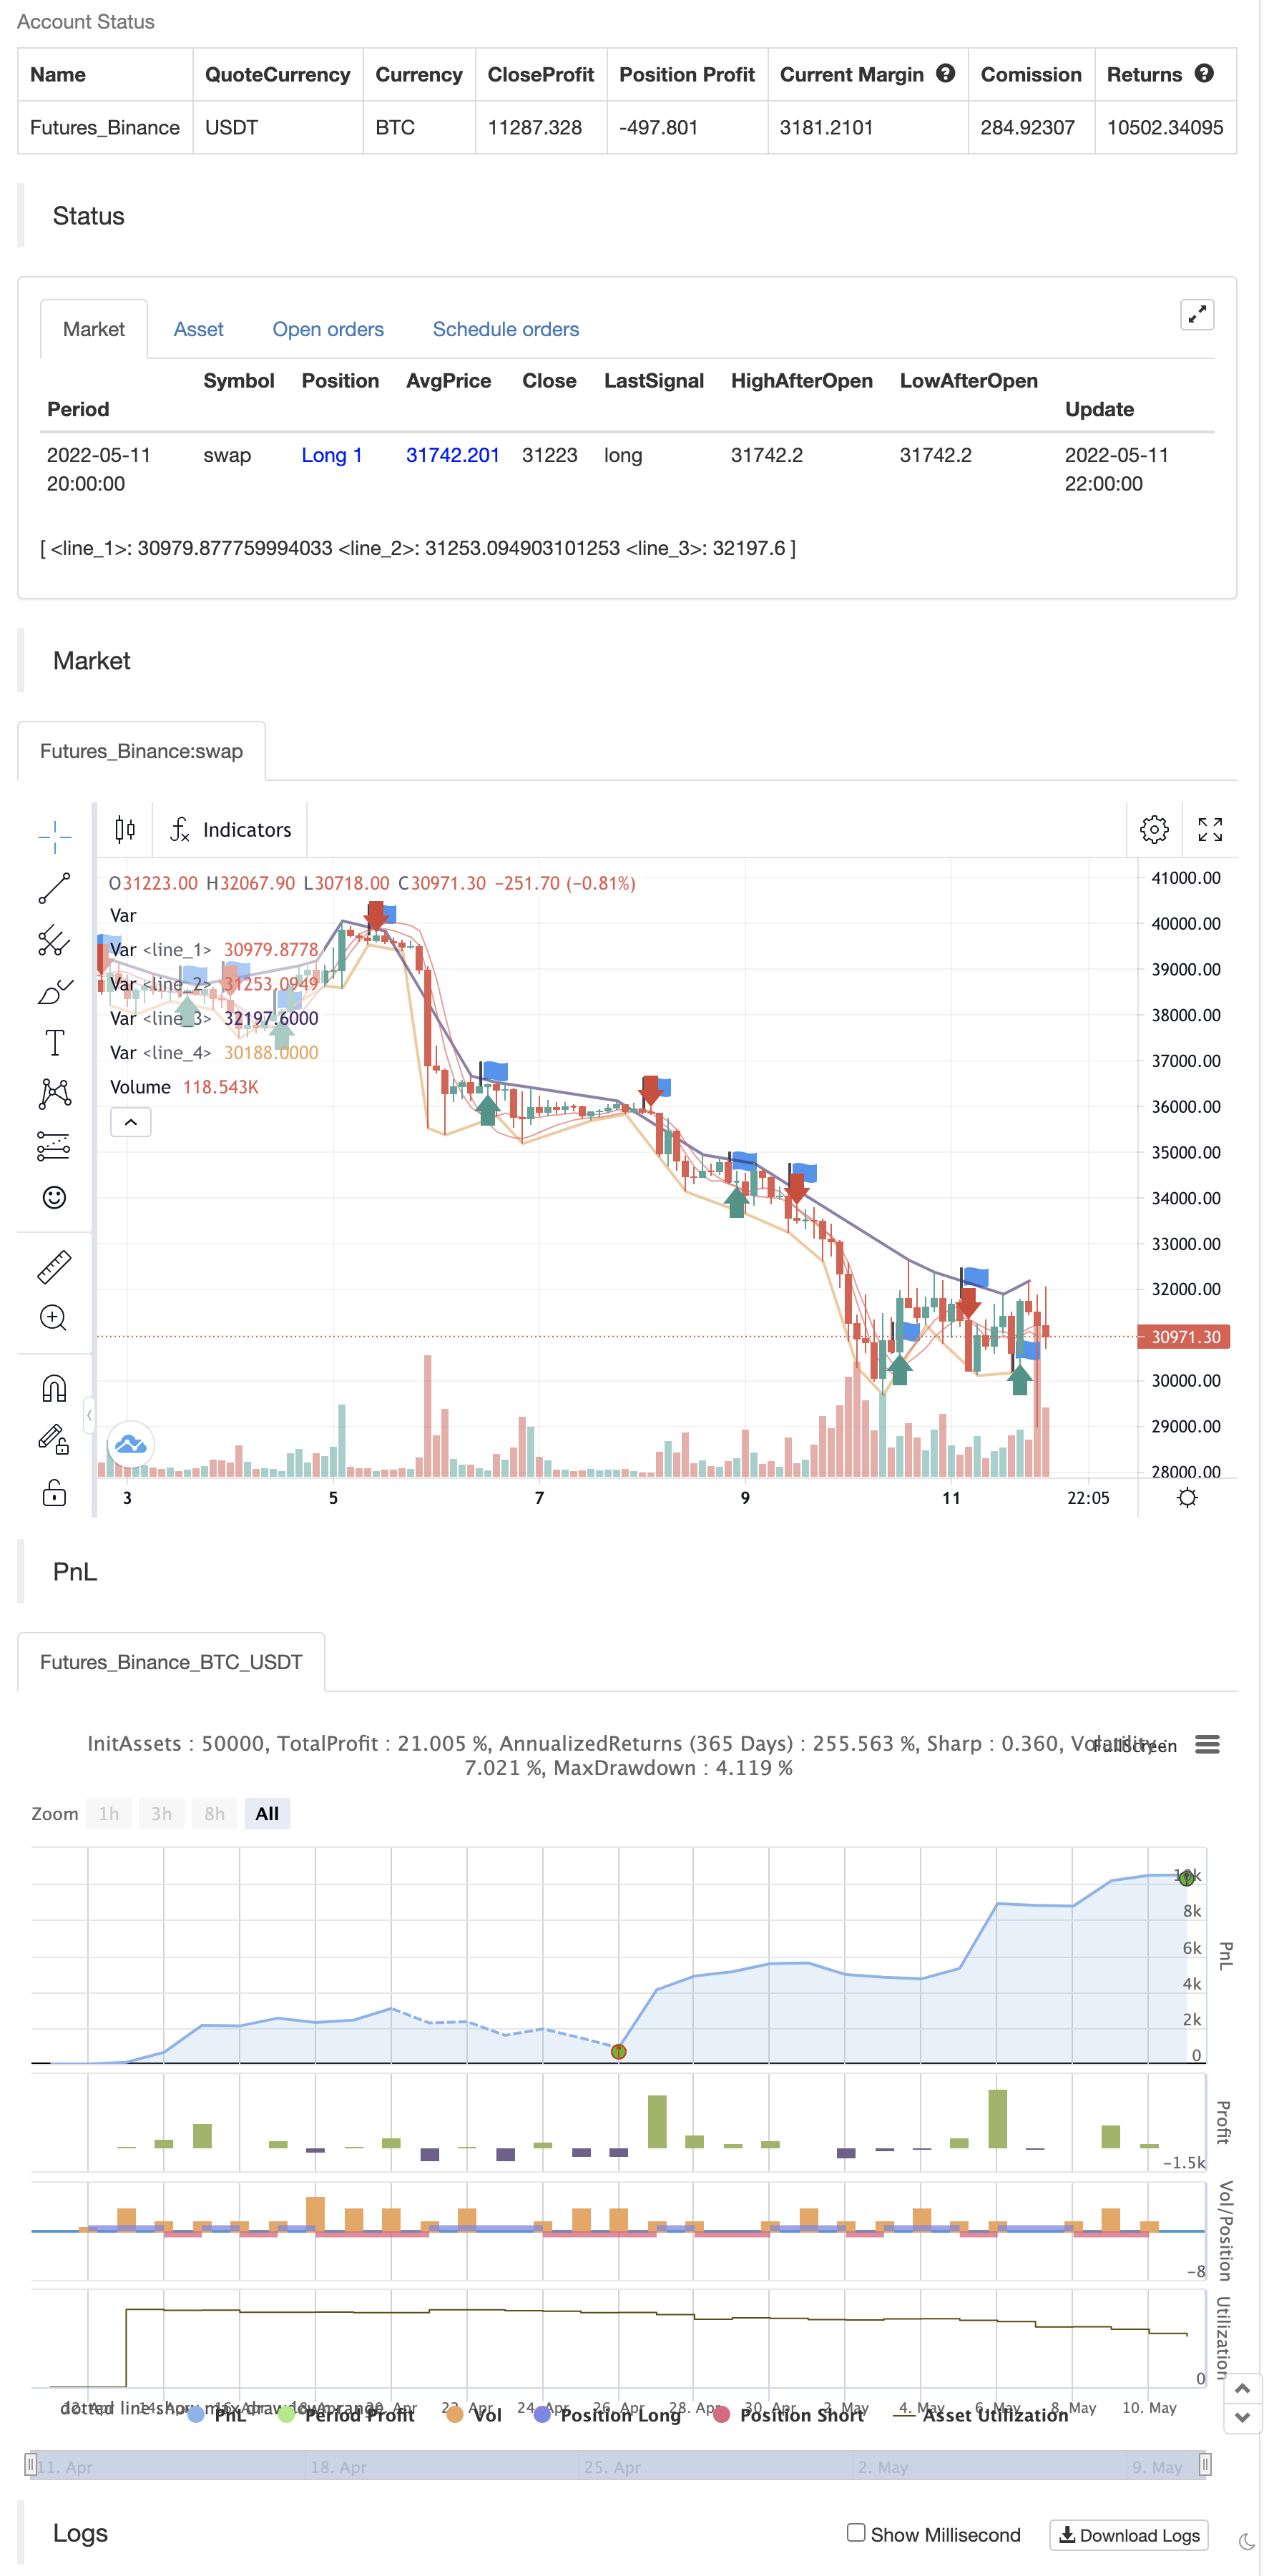
backtest
/*backtest
start: 2022-04-12 00:00:00
end: 2022-05-11 23:59:00
period: 2h
basePeriod: 15m
exchanges: [{"eid":"Futures_Binance","currency":"BTC_USDT"}]
*/

//@version=4
study("BRAHMASTRA", precision=2, overlay=true)
// compilation: capissimo

// This script utilizes two modules, Trendlines Module (by Joris Duyck) and HMA-Kahlman Trend Module.
// Trendlines module produces crossovers predictive of the next local trend.

//*** HMA-Kahlman Trend Module
price  = input(hl2,  "Price Data (hl2)")
hkmod  = input(true, "===HMA-Kahlman Trend Module===")
length = input(22,   "Lookback Window", minval=2)
k      = input(true, "Use Kahlman")
gain   = input(.7,   "Gain", minval=.0001, step=.01)
labels = input(true, "Show Labels?")
o      = input(true, "Use Offset")

hma(x, p) => wma((2 * wma(x, p / 2)) - wma(x, p), round(sqrt(p)))

hma3() => p = length/2, wma(wma(close, p/3)*3 - wma(close, p/2) - wma(close, p), p)

kahlman(x, g) =>
    kf = 0.0
    dk = x - nz(kf[1], x)
    smooth = nz(kf[1],x)+dk*sqrt(g*2)
    velo = 0.0
    velo := nz(velo[1],0) + (g*dk)
    kf := smooth+velo

a = k ? kahlman(hma(price, length), gain) : hma(price, length)
b = k ? kahlman(hma3(), gain) : hma3()
c = b > a ? color.lime : color.red
crossdn = a > b and a[1] < b[1]
crossup = b > a and b[1] < a[1]
ofs = o ? -1 : 0

fill(plot(a,color=c,linewidth=1,transp=75), plot(b,color=c,linewidth=1,transp=75), color=c, transp=55)
plotshape(labels and crossdn ? a : na, location=location.abovebar, style=shape.labeldown, color=color.red, size=size.tiny, text="S", textcolor=color.white, transp=0, offset=ofs)
plotshape(labels and crossup ? a : na, location=location.belowbar, style=shape.labelup, color=color.green, size=size.tiny, text="B", textcolor=color.white, transp=0, offset=ofs)

//*** Trendlines Module, see https://www.tradingview.com/script/mpeEgn5J-Trendlines-JD/
tlmod = input(true, "===Trendlines Module===")
l1    = input(2,    "Pivots Lookback Window", minval=1)

trendline(input_function, delay, only_up) => // Calculate line coordinates (Ax,Ay) - (Bx,By)
    var int Ax = 0, var int Bx = 0, var float By = 0.0, var float slope = 0.0
    Ay = fixnan(input_function)
    if change(Ay)!=0
        Ax := time[delay], By:= Ay[1], Bx := Ax[1]
        slope := ((Ay-By)/(Ax-Bx))
    else
        Ax := Ax[1], Bx := Bx[1], By := By[1]

    var line trendline=na, var int Axbis=0, var float Aybis=0.0, var bool xtend=true
    extension_time = 0
    Axbis := Ax + extension_time
    Aybis := (Ay + extension_time*slope)
    if tlmod and change(Ay)!=0
        line_color = slope*time<0?(only_up?na:color.red):(only_up?color.lime:na)
        if not na(line_color)
            trendline = line.new(Bx,By,Axbis, Aybis, xloc.bar_time, extend=xtend?extend.right:extend.none, color=line_color, style=line.style_dotted, width=1)
            line.delete(trendline[1])
    slope

pivot(len) =>
    high_point = pivothigh(high, len,len/2)
    low_point  = pivotlow(low, len,len/2)
    slope_high = trendline(high_point, len/2,false)
    slope_low  = trendline(low_point, len/2,true)
    [high_point, low_point, slope_high, slope_low]

[high_point1, low_point1, slope_high1, slope_low1] = pivot(l1)

color_high1 = slope_high1 * time<0 ? color.red : na
color_low1  = slope_low1  * time>0 ? color.lime : na
plot(tlmod ? high_point1 : na, color=color_high1, offset=-l1/2, linewidth=2)
plot(tlmod ? low_point1  : na, color=color_low1, offset=-l1/2, linewidth=2)


if crossup
    strategy.entry("Enter Long", strategy.long)
else if crossdn
    strategy.entry("Enter Short", strategy.short)
- Estratégia de negociação quantitativa baseada na média móvel do casco modificado e no Ichimoku Kinko Hyo
- Estratégia quantitativa de negociação baseada em médias móveis e bandas de Bollinger
- VWMA-ADX Momentum e Estratégia de longo prazo do Bitcoin baseada em tendências
- Criação fácil
- Estratégia de criptografia Low Scanner
- Scalping EMA ADX RSI com compra/venda
- Divergência de volume
- Hull Moving Average Swing Trader
- Estratégia do Hull Suite
- Maximizador de lucro PMax
- Estratégia Swing Hull/rsi/EMA
- Ghosts Tracking Trends é uma base de dados estratégica
- O Ghosts Trends está seguindo estratégias do banco de dados
- Estratégias de rastreamento de tendências de fantasmas
- Oscilador Arco-íris
- Exemplo de dimensionamento da posição da curva de capital
- Demo do KLineChart
- Estratégia de Supertendência Villa Dynamic Pivot
- A Super Tendência do Crodl
- RSI por zdmre
- FTL - Filtro de alcance X2 + EMA + UO
- Bandas de Mobo
- SAR + 3SMMA com SL & TP
- SSS
- Modelo de alertas de lançamento lunar [indicador]
- HALFTREND + HEMA + SMA (estratégia de sinal falso)
- RSI Divergência com Pivot, BB, SMA, EMA, SMMA, WMA, VWMA
- RSI e BB e simultaneamente OverSold
- Velas de Heikin Ashi
- Combinação 2/20 EMA e Filtro de banda
- A ESSMA