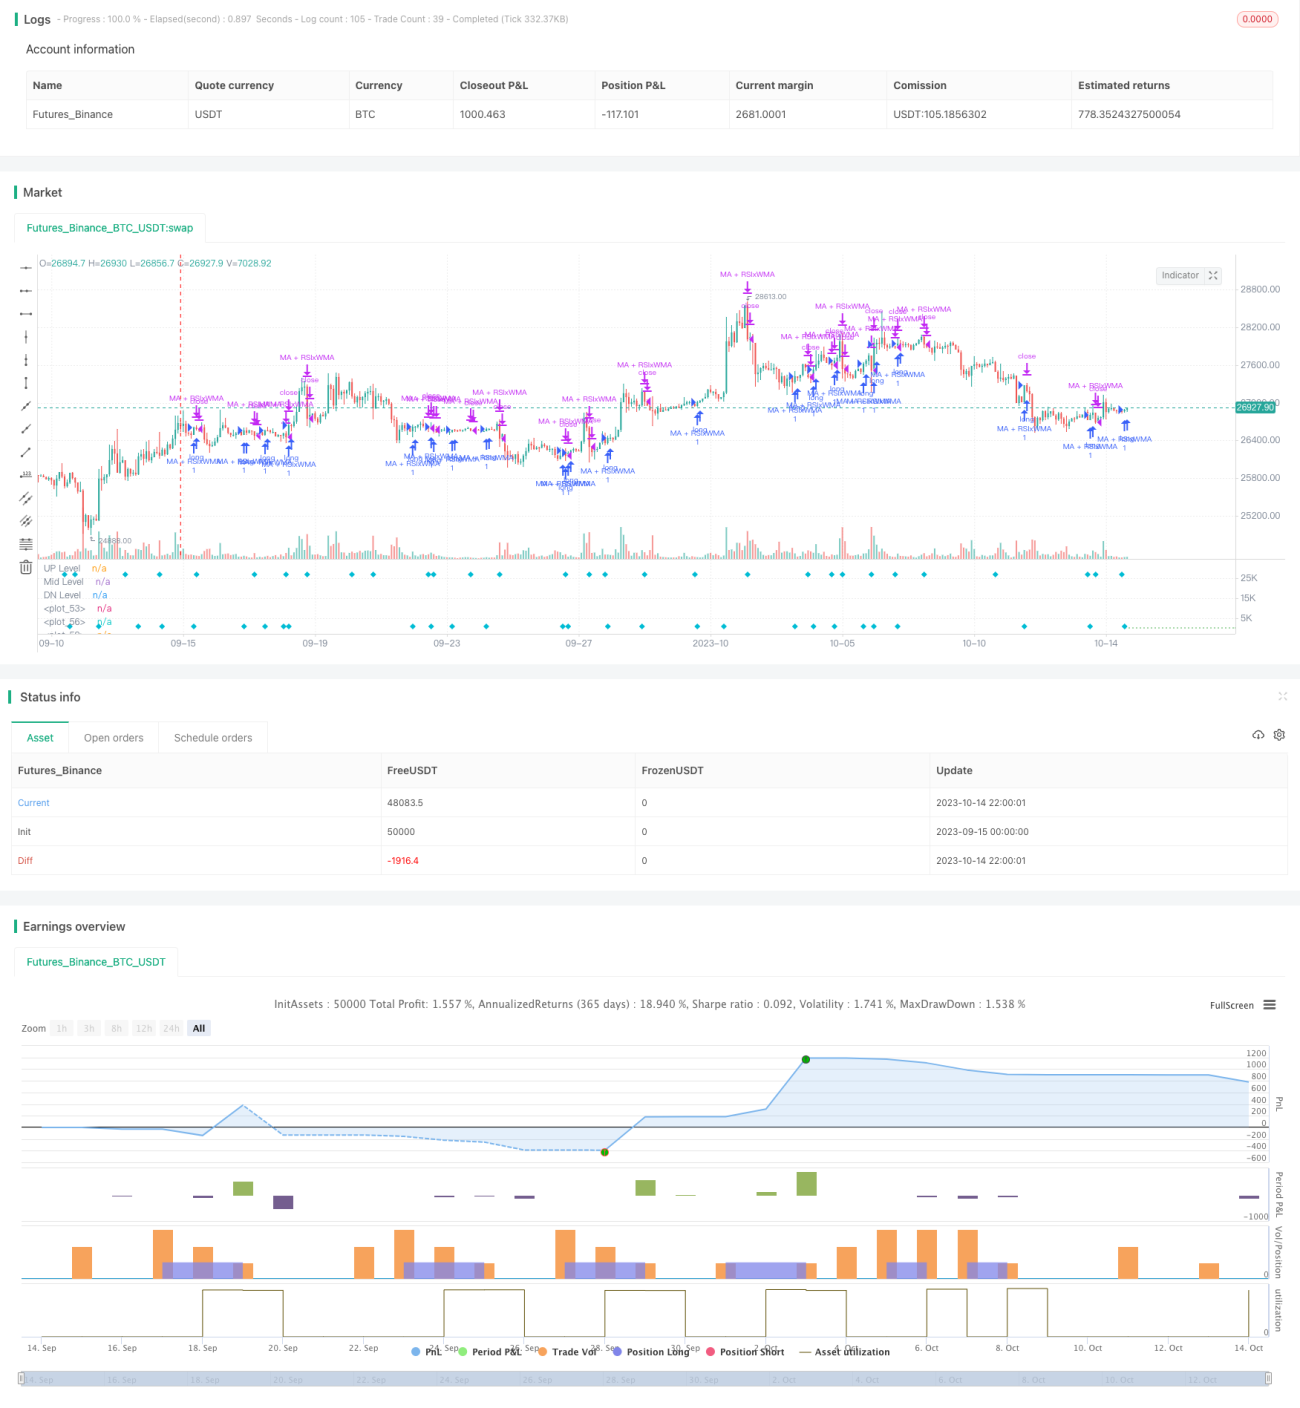
RSI e Média Móvel Crossover Multi Timeframe Trading Strategy

Autora:ChaoZhang, Data: 2023-10-16 16:31:28
Tags:

img

Resumo

A ideia central desta estratégia é identificar pontos de reversão de tendência utilizando tanto o Índice de Força Relativa (RSI) quanto as médias móveis de diferentes prazos, a fim de capturar tendências de médio a longo prazo ao realizar negociações de curto prazo.

Estratégia lógica

  1. Calcule o indicador RSI, as médias móveis EMA rápidas e WMA lentas.
  2. Quando a linha RSI cruza a linha WMA, são gerados sinais de compra/venda.
  3. Quando a EMA mais rápida cruza a WMA mais lenta, são gerados sinais de compra/venda.
  4. Quando tanto o RSI como a EMA atravessam a WMA simultaneamente, são gerados fortes sinais de compra/venda.
  5. Além disso, quando o preço atravessa linhas de média móvel auxiliares, fortalece o sinal principal.
  6. Definir parâmetros de stop loss e take profit.

Esta estratégia combina sinais de ruptura de múltiplos indicadores técnicos e médias móveis de diferentes prazos para identificar tendências de diferentes períodos, melhorando assim a confiabilidade.

Análise das vantagens

  • Utilize a característica de reversão do RSI para capturar oportunidades de reversão em zonas de sobrecompra/supervenda.
  • As médias móveis auxiliares atuam como filtro de tendência para evitar falhas.
  • A combinação de quadros de tempo múltiplos permite acompanhar as tendências a longo prazo, ao mesmo tempo em que capta oportunidades a curto prazo.
  • A combinação de múltiplos sinais de indicadores pode melhorar a taxa de sucesso das negociações.
  • Stop loss e take profit permite gerir ativamente os riscos.

Análise de riscos

  • O RSI pode gerar sinais falsos, precisa de ser filtrado com médias móveis.
  • As rebotes sob as principais tendências podem desencadear sinais comerciais reversos, precisam de cautela.
  • Requer otimização de parâmetros como período RSI, períodos de média móvel, etc.
  • A colocação de stop loss requer prudência para evitar ser parada prematuramente.

Os riscos podem ser mitigados através da otimização dos parâmetros, de uma estratégia de stop loss rigorosa e da consideração das principais tendências, etc.

Orientações de otimização

  • Otimizar os parâmetros do RSI para encontrar a duração ideal do período.
  • Teste diferentes combinações de médias móveis.
  • Incorporar um índice de volatilidade como o ATR para stop loss/take profit dinâmico.
  • Adicionar módulos de dimensionamento de posições e gestão de riscos.
  • Utilize o aprendizado de máquina para otimização de parâmetros e avaliação da qualidade do sinal.

Resumo

Esta estratégia integra ideias de negociação de tendência e reversão extrema, adiciona análise de vários prazos e indicadores sintetizados, com o objetivo de melhorar a taxa de sucesso da negociação. A chave é controlar o risco, otimizar parâmetros e considerar os impactos das principais tendências.


/*backtest
start: 2023-09-15 00:00:00
end: 2023-10-15 00:00:00
period: 2h
basePeriod: 15m
exchanges: [{"eid":"Futures_Binance","currency":"BTC_USDT"}]
*/

// This source code is subject to the terms of the Mozilla Public License 2.0 at https://mozilla.org/MPL/2.0/
// © HamidBox

//@version=4
// strategy("H-M By HamidBox-YT", default_qty_type=strategy.cash, default_qty_value= 100, initial_capital=100, currency='USD', commission_type=strategy.commission.percent, commission_value=0.1)

ma(source, length, type) =>
    type == "SMA" ? sma(source , length)    :
     type == "EMA" ? ema(source , length)   :
     type == "WMA" ? wma(source , length)   :
     type == "VWMA" ? vwma(source , length) :
     na
WMA(source, length, type) =>
    type == "SMA" ? sma(source , length)    :
     type == "EMA" ? ema(source , length)   :
     type == "WMA" ? wma(source , length)   :
     type == "VWMA" ? vwma(source , length) :
     na

WithMA(source, length, type) =>
    type == "SMA" ? sma(source , length)    :
     type == "EMA" ? ema(source , length)   :
     type == "WMA" ? wma(source , length)   :
     type == "VWMA" ? vwma(source , length) :
     na


rsi_inline      = input(true , title="RSI Value)", inline="rsi")
rsiLength       = input(title="Length:", type=input.integer, defval=9, minval=1, inline="rsi")
rsiLineM        = input(title="Level:", type=input.integer, defval=50, minval=1, inline="rsi")

rsi_OSOBinline  = input(true , title="RSI)", inline="rsiosob")
rsiLineU        = input(title="O-BOUGHT", type=input.integer, defval=70, minval=1, inline="rsiosob")
rsiLineD        = input(title="O-SOLD", type=input.integer, defval=30, minval=1, inline="rsiosob")

ma_inline       = input(true , title="Price-MA)", inline="ma")
ma_type         = input(title="Type", defval="EMA", options=["EMA","SMA","WMA","VWMA"], inline="ma")
emaLength       = input(title="Length", type=input.integer, defval=3, inline="ma")

wma_inline      = input(true , title="Trending-MA)", inline="wma")
ma_type2        = input(title="", defval="WMA", options=["EMA","SMA","WMA","VWMA"], inline="wma")
wmaLength       = input(title="Length", type=input.integer, defval=21, inline="wma")


////////////////////////////////////////////////////////////////////////////////
startTime       = input(title="Start Time", type = input.time, defval = timestamp("01 Jan 2021 00:00 +0000"), group="Backtest Time Period")
endTime         = input(title="End Time", type = input.time, defval = timestamp("01 Jan 2200 00:00 +0000"), group="Backtest Time Period")
inDateRange     = true

////////////////////////////////////////////////////////////////////////////////

rsi         = rsi(close , rsiLength)
r           = plot(rsi_inline ? rsi : na, color=color.yellow, linewidth=2)

EMA         = ma(rsi, emaLength, ma_type)
e           = plot(ma_inline ? EMA : na, color=color.lime)

myWMA       = ma(rsi, wmaLength, ma_type2)
w           = plot(wma_inline ? myWMA : na, color=color.white, linewidth=2)


up  = hline(rsiLineU, title='UP Level', linewidth=1, color=color.red, linestyle=hline.style_dotted)
mid = hline(rsiLineM, title='Mid Level', linewidth=2, color=color.white, linestyle=hline.style_dotted)
dn  = hline(rsiLineD, title='DN Level', linewidth=1, color=color.green, linestyle=hline.style_dotted)

col_e_w = EMA > myWMA  ? color.new(color.green , 85) : color.new(color.red , 85)
col_r_w = rsi > myWMA  ? color.new(color.green , 85) : color.new(color.red , 85)

fill(e , w, color=col_e_w)
fill(r , w, color=col_r_w)

////////////////////////////////////////////////////////////////////////////////

//Signals     = input(true,group="👇 🚦 --- Backtesting Signals Type --- 🚦 ")

///////////////////////////////////////////////////////////////////////////////
RSI_Cross   = input(false, "RSI x Trending-MA", inline="wma_cross",group="👇 🚦 --- Backtesting Signals Type --- 🚦 ")      // INPUT

rsiBuySignal    = crossover(rsi , myWMA)
plotshape(RSI_Cross ? rsiBuySignal : na, title="RSI Crossover", style=shape.labelup, location=location.bottom, color=color.green)

rsiSellSignal   = crossunder(rsi , myWMA) 
plotshape(RSI_Cross ? rsiSellSignal : na, title="RSI Crossunder", style=shape.labeldown, location=location.top, color=color.red)

if rsiBuySignal and RSI_Cross and inDateRange
    strategy.entry("RSIxWMA", strategy.long)
if rsiSellSignal and RSI_Cross and inDateRange
    strategy.close("RSIxWMA", comment="x")
if (not inDateRange)
    strategy.close_all()
    
////////////////////////////////////////////////////////////////////////////////

MA_Cross    = input(false, "MA x Trendin-MA",group="👇 🚦 --- Backtesting Signals Type --- 🚦 ")       // INPUT

maBuySignal     = crossover(EMA, myWMA)
plotshape(MA_Cross ? maBuySignal : na, title="MA Cross", style=shape.circle, location=location.bottom, color=color.lime)

maSellSignal   = crossunder(EMA , myWMA) 
plotshape(MA_Cross ? maSellSignal : na, title="RSI Crossunder", style=shape.circle, location=location.top, color=color.maroon)

if maBuySignal and MA_Cross and inDateRange
    strategy.entry("MAxWMA", strategy.long)
if maSellSignal and MA_Cross and inDateRange
    strategy.close("MAxWMA", comment="x")
if (not inDateRange)
    strategy.close_all()
    
////////////////////////////////////////////////////////////////////////////////

Mix         = input(false, "RSI + EMA x Trending-MA",group="👇 🚦 --- Backtesting Signals Type --- 🚦 ")       // INPUT

rsi_ma_buy  = crossover(rsi , myWMA) and crossover(EMA, myWMA)
rsi_ma_sell = crossunder(rsi , myWMA) and crossunder(EMA, myWMA)

plotshape(Mix ? rsi_ma_buy : na, title="RSI Crossunder", style=shape.circle, location=location.bottom, color=color.lime, size=size.tiny)
plotshape(Mix ? rsi_ma_sell : na, title="RSI Crossunder", style=shape.circle, location=location.top, color=color.yellow, size=size.tiny)

if rsi_ma_buy and Mix and inDateRange
    strategy.entry("RSI+EMA x WMA", strategy.long)
if rsi_ma_sell and Mix and inDateRange
    strategy.close("RSI+EMA x WMA", comment="x")
if (not inDateRange)
    strategy.close_all()

////////////////////////////////////////////////////////////////////////////////
wma_cross       = input(false, "Trending-MA x 50",group="👇 🚦 --- Backtesting Signals Type --- 🚦 ")       // INPUT

wma_buy         = crossover(myWMA , rsiLineM)
plotshape(wma_cross ? wma_buy : na, title="WMA Cross", style=shape.diamond, location=location.bottom, color=color.aqua)
wma_sell        = crossunder(myWMA , rsiLineM)
plotshape(wma_cross ? wma_sell : na, title="WMA Cross", style=shape.diamond, location=location.top, color=color.aqua)

if wma_buy and wma_cross and inDateRange
    strategy.entry("WMA x 50", strategy.long)
if wma_sell and wma_cross and inDateRange
    strategy.close("WMA x 50", comment="x")
if (not inDateRange)
    strategy.close_all()

////////////////////////////////////////////////////////////////////////////////
rsi_50      = input(false, "RSI x 50",group="👇 🚦 --- Backtesting Signals Type --- 🚦 ")       // INPUT

rsi_50_buy      = crossover(rsi , rsiLineM)
plotshape(rsi_50 ? rsi_50_buy : na, title="WMA Cross", style=shape.cross, location=location.bottom, color=color.purple)
rsi_50_sell     = crossunder(rsi , rsiLineM)
plotshape(rsi_50 ? rsi_50_sell : na, title="WMA Cross", style=shape.cross, location=location.top, color=color.purple)

if rsi_50_buy and rsi_50 and inDateRange
    strategy.entry("RSI Cross 50", strategy.long)
if rsi_50_sell and rsi_50 and inDateRange
    strategy.close("RSI Cross 50", comment="x")
if (not inDateRange)
    strategy.close_all()
    
////////////////////////////////////////////////////////////////////////////////
RSI_OS_OB   = input(false, "RSI OS/OB x Trending-MA",group="👇 🚦 --- Backtesting Signals Type --- 🚦 ")       // INPUT

rsi_OB_buy      = (rsi < rsiLineD or rsi[1] < rsiLineD[1] or rsi[2] < rsiLineD[2] or rsi[3] < rsiLineD[3] or rsi[4] < rsiLineD[4] or rsi[5] < rsiLineD[5]) and rsiBuySignal 
plotshape(RSI_OS_OB ? rsi_OB_buy : na, title="RSI OB + Cross", style=shape.circle, location=location.bottom, color=color.lime, size=size.tiny)
rsi_OS_sell     = (rsi > rsiLineU or rsi[1] > rsiLineU[1] or rsi[2] > rsiLineU[2] or rsi[3] > rsiLineU[3] or rsi[4] > rsiLineU[4] or rsi[5] > rsiLineU[5]) and maSellSignal 
plotshape(RSI_OS_OB ? rsi_OS_sell : na, title="RSI OS + Cross", style=shape.circle, location=location.top, color=color.red, size=size.tiny)

if rsi_OB_buy and RSI_OS_OB and inDateRange
    strategy.entry("RSI-OBOS x WMA", strategy.long)
if rsi_OS_sell and RSI_OS_OB and inDateRange
    strategy.close("RSI-OBOS x WMA", comment="x")
if (not inDateRange)
    strategy.close_all()

////////////////////////////////////////////////////////////////////////////////

rsi_OB_OS       = input(false, "RSI Over Sold/Bought",group="👇 🚦 --- Backtesting Signals Type --- 🚦 ")       // INPUT

rsiBuy          = crossover(rsi , rsiLineD)
rsiSell         = crossunder(rsi, rsiLineU)
rsiExit         = crossunder(rsi, rsiLineD)

plotshape(rsi_OB_OS ? rsiBuy : na, title="RSI OB", style=shape.cross, location=location.bottom, color=color.purple)
plotshape(rsi_OB_OS ? crossunder(rsi, rsiLineU) : na, title="RSI OS", style=shape.cross, location=location.top, color=color.purple)
plotshape(rsi_OB_OS ? rsiExit : na, title="RSI OS", style=shape.cross, location=location.bottom, color=color.red)

if rsiBuy and rsi_OB_OS and inDateRange
    strategy.entry("RSI OB", strategy.long)
if (rsiSell or rsiExit) and rsi_OB_OS and inDateRange
    strategy.close("RSI OB", comment="x")
if (not inDateRange)
    strategy.close_all()
    
////////////////////////////////////////////////////////////////////////////////
////////////////////////////////////////////////////////////////////////////////

With_MA_Vis     = input(true , title="With MA Signal)", inline="WITH MA", group="With MA")
withMA_type     = input(title="", defval="SMA", options=["EMA","SMA","WMA","VWMA"], inline="WITH MA", group="With MA")
with_MALen      = input(title="", defval=9, type=input.integer, inline="WITH MA", group="With MA")

// TAKE-PROFIT / STOP-LOSS 
Stop_Take_Vis   = input(true, "TP-SL")
LongSLValue     = input(title="SL %", type=input.float, defval=3, minval=0.5) * 0.01
LongTPValue     = input(title="TP %", type=input.float, defval=15, minval=0.5) * 0.01

LongSLDetermine = strategy.position_avg_price * (1 - LongSLValue)
LongTPDetermine = strategy.position_avg_price * (1 + LongTPValue)
//////////////////////////

with_ma     = WithMA(close, with_MALen, withMA_type)

Close_buy_MA    = crossover(close , with_ma)
Close_sell_MA   = crossunder(close , with_ma)

// PLOT OPTION
WithMaSignal    = input(true, "MA + RSI x Trending-MA",group="With MA")       // INPUT

// CONDITION IN VARIABLE
withMA_RSI_BUY  = (Close_buy_MA and rsiBuySignal) and WithMaSignal and inDateRange
withMA_RSI_SELL = (Close_sell_MA and rsiSellSignal) and WithMaSignal and inDateRange

// PLOT ING
plotshape(WithMaSignal ? withMA_RSI_BUY : na, title="With MA", style=shape.diamond, location=location.bottom, color=color.aqua)
plotshape(WithMaSignal ? withMA_RSI_SELL : na, title="With MA", style=shape.diamond, location=location.top, color=color.aqua)


if withMA_RSI_BUY
    strategy.entry("MA + RSIxWMA", strategy.long)
if withMA_RSI_SELL
    strategy.close("MA + RSIxWMA", comment="x")
if (not inDateRange)
    strategy.close_all()

// FOR SL - TP
if (strategy.position_size > 0) and Stop_Take_Vis
    strategy.exit("BUY", stop=LongSLDetermine, limit=LongTPDetermine)


Mais.