Estratégia de acompanhamento de tendência de bandas de Bollinger de média móvel dupla
Visão geral
Esta estratégia baseia-se em uma dupla linha média de correlação com a linha de correlação. A estratégia usa a convergência e a dispersação da linha de correlação para avaliar a mudança de tendência. Comprar perto da linha de correlação com a linha de correlação, vender perto da linha de correlação com a linha de correlação, comprar baixo e vender alto.
Princípio da estratégia
A estratégia usa duas versões de Brinks: Brinks simples e Brinks avançados.
O Brinel simples utiliza o preço de fechamento para calcular o SMA, e o Brinel reforçado usa o preço de fechamento para calcular o EMA.
Os trajectos ascendentes e descendentes são calculados através do desvio padrão de ± N vezes do trajeto médio.
A estratégia julga a tendência com base na distância entre a borda de Brin e a borda de baixa. Quando a diferença é menor do que o limite definido, é indicado que está entrando no intervalo de tendência e pode ser negociado seguindo a tendência.
Especificamente, quando o preço está perto da trajetória de baixa, compra mais e, quando está perto da trajetória de alta, vende. O modo de parada é o percentual de parada fixo, além da opção de ativar o rastreamento de parada.
O lucro alvo depende da escolha de posicionar-se na posição de liquidação no meio ou na posição de liquidação no topo.
A estratégia também pode optar por vender somente se garantir o lucro, evitando perdas.
Análise de vantagens
A estratégia tem as seguintes vantagens:
- A integração das duplas faixas de Berlim aumenta a eficiência da tomada de decisões
Aplicação de Brinks simples e Brinks reforçados, para comparar os efeitos dos dois tipos de Brinks, escolher a versão mais apropriada e melhorar a eficiência da decisão.
- Tendência de acordo com a largura do canal da cintura de Brin
Quando o canal de correia é estreito, o que significa que você está entrando em uma tendência, você tem uma maior probabilidade de vencer.
- “O que é que eu faço?”
A utilização de um percentual fixo de stop-loss para controlar a perda de um único ponto. Além disso, é possível optar por parar no meio do caminho ou perto do caminho superior, bem como ativar o stop-loss de rastreamento para bloquear mais lucros.
- Mecanismos de proteção contra perdas
A venda só pode evitar a expansão dos prejuízos se for assegurada a lucratividade.
Análise de Riscos
A estratégia também apresenta os seguintes riscos:
- Risco de retirada
Seguir uma tendência de negociação implica em si mesmo um certo risco de retração, e a necessidade de suportar a pressão psicológica de perdas contínuas.
- Risco de uma crise
Quando a corredor de correia é larga, o mercado pode entrar em uma onda de choque, quando a estratégia não funciona bem e é necessário suspender a negociação para esperar que a tendência volte a se formar.
- Risco de que o stop loss seja acionado
A paralisação por percentual fixo pode ser muito radical e precisa ser adaptada para uma paralisação mais moderada, como a paralisação ATR.
Direção de otimização
A estratégia pode ser otimizada em:
- Parâmetros da faixa de Bryn optimizados
Pode-se testar diferentes parâmetros de média e de diferença padrão para encontrar combinações de parâmetros de faixa de Bryn mais adequadas para diferentes mercados.
- Filtragem em combinação com outros indicadores
Os indicadores MACD, KD e outros podem ser filtrados com base nos sinais de Brin, reduzindo a volatilidade do mercado.
- Otimização de estratégias de stop loss
Pode-se testar diferentes formas de travagem de perda, ou otimizar o ponto de perda com base em indicadores como amplitude, ATR.
- Optimizar a gestão de fundos
Otimizar a gestão de posições em cada transação e testar diferentes estratégias de reposição.
Resumir
Esta estratégia integra os benefícios dos indicadores de dupla faixa de borla, de acordo com a largura do canal de borla para determinar o grau de tendência, para fazer transações de seguimento de baixa absorção e alta queda durante a tendência. Ao mesmo tempo, o mecanismo de parada de perdas científico é configurado para controlar o risco. A estratégia pode aumentar ainda mais a estabilidade através da otimização de parâmetros e da combinação de filtragem de outros indicadores.
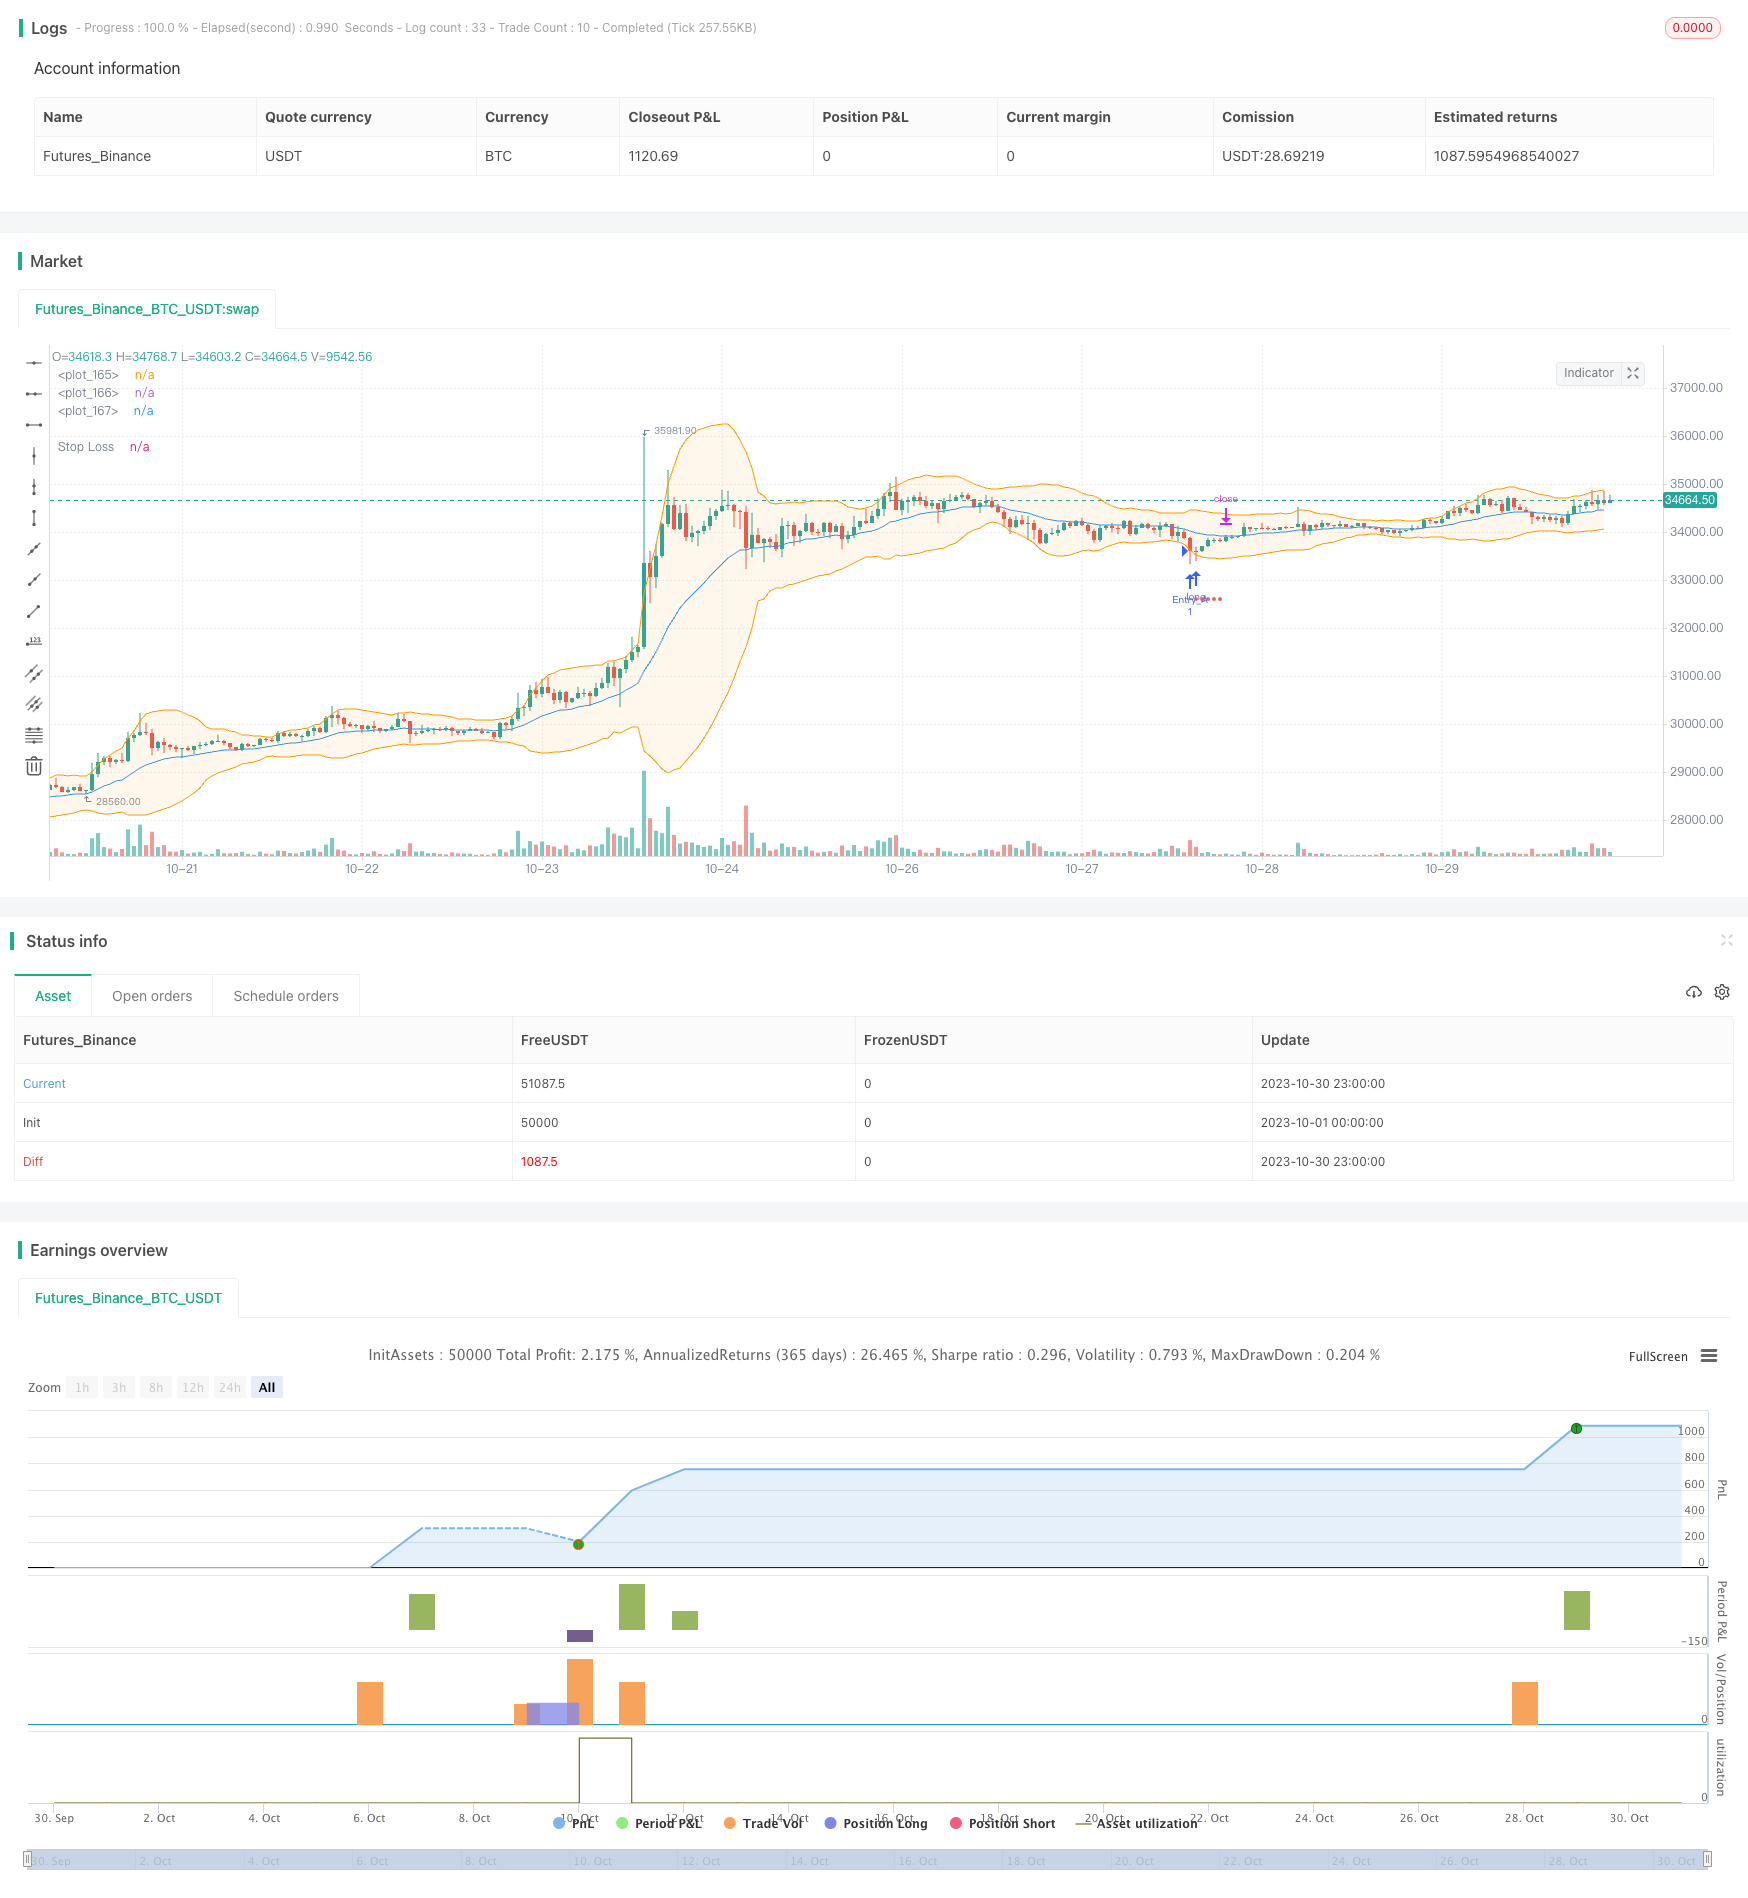
/*backtest
start: 2023-10-01 00:00:00
end: 2023-10-31 00:00:00
period: 1h
basePeriod: 15m
exchanges: [{"eid":"Futures_Binance","currency":"BTC_USDT"}]
*/

// This source code is subject to the terms of the Mozilla Public License 2.0 at https://mozilla.org/MPL/2.0/
// © JCGMarkets

//@version=4
strategy("B.Bands | Augmented | Intra-range | Long-Only", shorttitle = "BB|A|IR|L", initial_capital=5000, commission_value=0.075, slippage = 1, overlay = true)

//Technical Indicators Data
show_simp   = input(false, title="Trade on Simple Bollinger Bands ", type= input.bool, group="Select Strategy System")
show_augm   = input(true, title="Trade on Augmented Bollinger Bands", type= input.bool, group="Select Strategy System")
periods     = input(20, title="Periods for Moving Average", type =input.integer, minval = 2, step = 1, group="Technical Inputs")
std         = input(2, title="Std", type = input.float, minval=0.1 , step = 0.1, group="Technical Inputs")

// Strategy data
max_spread_bb   = input(20000.0, title="Max Spread Tolerance Beetween Bands", type=input.float, step=0.1, group="Strategy Inputs")
entry_source    = input(close, title="Entry data source", type=input.source, group="Strategy Inputs")
exit_source     = input(high, title="Exit data source", type=input.source, group="Strategy Inputs")
take_profit     = input("middle", title = "Profit to band:", options = ["middle", "opposite"], group="Strategy Inputs")
stop_loss       = input(3.00, title="Stop Loss %", type=input.float, step=0.05, group="Strategy Inputs")
trailing        = input(false, title="Activate trailing stop?", type = input.bool, group="Strategy Inputs")
stop_perc       = input(6.00, title="Trailing %", type=input.float, step=0.125, group="Strategy Inputs") * 0.01
sell_profit     = input(false, title="Only sell in profit (Stop Loss still active) ", type= input.bool, group="Strategy Inputs")


var SL = 0.0
var SLT= 0.0


//Simple BB Calculation -> adapt if needed with different std for upper-lower, sma-ema, etc
middle_sim = sma(close, periods)

//Augmented BB Calculation -> adapt if needed with different std for upper lower, etc
middle_augm  = ema(close, periods)
middle_upp = ema(high, periods)
middle_low = ema(low, periods)

//Multiplier
dev      = stdev(close, periods) * std

//Upper & Lower Bands
upper = (middle_sim + dev)
lower = (middle_sim - dev)

//Augmented Bands
upper_augm = (middle_upp + dev)
lower_augm = (middle_low - dev)

//Bands Spread
spread   = upper - lower
spread_augm   = upper_augm - lower_augm

//From date
filter_from    =   input(  true,    title="===> From", group="Date Control")
from_y         =   input(  2010,    title = "from year", group="Date Control")
from_m         =   input(     1,    title = "from month", minval =1, maxval=12, group="Date Control")
from_d         =   input(     1,    title = "from day",  minval=1, maxval=31, group="Date Control")

//To date
filter_to   =    input( true,   title="===> To", group="Date Control")
to_y        =    input( 2030,   title = "To year", group="Date Control")
to_m        =    input(    1,   title = "To month", minval =1, maxval=12, group="Date Control")
to_d        =    input(    1,  title = "To day",  minval=1, maxval=31, group="Date Control")

// Date Condition
In_date() =>  true

in_position = strategy.position_size > 0

// Trailing stop
SLT := if in_position and In_date()
    stop_inicial = entry_source * (1 - stop_perc)
    max(stop_inicial, SLT[1])
else
    0

slts = (low <= SLT) and (trailing == true)


//Essential Trade logics
entry_long = (entry_source <= lower) and (spread < max_spread_bb)
entry_long_augm = (entry_source <= lower_augm) and (spread_augm < max_spread_bb)

// Simple Bollinger Conditions

if (not in_position and show_simp and In_date())
    if entry_long
        // Trigger buy order
        position_size = round( strategy.equity / close ) // All available equity for this strategy example
        strategy.entry("Entry", strategy.long, qty = position_size )
        SL := close * (1 - (stop_loss / 100)) // You could determine wether or not implement stop loss with bool input and if condition here.


if in_position and show_simp and not sell_profit and In_date()
    //Exits if not sell in profit
    if take_profit == "middle"
        strategy.exit("Target", "Entry", limit = middle_sim, stop = SL, comment="Exit")
    if take_profit == "opposite"
        strategy.exit("Target", "Entry", limit = upper, stop = SL, comment="Exit")

if in_position and show_simp and sell_profit and In_date()
    //Exits if sell in profit
    if take_profit == "middle"
        strategy.exit("Target", "Entry", limit = (strategy.openprofit > 0 ? middle_sim: na), stop = SL, comment="Exit")
    if take_profit == "opposite"
        strategy.exit("Target", "Entry", limit = (strategy.openprofit > 0 ? upper: na), stop = SL, comment="Exit")


if in_position and show_simp and slts and In_date()
    //Trailing activation
    strategy.close("Entry", comment="SLT")

if not In_date()
    //Exit due out of date range
    strategy.close("Entry", comment="Out of date range")


// Augmented Bollinger Conditions

if (not in_position and show_augm and In_date())
    if entry_long_augm
        // Trigger buy order
        position_size = round( strategy.equity / close )
        strategy.entry("Entry_A", strategy.long, qty = position_size )
        SL := close * (1 - (stop_loss / 100) )

if in_position and show_augm and not sell_profit and In_date()
    //Exits and not sell in profit
    if take_profit == "middle"
        strategy.exit("Target", "Entry_A", limit = middle_augm, stop = SL, comment="Exit")
    if take_profit == "opposite"
        strategy.exit("Target", "Entry_A", limit = upper_augm, stop = SL, comment="Exit")


if in_position and show_augm and sell_profit and In_date()
    //Exit only in profit
    if take_profit == "middle"
        strategy.exit("Target", "Entry_A", limit = (strategy.openprofit > 0 ? middle_augm:na), stop = SL, comment="Exit")
    if take_profit == "opposite"
        strategy.exit("Target", "Entry_A", limit = (strategy.openprofit > 0 ? upper_augm: na) , stop = SL, comment="Exit")


if in_position  and show_augm and slts and In_date()
    //Trigger trailing
    strategy.close("Entry_A", comment="SLT")

if not In_date()
    //Out of date trigger
    strategy.close("Entry_A", comment= "Out of date range")


// Plotting

plot(in_position ? SL > 0 ? SL : na : na , style = plot.style_circles, color = color.red, title = "Stop Loss")
plot(in_position ? trailing ? SLT > 0 ? SLT : na : na : na , style = plot.style_circles, color = color.blue, title = "Trailing Stop" )

s = plot(show_simp ? upper : na , color = color.aqua)
plot(show_simp ? middle_sim : na , color=color.red)
i = plot(show_simp ? lower : na , color = color.aqua)
fill(s,i, color=color.new(color.aqua,90))


plot(show_augm ? middle_augm : na , color=color.blue)
s_a = plot( show_augm ? upper_augm : na, color=color.orange)
i_a = plot( show_augm ? lower_augm : na, color= color.orange)
fill(s_a,i_a, color=color.new(color.orange, 90))