Estratégia de negociação bidirecional baseada em RSI e SuperTrend
Visão geral
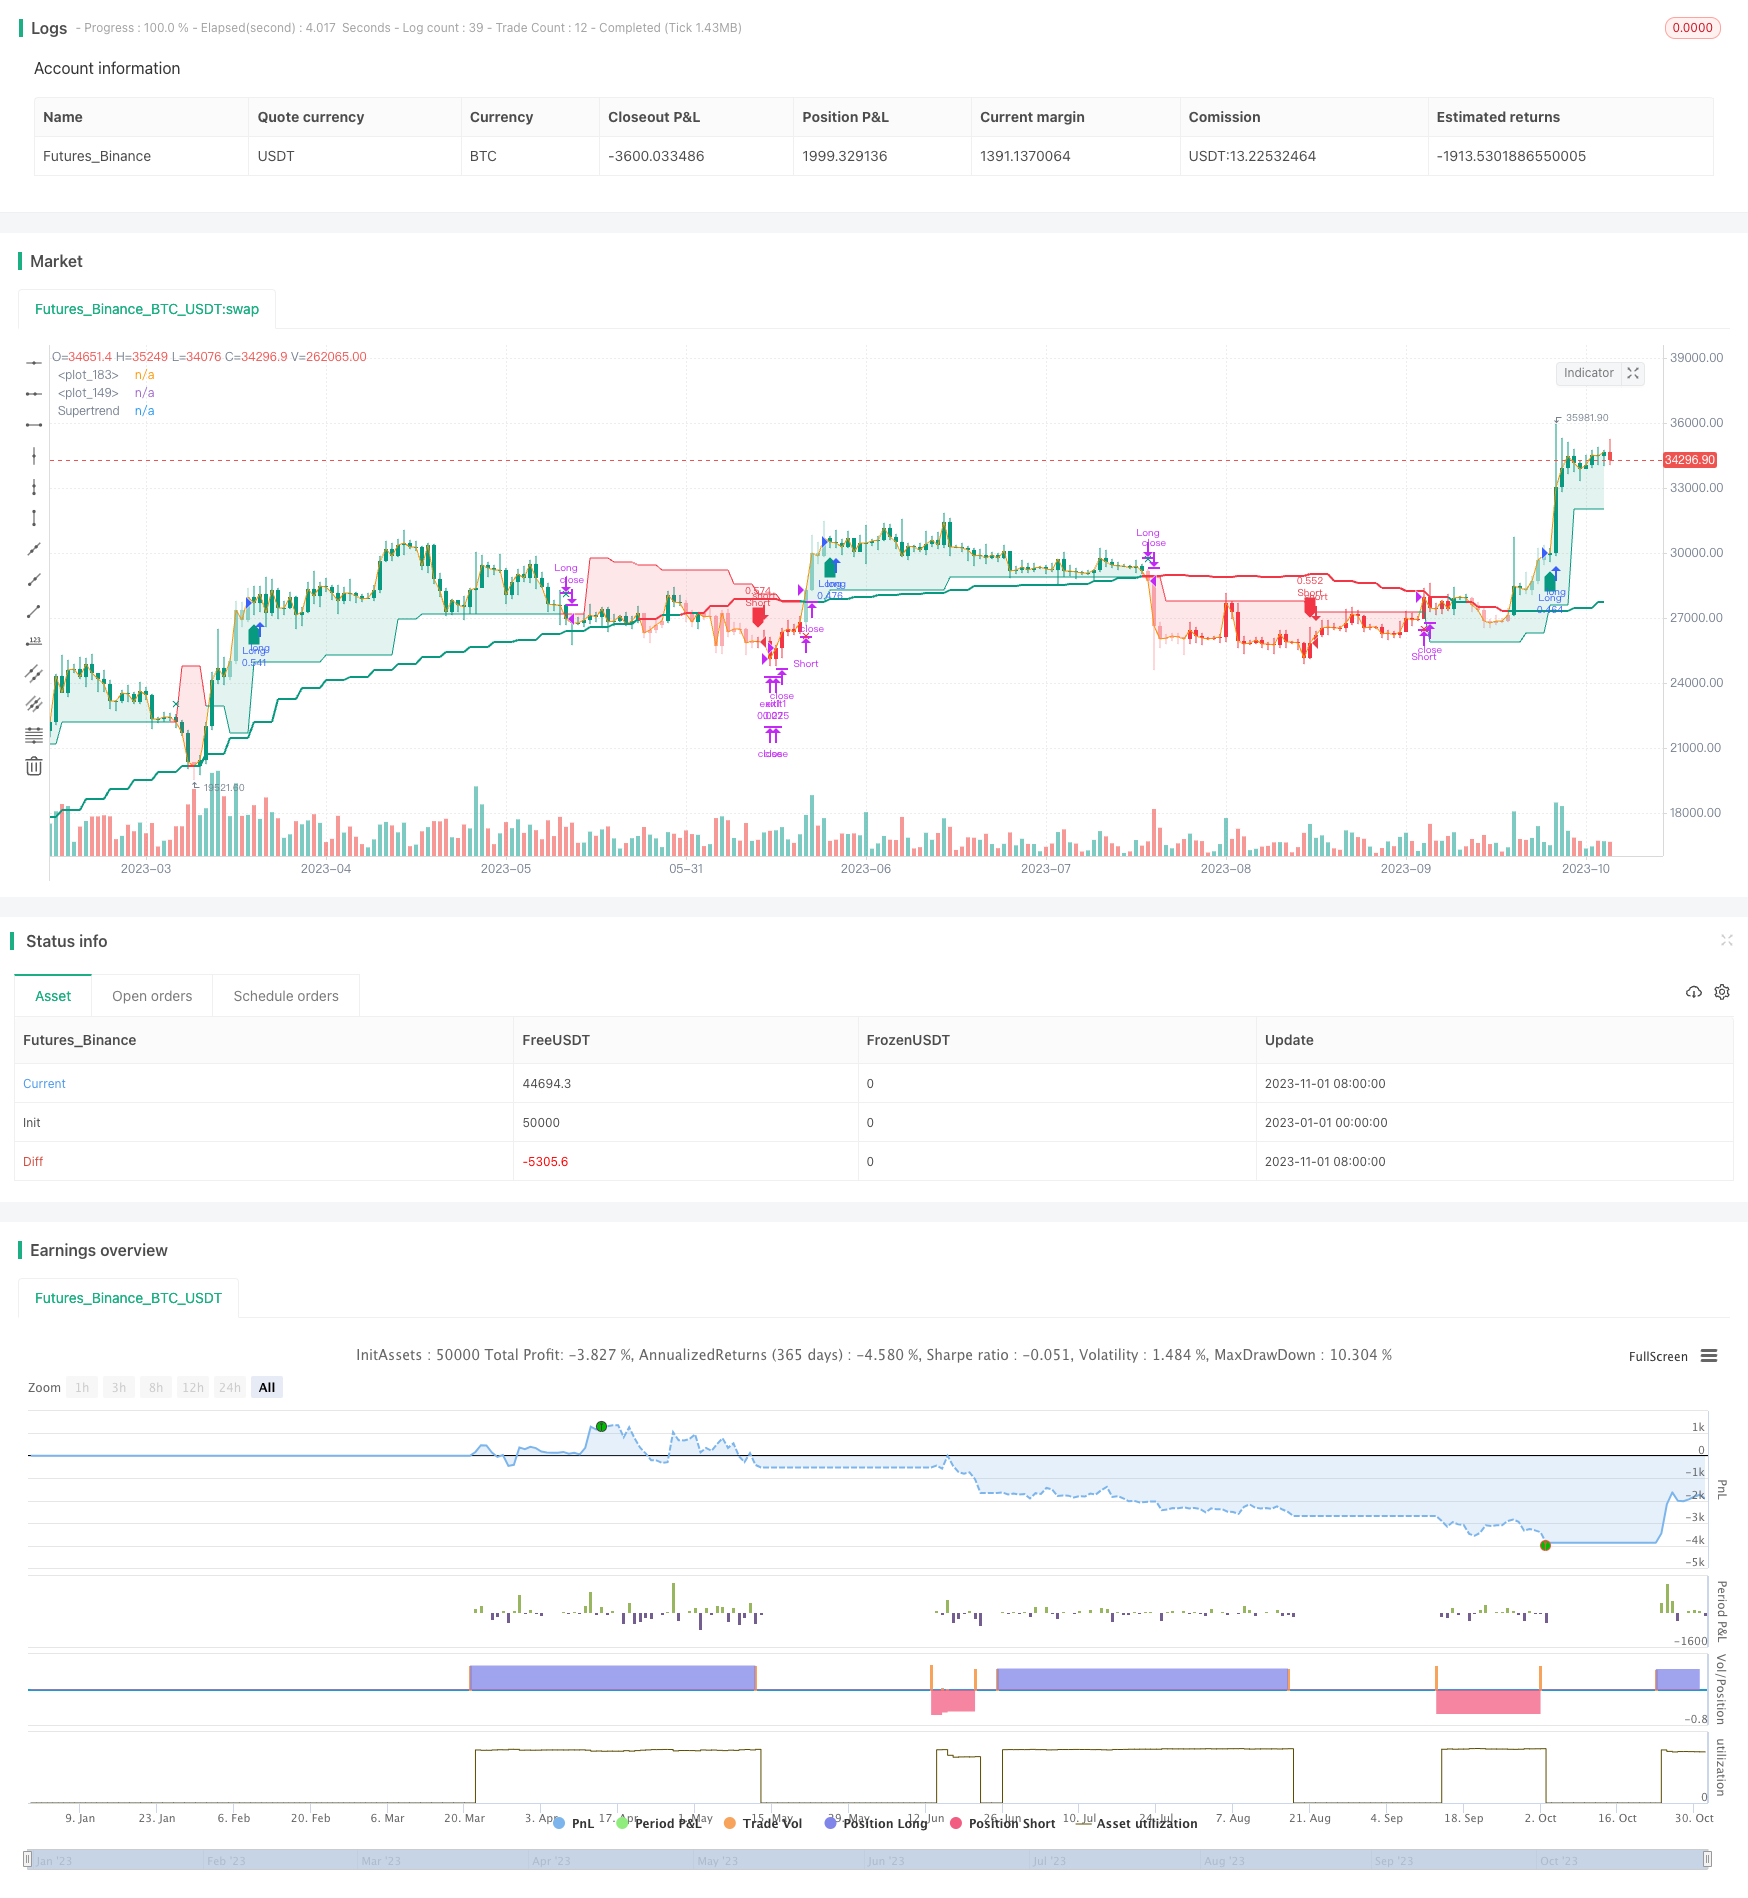
Trata-se de uma estratégia de negociação bidirecional que combina o indicador RSI e o indicador SuperTrend. A estratégia visa identificar os pontos fortes e fracos do mercado e trocar de posição em tempo hábil quando a direção da tendência muda para obter maiores ganhos.
Princípio da estratégia
A estratégia baseia-se principalmente nos seguintes princípios:
O indicador RSI é usado para avaliar a força e a fraqueza do mercado atual. O RSI acima de 50 é um mercado forte e abaixo de 50 é um mercado fraco.
Usar o indicador SuperTrend como um filtro de tendência. Só é emitido um sinal de negociação quando o preço ultrapassa a SuperTrend.
Quando o indicador RSI emite um sinal de força, se o preço se elevar, faça mais; se o preço cair, leve.
Quando o indicador RSI emite um sinal de fraqueza, se o preço quebrar a trajetória para baixo, você vai para o lado; se o preço quebrar a trajetória para cima, você vai para o lado.
Capturar pontos de mudança de tendência por meio da conversão multivariada do indicador RSI e executar operações de troca de posição em tempo hábil.
Realização concreta
Calcule o valor do indicador RSI, com a duração de 14, com 50 como limite para avaliar a força e a fraqueza.
Calcule o indicador SuperTrend, com um comprimento de 10, multiplicado por 2.
Quando o RSI é superior a 50 e o preço quebra o SuperTrend para cima, faça mais. Quando o RSI é inferior a 50 e o preço cai para baixo do SuperTrend para baixo, faça um curto.
Quando o excesso foi feito, se o RSI se tornou fraco e o preço quebrou o SuperTrend, a posição foi fechada. Quando o mercado estava aberto, se o RSI se tornou forte e o preço quebrou o SuperTrend, a posição foi fechada.
Pode ser configurado para fazer apenas mais ou apenas em branco.
Vantagens estratégicas
Esta estratégia, combinada com o acompanhamento de tendências e o julgamento de sobrecompra e sobrevenda, tem as seguintes vantagens:
O que você pode fazer é capturar as mudanças de tendência em tempo hábil e reduzir a necessidade de se arriscar.
O RSI é um indicador eficaz para determinar as áreas de sobrevenda e sobrecompra, evitando a busca de alta e baixa antes da reviravolta do mercado.
O SuperTrend é um bom filtro de ruído no mercado, seguindo a linha média e longa.
A combinação dos dois indicadores RSI e SuperTrend pode aumentar a estabilidade da estratégia.
Os parâmetros da estratégia têm muito espaço para otimização e podem ser ajustados de acordo com diferentes variedades e ciclos.
Suporte para o modo “fazer apenas mais” ou “fazer apenas nada”, com flexibilidade para diferentes tipos de situações.
Risco estratégico
A estratégia também traz alguns riscos:
Os indicadores RSI são propensos a produzir falsos sinais e precisam ser combinados com a verificação de preços.
A configuração inadequada dos parâmetros do indicador SuperTrend pode levar a falhas ou a uma queda.
A combinação de dois indicadores apresenta um risco de dispersação e precisa de ajustes de parâmetros para uma melhor correspondência.
Quando a situação muda drasticamente, o stop-loss pode ser adiado e a posição de stop-loss deve ser razoavelmente definida.
Evitar a reversão de posições próximas a áreas de resistência de suporte importante.
Otimização de Estratégia
A estratégia também pode ser melhorada em:
Ajustar os parâmetros do RSI para encontrar o melhor comprimento para filtrar os falsos sinais.
Otimizar os parâmetros do SuperTrend para melhorar o acompanhamento das tendências.
Testar combinações de parâmetros de diferentes variedades em diferentes períodos, procurando o parâmetro ideal.
A adição de filtros de outros indicadores, como MACD, KDJ, etc., aumenta a precisão do sinal.
Aumentar os sinais de estratégia qualitativa e de julgamento, como resistência de suporte importante, linha de Brin e média de movimento.
Otimizar a estratégia de parada de perdas, reduzindo a probabilidade de que a parada de perdas seja executada em segundos, desde que a eficácia da parada seja garantida.
Resumir
A estratégia integra os benefícios dos dois indicadores RSI e SuperTrend, permitindo identificar efetivamente as mudanças na tendência de médio prazo do mercado e fazer a operação de troca entre os mercados de baixa e alta. Através da otimização de parâmetros, pode ser adaptado a uma situação de mercado mais ampla.
/*backtest
start: 2023-01-01 00:00:00
end: 2023-11-02 00:00:00
period: 1d
basePeriod: 1h
exchanges: [{"eid":"Futures_Binance","currency":"BTC_USDT"}]
*/

// This source code is subject to the terms of the Mozilla Public License 2.0 at https://mozilla.org/MPL/2.0/
//@version=5
//Created by @CITIAlgo
// —————————————————————————————————————————————————————————————————————————————————————————————————————————

strategy('CITI Trends A with RSI Candles', shorttitle = "CITI Trends A" , overlay = true ,
         initial_capital   = 10000,
         commission_value  = 0.025,
         default_qty_value = 25,
         slippage          = 1,
         pyramiding        = 0,
         max_lines_count   = 500,
         max_labels_count  = 500,
         currency          = currency.USD,
         default_qty_type  = strategy.percent_of_equity)

bullColor1 =  #089981
bearColor1 =  #f23645
bullColor2 =  #3873e3
bearColor2 =  #630ef5
neutralColor1 = #d5d5d5

//Base Settings
groupBase = "Base Settings ---------------------------------------"
Repaint_type = input.string('Non-Repainting', "Allow Repainting ?", options = ['Non-Repainting', 'Repainting'], inline ='repaint' , group = groupBase , tooltip = 'The default value is Non-Repainting. To learn more visit https://www.tradingview.com/pine-script-docs/en/v5/concepts/Repainting.html')

//Configure trade direction
tradeDirection = input.string("Both", title="Trade Direction", options=["Long", "Short", "Both"] , group=groupBase , inline = 'Type' )

longOK  = tradeDirection == "Long" or tradeDirection == "Both"
shortOK = tradeDirection == "Short" or tradeDirection == "Both"

var bool PlotEntries = input.bool (true, "Show Entries" ,group=groupBase , inline = 'Signals' )
var bool PlotExits = input.bool (true, "Show Exits" , group=groupBase, inline = 'Signals' )

//Display Settings
groupDisplay = "Display Settings ------------------------------------"

MomBars = input.bool( true , title="Apply Bar Colors", inline = 'candles' , group=groupDisplay)

cbullColor = input.color( bullColor1  , 'Candle Colors' ,  inline = 'candles1a',group=groupDisplay)
cbearColor =  input.color( bearColor1  , '' ,  inline = 'candles1a',group=groupDisplay)

//Candle & label Colors
Bullish_Bars    = color.new( cbullColor , 0)
WBullish_Bars   = color.new( cbullColor , 60)
Bearish_Bars    = color.new( cbearColor , 0)
WBearish_Bars   = color.new( cbearColor , 60)

lbullColor = input.color( bullColor1  , 'Long/Short Labels' ,  group=groupDisplay, inline = 'Signals1' )
lbearColor =  input.color( bearColor1 , ''  , group=groupDisplay, inline = 'Signals1' )

st_status = input.bool( true , title="Show Supertrend", inline = 'st' , group=groupDisplay)
st_bullColor = input.color( bullColor1  , '' ,  group=groupDisplay, inline = 'st' )
st_bearColor =  input.color( bearColor1 , ''  , group=groupDisplay, inline = 'st' )

//Build Your Signals Settings
groupEntry = " Trend & Signal Settings---------------------"
Entry1a = input.bool(true, title= "Entry", inline='entry1a', group=groupEntry)
Exit1a  = input.bool(false, title= "Exit | Strong/Weak Momentum", inline='entry1a', group=groupEntry)
Entry1b = input.bool(false,  title=  'Entry'  , inline='entry1b', group=groupEntry)
Exit1b  = input.bool(false, title= 'Exit | Bull/Bear Momentum'  , inline='entry1b', group=groupEntry)

Entry3a = input.bool(false, title= "Filter", inline='entry3a', group=groupEntry)
Exit3a  = input.bool(false, title= "Exit | MA ", inline='entry3a', group=groupEntry)

Entry4a = input.bool(false, title= "Filter | Disable RSI Ranges ", inline='entry4a', group=groupEntry)
Entry4b = input.bool(true, title= "Filter", inline='entry4b', group=groupEntry)
Exit4b  = input.bool(true, title= "Exit | Supertrend ", inline='entry4b', group=groupEntry)
Entry4c = input.bool(true, title= "Filter | Disable Supertrend Ranges ", inline='entry4c', group=groupEntry)
// —————————————————————————————————————MTF FUNCTIONS
// —————————— PineCoders MTF Selection Framework functions
// ————— Converts current "timeframe.multiplier" plus the TF into minutes of type float.
f_resInMinutes() =>
    _resInMinutes = timeframe.multiplier * (timeframe.isseconds ? 1. / 60. : timeframe.isminutes ? 1. : timeframe.isdaily ? 1440. : timeframe.isweekly ? 10080. : timeframe.ismonthly ? 43800. : na)
    _resInMinutes

// Get current resolution in float minutes.
var ResInMinutes = f_resInMinutes()

// ————— Returns resolution of _resolution period in minutes.
f_tfResInMinutes(_res) =>
    // _res: resolution of any TF (in "timeframe.period" string format).
    request.security(syminfo.tickerid, _res, f_resInMinutes())

// ————— Returns a multiple of current resolution as a string in "timeframe.period" format usable with "security()".
f_multipleOfRes(_res, _mult) =>
    // _res:  current resolution in minutes, in the fractional format supplied by f_resInMinutes() companion function.
    // _mult: Multiple of current TF to be calculated.
    // Convert current float TF in minutes to target string TF in "timeframe.period" format.
    _targetResInMin = _res * math.max(_mult, 1)
    // Find best string to express the resolution.
    _targetResInMin <= 0.083 ? '5S' : _targetResInMin <= 0.251 ? '15S' : _targetResInMin <= 0.501 ? '30S' : _targetResInMin <= 1440 ? str.tostring(math.round(_targetResInMin)) : _targetResInMin <= 43800 ? str.tostring(math.round(math.min(_targetResInMin / 1440, 365))) + 'D' : str.tostring(math.round(math.min(_targetResInMin / 43800, 12))) + 'M'

// ————— Converts current resolution
f_resInString(_res) =>
    // _res: resolution of any TF (in "timeframe.period" string format).
      _res  == "1"   ? "1m"  :
      _res  == "3"   ? "3m"  :
      _res  == "5"   ? "5m"  :
      _res  == "15"  ? "15m" :
      _res  == "30"  ? "30m" :
      _res  == "45"  ? "45m" :
      _res  == "60"  ? "1h"  :
      _res  == "120" ? "2h"  :
      _res  == "180" ? "3h"  :
      _res  == "240" ? "4h"  :
      _res  == "1D"  ? "D"   :
      _res  == "1W"  ? "W"   :
      _res  == "1M"  ? "M"   : _res

//Set repaint security function
repaint_sw = Repaint_type == 'Non-Repainting' ? false : true
f_security(_symbol, _res, _src, _repaint) => request.security(_symbol, _res, _src[_repaint ? 0 : barstate.isrealtime ? 1 : 0] , barmerge.gaps_off, barmerge.lookahead_on)[_repaint ? 0 : barstate.isrealtime ? 0 : 1]
f_source(_res , source) => f_security(syminfo.tickerid , _res , source , repaint_sw )

Type1 = 'Auto Multiplied TF'
Type2 = 'Fixed TF'
//---------------------------------------------------------------------------
//RSI Settings // INPUTS
groupRange   = "RSI Settings  ----------------------------------"

TF1type = input.string( Type1, 'TF' ,  options=[Type1,Type2] , inline ='tf1' , group=groupRange)
setHTF1a = input.int( 4 , '' , inline ='tf1', group=groupRange)
setHTF1b = input.timeframe( 'D' , '' , inline ='tf1', group=groupRange)
// Get HTF from user-defined mode.
var TF1 = TF1type == Type1 ? f_multipleOfRes(ResInMinutes, setHTF1a) : setHTF1b

mLength    =  input.int( 14  ,  "RSI Length"  ,inline='lines', group=groupRange)
BullLevel  = input.int( 50 ,  "Bullish Level | Above 50       ",inline='lines1a', group=groupRange)
BearLevel  = input.int( 50 , "Bearish Level | Below 50        ",inline='lines1b', group=groupRange)

ma_length  = input.int( 21  ,  "MA Length"  ,inline='ma', group=groupRange)
ma_status  = input.bool( true ,  "Show MA" ,inline='ma1', group=groupRange)
ma_bullColor = input.color( bullColor1  , '' ,  inline='ma1', group=groupRange)
ma_bearColor =  input.color( bearColor1 , ''  , inline='ma1', group=groupRange)
//--------------------------------------------------------------------------
//Momentum Calculations
f_momTF( _tf ) =>
    _isShow =  f_tfResInMinutes(_tf) >= f_resInMinutes()
    close_ = f_source(_tf , close)
    rsi_ = _isShow ? f_security(syminfo.tickerid , _tf, ta.rsi( close_, mLength) , repaint_sw) : na
    ma = _isShow ? f_security(syminfo.tickerid , _tf, ta.vwma( hlc3 , ma_length ) , repaint_sw) : na
    [rsi_ , ma]

[ rsi , ma ] = f_momTF(TF1)

ma_color = close > ma ? ma_bullColor : ma_bearColor
plot( ma_status ? ma : na , color = ma_color , linewidth = 2 , style = plot.style_line)
//---------------------------------------------------------------------------
//Supertrend Settings // INPUTS
groupST   = "Supertrend Settings  ----------------------------------"

TF2type = input.string( Type1, 'TF' ,  options=[Type1,Type2] , inline ='tf2' , group=groupST)
setHTF2a = input.int( 4 , '' , inline ='tf2', group=groupST)
setHTF2b = input.timeframe( 'D' , '' , inline ='tf2', group=groupST)
// Get HTF from user-defined mode.
var TF2 = TF2type == Type1 ? f_multipleOfRes(ResInMinutes, setHTF2a) : setHTF2b

stLength =  input.int( 10  ,  "Supertrend Length"  ,inline='lines', group=groupST)
stmult =  input.int( 2  ,  "Mult"  ,inline='lines', group=groupST)
stHighlights        = input.bool( true ,  "Highlights",inline='lines1a', group=groupST)

f_st( _tf) =>
    _isShow =  f_tfResInMinutes(_tf) >= f_resInMinutes()
    close_ = f_source(_tf , close)
    atr= f_security(syminfo.tickerid , _tf, ta.atr(stLength) , repaint_sw)
    Up=close_ -(stmult*atr)
    Dn=close_ +(stmult*atr)
    TrendUp = 0.0
    TrendUp := close_[1]>TrendUp[1] ? math.max(Up,TrendUp[1]) : Up
    TrendDown = 0.0
    TrendDown := close_[1]<TrendDown[1]? math.min(Dn,TrendDown[1]) : Dn
    Trend = 0.0
    Trend := close_ > TrendDown[1] ? 1: close_< TrendUp[1]? -1: nz(Trend[1],1)
    stLine = Trend==1? TrendUp: TrendDown
    [Trend, stLine]
[Trend, stLine] = f_st( TF2 )

stTrend = close > stLine ? 1:-1
stplot = plot( st_status? stLine : na , color=  stTrend ==1 ? st_bullColor : st_bearColor , linewidth=1 ,title ="Supertrend")

priceLineP = plot( close , color=  na , linewidth=1 , display = display.none)
fill(priceLineP , stplot , color = stHighlights ? stTrend ==1 ? color.new(st_bullColor , 85) : color.new( st_bearColor , 85 ) : na )

//---------------------------------------------------------------------------
//Momentum BarColors

mom2a = rsi > BullLevel  ? Bullish_Bars : WBullish_Bars
mom2b = rsi < BearLevel  ? Bearish_Bars : WBearish_Bars
mom2_color = close > ma ? mom2a : mom2b

mom_color = MomBars ? mom2_color : na
barcolor(mom_color)
//-------------------------------------------------
//Momentum Strength & Values
momVal2a = rsi > BullLevel  ? 2 : 1
momVal2b = rsi < BearLevel  ? -2 : -1
momVal2 = close > ma   ? momVal2a : momVal2b

momVal = momVal2

///==============================================================================================================
//Long Trend Conditions
Entry1aL = Entry1a ? momVal == 2 : true
Entry1bL = Entry1b ? momVal == 1 or momVal == 2 : true

Entry3aL = Entry3a ? close > ma : true
Entry4aL = Entry4a ? rsi > BullLevel : true
Entry4bL = Entry4b ? close > stLine : true
Entry4cL = Entry4c ? stLine > stLine[1] : true
//------
noEntry = Entry1a == false and Entry1b  == false and Entry3a == false and Entry4a == false and Entry4b == false and Entry4c == false ? false : true
noExit  = Exit1a == false and Exit1b == false and Exit3a == false  and Exit4b == false  ? false : true
//------
EntryL =  noEntry and Entry1aL and Entry1bL and Entry3aL and Entry4aL and Entry4bL and Entry4cL

Exit1aL = Exit1a ? momVal == 1 and momVal[1] == 2 : true
Exit1bL = Exit1b ? momVal == -1  or momVal == -2 : true
Exit3aL = Exit3a ? close < ma : true
Exit4bL = Exit4b ? close < stLine  : true

ExitL = noExit and Exit1aL  and Exit3aL and Exit1bL and Exit4bL

//Short Trend Conditions
Entry1aS = Entry1a ? momVal == -2 : true
Entry1bS = Entry1b ? momVal == -1 or momVal == -2 : true

Entry3aS = Entry3a ? close < ma  : true
Entry4aS = Entry4a ? rsi < BearLevel  : true
Entry4bS = Entry4b ? close < stLine  : true
Entry4cS = Entry4c ? stLine < stLine[1] : true

EntryS =  noEntry and Entry1aS and Entry1bS and Entry3aS  and Entry4aS and Entry4bS and Entry4cS

Exit1aS = Exit1a ? momVal == -1 and momVal[1] == -2 : true
Exit1bS = Exit1b ? momVal == 1 or momVal == 2 : true
Exit3aS = Exit3a ? close > ma : true
Exit4bS = Exit4b ? close > stLine : true

ExitS  = noExit and Exit1aS and Exit3aS and Exit1bS and Exit4bS

///==============================================================================================================
//Entry & exit conditions

isLong = false
isLong := nz(isLong[1], false)
isShort = false
isShort := nz(isShort[1], false)

goLong = not isLong and EntryL and not ExitL and longOK and barstate.isconfirmed
goShort = not isShort and EntryS and not ExitS and shortOK and barstate.isconfirmed
longExit = isLong and ExitL and barstate.isconfirmed
shortExit = isShort and ExitS and barstate.isconfirmed

if (goLong)
    isLong := true
    isShort := false

if (goShort)
    isLong := false
    isShort := true

if (longExit)
    isLong := false
if (shortExit)
    isShort := false

//------------------------------------------------------------------------------
// ——Backtester
grouptime           = 'Step 5 - 📆 Time Filter 📆-------------'
startTime      = input    (group=grouptime, title="Start Timeㅤㅤ", defval=timestamp('UTC 01 Jan 2020 00:00'),  inline="Start")
endTime        = input    (group=grouptime, title="End Time ㅤ ㅤ", defval=timestamp('UTC 31 Dec 2025 23:45'),  inline="End")

dateRange = true
//------------------------------------------------------------------------------
// Risk Managment
grouprisk               = 'Step 6 - Risk Management-------------'

takeprofit = input.bool(true,title = "TP Price %",group=grouprisk, inline="profit")
tppercent = input.float(1, '', group=grouprisk, inline="profit") / 100
q1 = input.int    (5 ,              "Quantity %",group=grouprisk , inline="profit")

stoploss = input.bool(false,title = "SL Price %",group=grouprisk, inline="loss")
stoppercent = input.float(5, '', group=grouprisk, inline="loss") / 100

// Determine where you've entered and in what direction
longtp = strategy.position_avg_price * (1 + tppercent)
longStop = strategy.position_avg_price * (1 - stoppercent)
shorttp = strategy.position_avg_price * (1 - tppercent)
shortStop = strategy.position_avg_price * (1 + stoppercent)

QTYMethod               = input.string ('EQUITY',        'Order Size',    group=grouprisk, inline=' ', options=['NONE', 'EQUITY', 'SIZE', 'CONTRACTS'])
useNetProfit            = input.bool   (true,            'Use Net Profit',     group=grouprisk, inline=' ', tooltip='Use Net Profit- On/Off the use of profit in the following trades. *Only works if the type is EQUITY')
riskPerc                = input.int    (30,              '🇪🇶🇺🇮🇹🇾 %',              group=grouprisk, inline='.', minval=1, maxval=100)
riskSize                = input.int    (10000,            '🇸🇮🇿🇪',                group=grouprisk, inline='.', minval=1)
riskCntr                = input.int    (1,               '🇨🇴🇳🇹🇷🇦🇨🇹🇸',           group=grouprisk, inline='.', minval=1, tooltip='Order Size: \nNone- Use the default position size settings in Tab "Properties". \nEquity% - per trade from the initial capital. \nSize- Fixed size amount of trade. \nContracts- The fixed amount of the deal in contracts. \n')

// —————— Order Size
eqty = switch QTYMethod
    'NONE'      => na
    'EQUITY'    => riskPerc / close
    'SIZE'      => riskSize / close
    'CONTRACTS' => riskCntr
//-----------------------------------------------------------------------------
// —————— Trade variables
entry        = strategy.position_avg_price
sizePos      = strategy.position_size
inLong       = sizePos > 0
inShort      = sizePos < 0
inTrade      = inLong or inShort
inPos        = (inLong and not inShort[1]) or (inShort and not inLong[1])
var ID       = 'TradeID'
var tpPrice  = float(na)
var slPrice  = float(na)

///==============================================================================================================
// ALERTS
groupalerts = 'Step 7 - Alerts & Bot Trading Settings-------------'

broker = input.string('Binance', "Broker", options=['Binance', 'Alpaca', 'Kucoin', '3Commas'], group=groupalerts, tooltip = 'Choose which type you are using to send the correct Json Alert message for entry and exit alerts.')
my_sym = input("FTMM/USDT", "Ticker", group = 'Cloud Function Server', tooltip = 'Only used with Alerts to fix ticker ID in json message. Some exchanges use the forward slash and some do not.')
my_pass = input('Passphrase', "Passphrase" , group = 'Cloud Function Server', tooltip = 'Only enter your Passphrase and nothing else goes here. Only needed when using a Cloud Function Server.')
i_alert_3CID_txt = input('Bot ID', "Bot ID", group =groupalerts, tooltip = 'Only enter your 3Commas Bot ID and nothing else goes here.')
i_alert_3CET_txt = input('Bot Email Token', title = 'Bot Email Token', group =groupalerts , tooltip = 'Only enter your 3Commas Bot Email Token and nothing else goes here.')

Alert='{"passphrase": "'+str.tostring(my_pass)+'","symbol": "'+ str.tostring(my_sym) +'","type":"market", "side":"{{strategy.order.action}}","amount":"{{strategy.order.contracts}}","price": "' + str.tostring(close) + '"}'
//---------------------------------------------------------------------------------
// JSON alert message used for 3Commas Bots
C3_EntryAlert ='{"message_type": "bot",  "bot_id": ' + i_alert_3CID_txt + ',  "email_token": "' + i_alert_3CET_txt + '", "delay_seconds": 0 }'
C3_ExitAlert ='{"action": "close_at_market_price_all",  "message_type": "bot",  "bot_id": ' + i_alert_3CID_txt + ',  "email_token": "' + i_alert_3CET_txt + '", "delay_seconds": 0}'
//---------------------------------------------------------------------------------
// JSON alert message used for setting up a Google Cloud Function Server works when using Alpaca Exchange
Alert_Alpaca = '{"symbol": "{{ticker}}", "quantity": "{{strategy.order.contracts}}", "side": "{{strategy.order.action}}", "order_type": "market", "time_in_force": "gtc", "passphrase": "' + str.tostring(my_pass) + '"}'

entryAlert = broker == 'Binance' ? Alert : broker == 'Alpaca' ? Alert_Alpaca : broker == 'Kucoin' ? Alert : C3_EntryAlert
exitAlert = broker == 'Binance' ? Alert : broker == 'Alpaca' ? Alert_Alpaca : broker == 'Kucoin' ? Alert : C3_ExitAlert
strategy.initial_capital = 50000
// —————— Entry's
goLongEntry = goLong and dateRange and barstate.isconfirmed
goShortEntry = goShort and dateRange and barstate.isconfirmed

eqty(qty) => QTYMethod=='EQUITY' ? qty / 100 * (strategy.initial_capital + (useNetProfit ? strategy.netprofit : 0)) : QTYMethod=='SIZE' ? qty / syminfo.pointvalue : qty
if goLongEntry
    ID := 'Long'
    strategy.entry(ID, strategy.long,  qty=eqty(eqty), comment=ID, alert_message = entryAlert)

if goShortEntry
    ID := 'Short'
    strategy.entry(ID, strategy.short, qty=eqty(eqty), comment=ID, alert_message = entryAlert)

// —————— Exit's
qty(perc) => math.abs(sizePos*perc/100)

if longExit
    strategy.close("Long",comment='X', alert_message= exitAlert)
strategy.exit ("exit1", from_entry="Long", limit=takeprofit ? longtp : na, stop=stoploss ? longStop : na, comment_profit='TP', comment_loss='SL', qty_percent=q1)
strategy.exit ("exit2", from_entry="Long", stop=stoploss ? longStop : na, comment_loss='SL')

if shortExit
    strategy.close("Short",comment='X', alert_message= exitAlert)
strategy.exit ("exit1", from_entry="Short", limit=takeprofit ? shorttp : na, stop=stoploss ? shortStop : na, comment_profit='TP', comment_loss='SL', qty_percent=q1)
strategy.exit ("exit2", from_entry="Short", stop=stoploss ? shortStop : na, comment_loss='SL')

///==============================================================================================================

//Style- Plots on Chart
posH = high + 2 * stLine
posL = low - 2 * stLine

plotshape( goLong and PlotEntries ? posL : na ,'Long Entry Signals' , text= '' , location=location.belowbar, style=shape.labelup , size=size.small ,  color=lbullColor , textcolor = color.white )
plotshape( longExit and PlotExits ? posH : na  ,'Long Exit' , location=location.abovebar, style= shape.xcross  , size=size.small,  color=lbullColor )
plotshape( goShort and PlotEntries ? posH : na ,'Short Entry Signals'  , text= '' , location=location.abovebar, style=shape.labeldown , size=size.small  , color=lbearColor  , textcolor = color.white )
plotshape( shortExit and PlotExits ? posL : na  ,'Short Exit' , location=location.belowbar, style=shape.xcross   , size=size.small ,   color=lbearColor )

///==============================================================================================================
// Alerts
alertcondition( goLong  , 'Long Entry Alerts', 'Long Alerts')
alertcondition( goShort , 'Short Entry Alerts', 'Short Alerts')