Estratégia Bipolar de Retorno Mensal

1
Follow
1779
Followers
Descrição
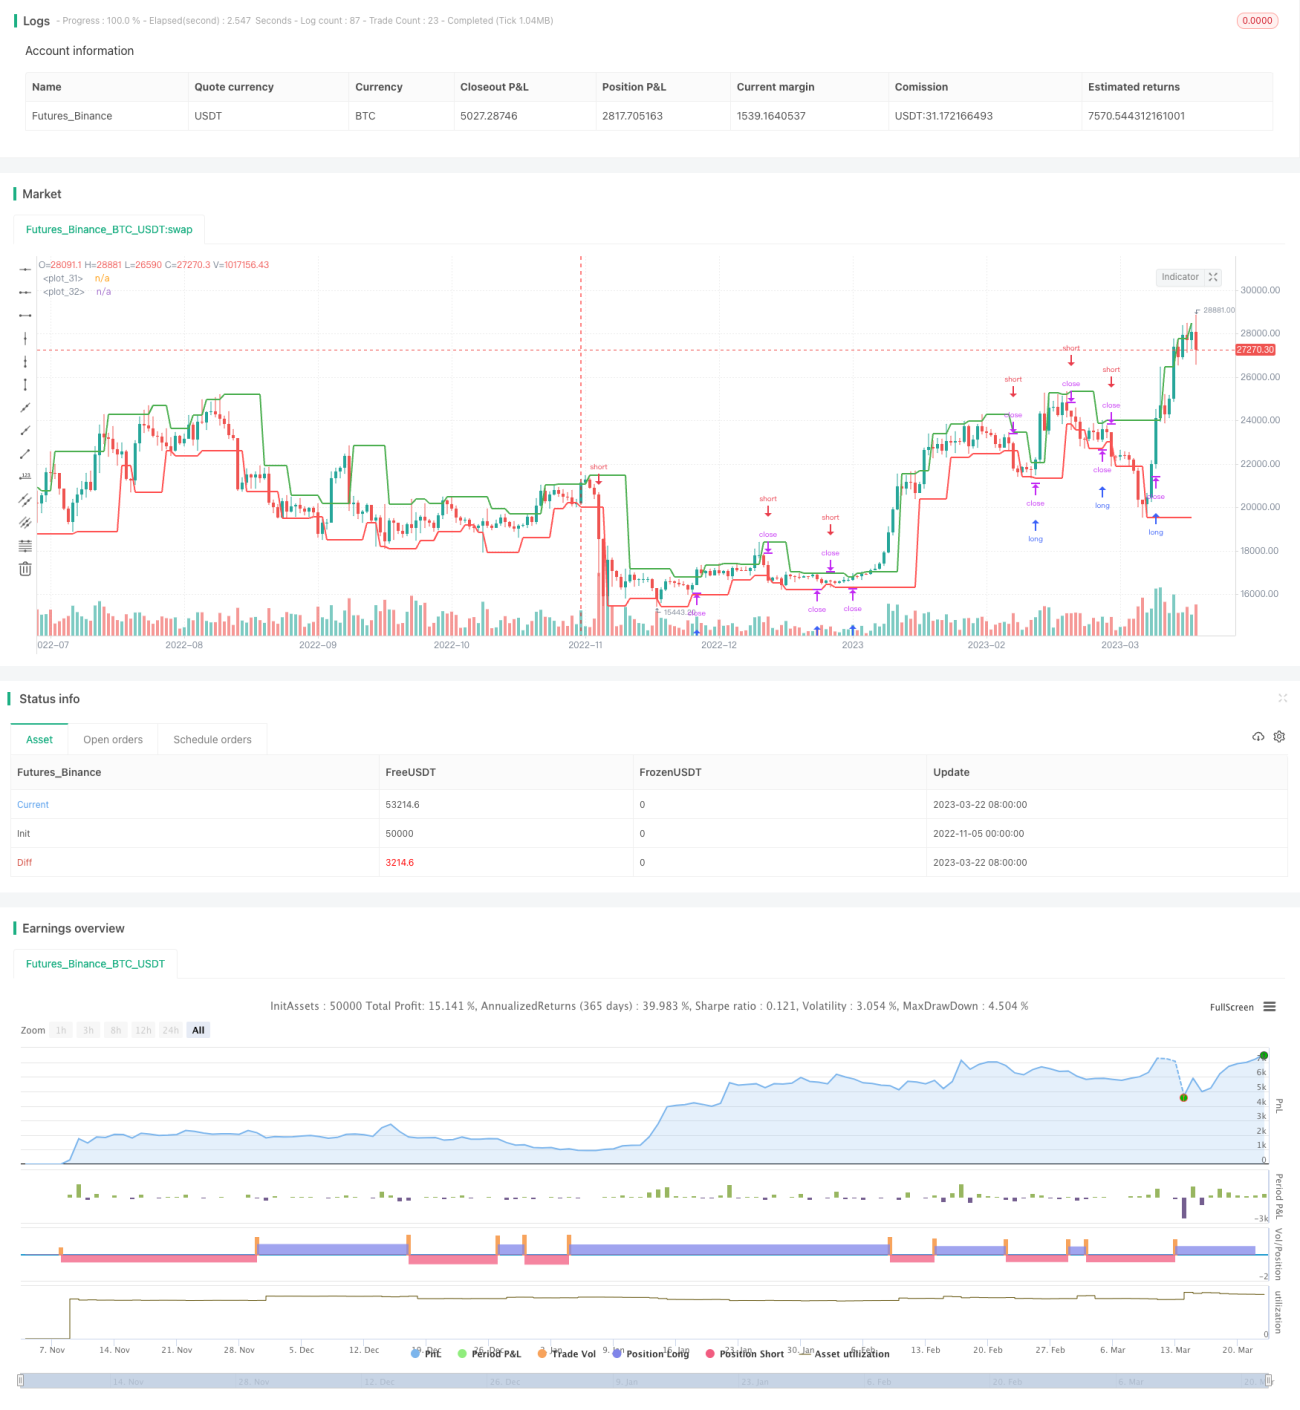
A estratégia usa o ponto central da linha K para determinar a reversão de tendência e, assim, sinalizar a negociação de um mercado de ativos em branco. Quando lucrativa, a estratégia bloqueia os ganhos realizados no mês e evita grandes perdas no período de retração.
Princípios da estratégia
- Utilização
pivothigh()epivotlow()A função calcula o eixo central da linha K. O eixo central pode determinar a reversão da tendência. - Quando o preço ultrapassa o ponto do eixo superior, faça uma posição a mais. Quando o preço cai abaixo do ponto do eixo inferior, faça uma posição a menos.
- No início de cada mês, calcula-se a taxa de retorno do mês anterior e é guardada em um array.
- No começo de cada ano, o rendimento do ano anterior é calculado e guardado em uma matriz.
- Grava uma tabela de rendimentos para visualizar o rendimento por mês e ano.
Análise de vantagens
- A utilização de um pivot para determinar a inversão de tendência pode filtrar parte do ruído dos sinais de negociação.
- O bloqueio de receita mensal reduz o impacto de um mês de perdas, o que torna a receita bipolar.
- A tabela de receitas mostra de forma intuitiva os resultados de cada mês, permitindo ver claramente os períodos positivos e negativos da estratégia.
Análise de Riscos
- Quando os pontos de eixo mudam, isso pode causar erros de reversão de abertura de posição. Os parâmetros podem ser apropriadamente otimizados ou as condições de filtragem adicionadas.
- A obrigação de fechar posições no início do mês pode fazer com que você perca a oportunidade de lucrar o resto do mês.
- A tabela não pode mostrar indicadores de risco, como a retirada máxima. Pode ser considerado o acréscimo de outros indicadores que medem o risco da estratégia.
direção de otimização
- Pode-se adicionar condições de filtragem nas proximidades do eixo central, evitando a frequência de inverter a transação.
- A possibilidade de bloquear apenas algumas posições, em vez de todas as posições vazias, reduz a possibilidade de perdas.
- Pode-se aumentar a exibição de indicadores de risco, tais como a retirada máxima e a taxa de Sharpe, nos quadros.
Resumo
A estratégia usa o ponto central para determinar a reversão da tendência para negociar e bloquear o lucro no final do mês. Isso permite controlar o risco de retração. No entanto, alguns parâmetros e a lógica da estratégia podem ser ainda mais otimizados, tornando os sinais de negociação mais precisos e o controle de risco mais estável.
Source
Pine
/*backtest
start: 2022-11-05 00:00:00
end: 2023-03-23 05:20:00
period: 1d
basePeriod: 1h
exchanges: [{"eid":"Futures_Binance","currency":"BTC_USDT"}]
*/

//@version=4
strategy("Monthly Returns in PineScript Strategies", overlay = true, default_qty_type = strategy.percent_of_equity, default_qty_value = 25, calc_on_every_tick = true, commission_type = strategy.commission.percent, commission_value = 0.1)

// Inputs Strategy parameters
Related strategies
Comment
All comments (0)
No data
- 1