Estratégia de negociação baseada em zonas de oferta e demanda e parada deslizante EMA
Visão geral
A estratégia usa a região de oferta e demanda, a média móvel do índice (EMA) e o intervalo de flutuação real média (ATR) para determinar o sinal de negociação. O usuário pode ajustar a configuração dos parâmetros do EMA e a visibilidade dos sinais de compra e venda. A estratégia marca as regiões de oferta e demanda, como mais alto mais alto (HH), mais baixo mais baixo (LL), mais baixo mais alto (LH) e mais alto mais baixo (HL).
Princípio da estratégia
Cálculo do indicador
A média móvel do EMA:
- A EMA é calculada com base no preço de fechamento de um determinado período (default 200).
- A fórmula da EMA:(EMA=(Pricet \times \alpha)+(EMA{t-1}×(1−\alpha)))Dentre eles,(\alpha=\frac{2}{length+1})。
ATR média real amplitude de flutuação:
- O ATR é uma medida da volatilidade do mercado, calculada com base na real variação dos preços.
- O verdadeiro intervalo de variação é o maior dos três valores seguintes:
- Preço máximo atual menos o preço mínimo atual
- Preço máximo atual menos o valor absoluto do último preço de fechamento
- Preço mínimo atual menos o valor absoluto do último preço de fechamento
- O ATR típico tem um ciclo de 14 anos.
Esses cálculos são usados para avaliar a tendência do EMA e para definir o ATR de stop loss móvel com base na volatilidade do mercado. A estratégia visa fornecer um sinal de compra e venda com base na relação entre o preço de encerramento, o EMA e o valor do ATR.
Juízo de oferta e demanda
A estratégia usa termos como HH (mais alto mais alto), LL (mais baixo mais baixo), HL (mais alto mais baixo) e LH (mais baixo mais alto) para identificar diferentes padrões de comportamento de preços, frequentemente usados na análise de tendências:
Mais alto, mais altoO preço atual é mais alto do que o anterior, indicando um potencial aumento.
Mais baixo, mais baixoO preço atual é menor do que o anterior, indicando um potencial movimento descendente.
Mais alto, mais baixo (HL)A tendência de alta potencial continua: o mínimo atual é maior do que o mínimo anterior.
Mais baixo mais altoO preço atual é mais baixo do que o anterior, indicando que a tendência potencial para a baixa continua.
Estes padrões são usados em conjunto com outros indicadores técnicos para determinar a reversão ou continuação de uma tendência potencial. A estratégia usa esses padrões para identificar o momento de entrada ou saída.
Entradas e saídas
Sinais de entradaA terceira linha K produz um sinal de compra/venda quando o preço de fechamento é superior/inferior ao preço máximo/mínimo do dia anterior.
Método de amortização: com um determinado múltiplo do valor ATR (default 2x) como ponto de parada de retorno.
Vantagens estratégicas
- Combinação de vários fatores, como tendências, reversões e volatilidade, para avaliar o mercado de forma integrada e evitar falsas rupturas.
- Utilize as áreas de oferta e demanda para determinar a resistência de suporte crítico.
- O sistema ATR Stop Loss acompanha dinamicamente as flutuações do mercado.
- Parâmetros EMA e ATR personalizáveis.
- Regras de entrada simples e fáceis de implementar.
Risco e otimização
- O risco de erro de avaliação deve ser adequadamente otimizado para a duração da EMA.
- A configuração do ATR é excessiva, com risco de falha de seguimento.
- Pode-se considerar uma combinação de outros fatores para filtrar o sinal de entrada.
- A estratégia pode ser tentada com o uso de snipers de tendência, que podem ser complementares.
Resumir
A estratégia integra a aplicação de vários indicadores técnicos e a determinação de formas de preços, como tendências, reversões e volatilidade, que funcionam bem em retrospectivas. No entanto, a complexidade do mercado real é variável, sendo necessário otimizar e filtrar adequadamente os sinais de entrada. A estratégia é uma estratégia básica que pode ser ampliada com base nela, em combinação com outros fatores ou modelos.
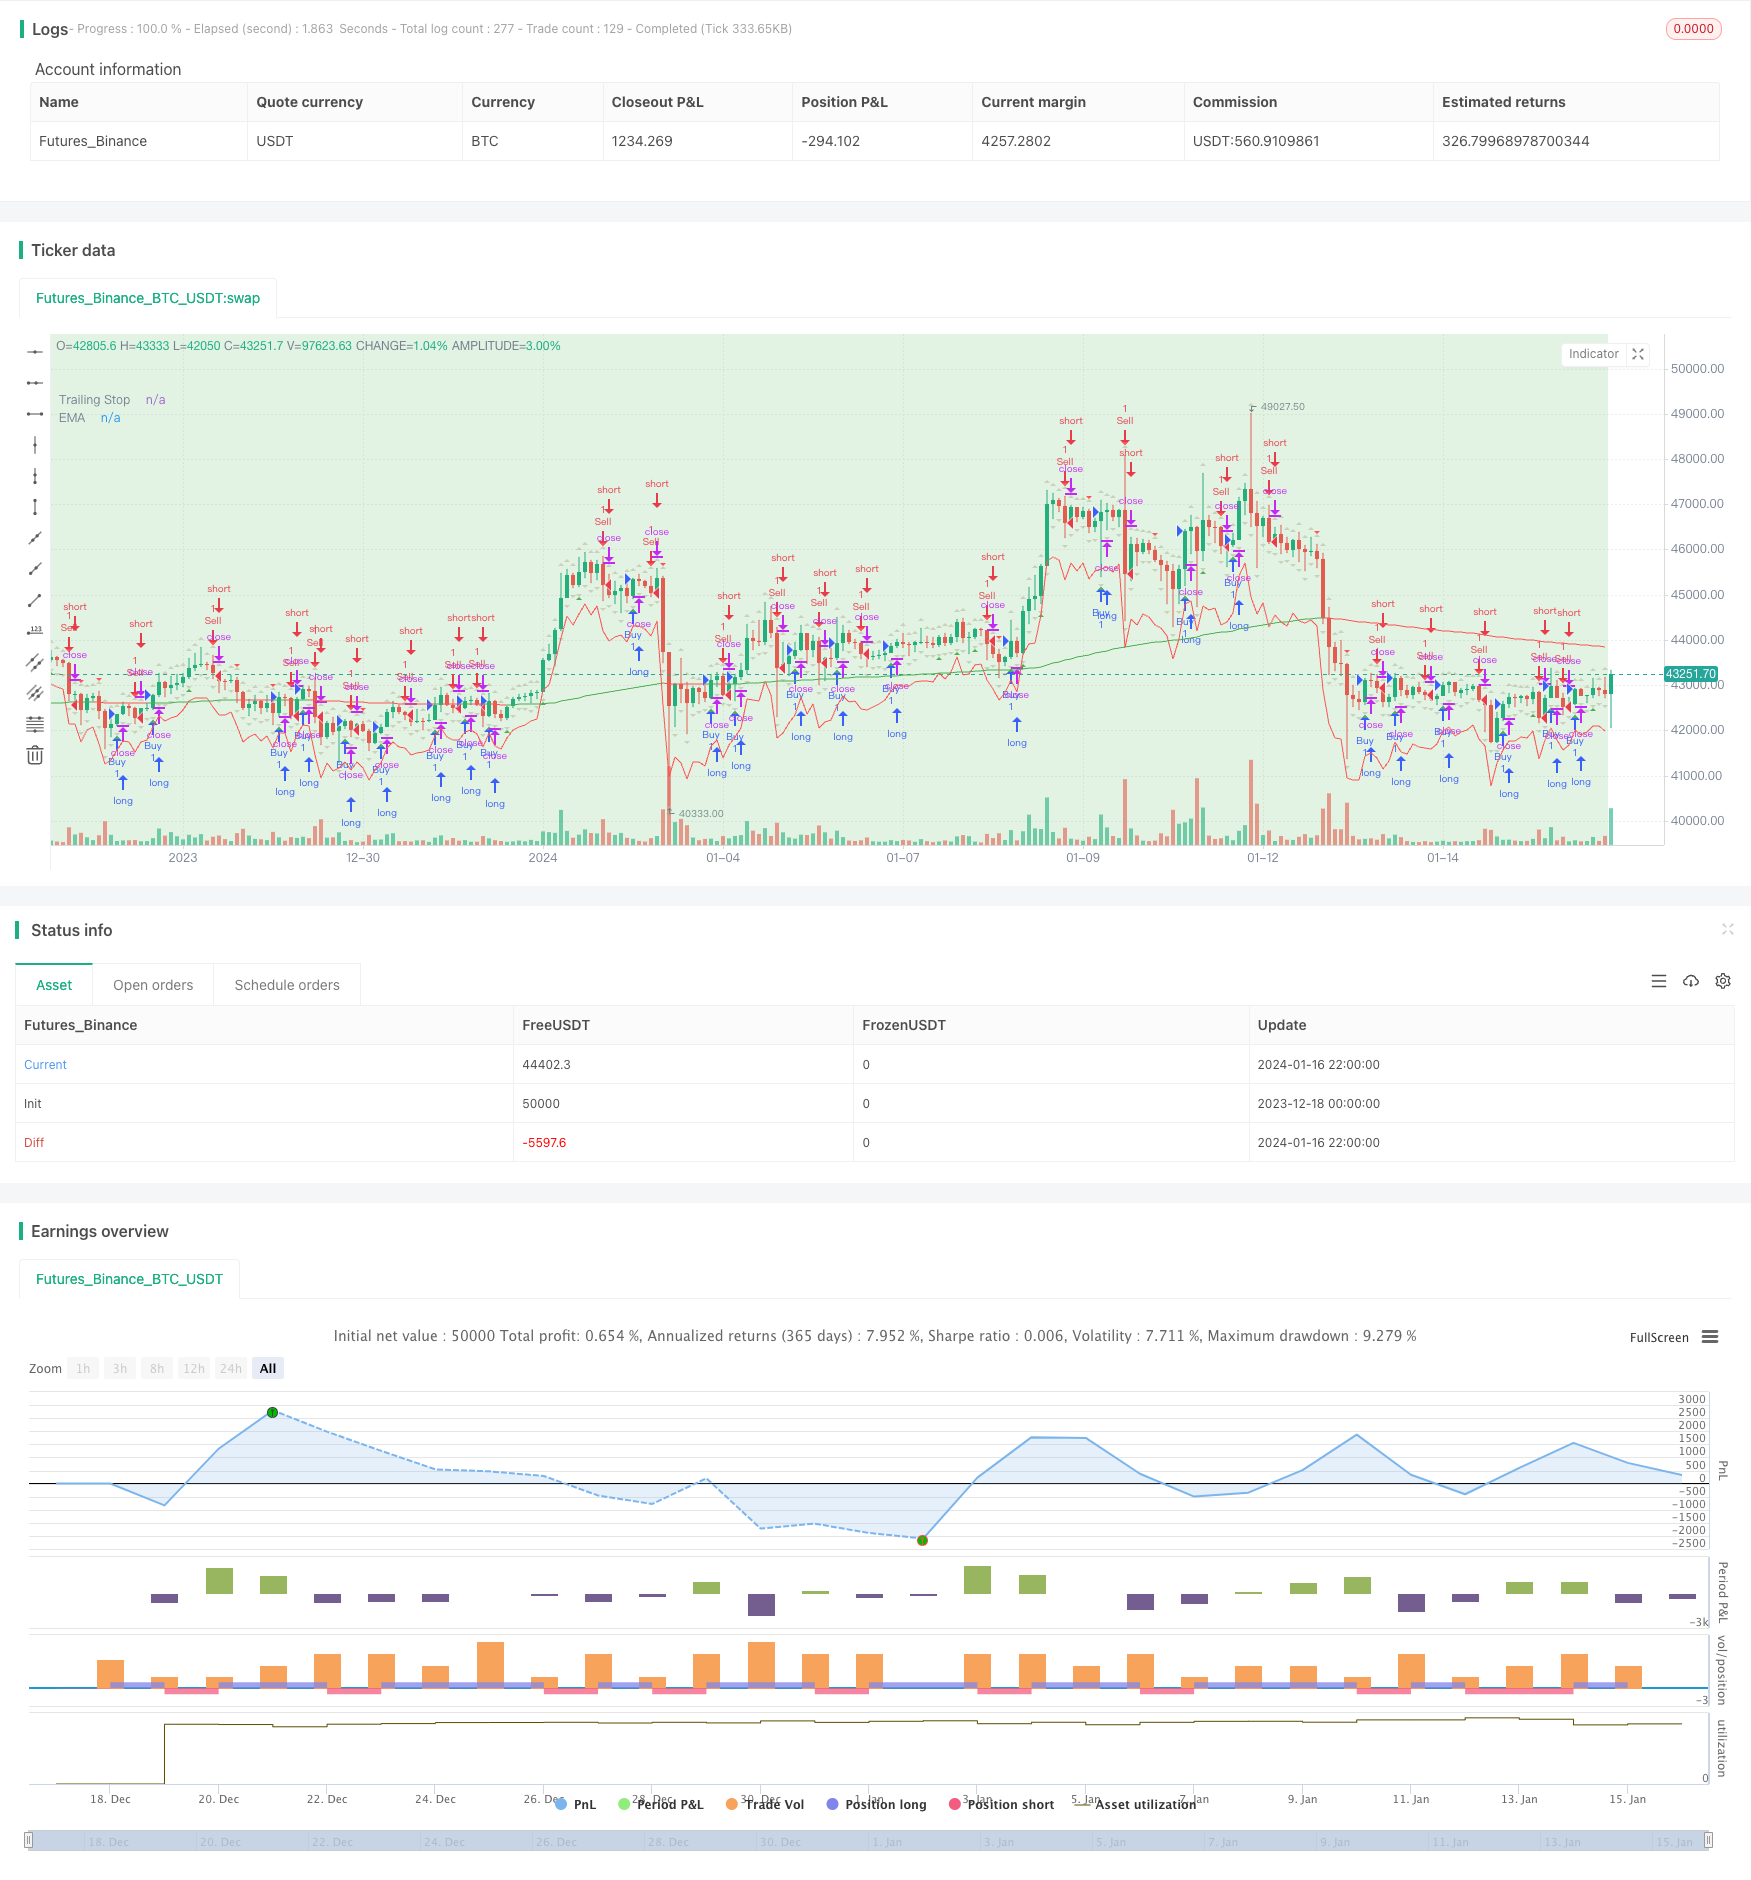
/*backtest
start: 2023-12-18 00:00:00
end: 2024-01-17 00:00:00
period: 2h
basePeriod: 15m
exchanges: [{"eid":"Futures_Binance","currency":"BTC_USDT"}]
*/

//@version=5
strategy("Supply and Demand Zones with EMA and Trailing Stop", shorttitle="SD Zones", overlay=true)

showBuySignals = input(true, title="Show Buy Signals", group="Signals")
showSellSignals = input(true, title="Show Sell Signals", group="Signals")
showHLZone = input(true, title="Show HL Zone", group="Zones")
showLHZone = input(true, title="Show LH Zone", group="Zones")
showHHZone = input(true, title="Show HH Zone", group="Zones")
showLLZone = input(true, title="Show LL Zone", group="Zones")

emaLength = input(200, title="EMA Length", group="EMA Settings")
atrLength = input(14, title="ATR Length", group="Trailing Stop")
atrMultiplier = input(2, title="ATR Multiplier", group="Trailing Stop")

// Function to identify supply and demand zones
getZones(src, len, mult) =>
    base = request.security(syminfo.tickerid, "D", close)
    upper = request.security(syminfo.tickerid, "D", high)
    lower = request.security(syminfo.tickerid, "D", low)
    multiplier = request.security(syminfo.tickerid, "D", mult)
    zonetype = base + multiplier * len
    zone = src >= zonetype
    [zone, upper, lower]

// Identify supply and demand zones
[supplyZone, _, _] = getZones(close, high[1] - low[1], 1)
[demandZone, _, _] = getZones(close, high[1] - low[1], -1)

// Plot supply and demand zones
bgcolor(supplyZone ? color.new(color.red, 80) : na)
bgcolor(demandZone ? color.new(color.green, 80) : na)

// EMA with Linear Weighted method
ema = ta.ema(close, emaLength)

// Color code EMA based on its relation to candles
emaColor = close > ema ? color.new(color.green, 0) : close < ema ? color.new(color.red, 0) : color.new(color.yellow, 0)

// Plot EMA
plot(ema, color=emaColor, title="EMA")

// Entry Signal Conditions after the third candle
longCondition = ta.crossover(close, high[1]) and bar_index >= 2
shortCondition = ta.crossunder(close, low[1]) and bar_index >= 2

// Trailing Stop using ATR
atrValue = ta.atr(atrLength)
trailStop = close - atrMultiplier * atrValue

// Strategy Entry and Exit
if (longCondition)
    strategy.entry("Buy", strategy.long)
    strategy.exit("TrailStop", from_entry="Buy", loss=trailStop)

if (shortCondition)
    strategy.entry("Sell", strategy.short)
    strategy.exit("TrailStop", from_entry="Sell", loss=trailStop)

// Plot Entry Signals
plotshape(series=showBuySignals ? longCondition : na, title="Buy Signal", color=color.new(color.green, 0), style=shape.triangleup, location=location.belowbar)
plotshape(series=showSellSignals ? shortCondition : na, title="Sell Signal", color=color.new(color.red, 0), style=shape.triangledown, location=location.abovebar)

// Plot Trailing Stop
plot(trailStop, color=color.new(color.red, 0), title="Trailing Stop")

// Plot HH, LL, LH, and HL zones
plotshape(series=showHHZone and ta.highest(high, 2)[1] and ta.highest(high, 2)[2] ? 1 : na, title="HH Zone", color=color.new(color.blue, 80), style=shape.triangleup, location=location.abovebar)
plotshape(series=showLLZone and ta.lowest(low, 2)[1] and ta.lowest(low, 2)[2] ? 1 : na, title="LL Zone", color=color.new(color.blue, 80), style=shape.triangledown, location=location.belowbar)
plotshape(series=showLHZone and ta.highest(high, 2)[1] and ta.lowest(low, 2)[2] ? 1 : na, title="LH Zone", color=color.new(color.orange, 80), style=shape.triangleup, location=location.abovebar)
plotshape(series=showHLZone and ta.lowest(low, 2)[1] and ta.highest(high, 2)[2] ? 1 : na, title="HL Zone", color=color.new(color.orange, 80), style=shape.triangledown, location=location.belowbar)