Индикатор колебания высоко/низко с подтверждением MACD и EMA
Автор:Чао Чжан, Дата: 2022-05-11 16:28:07Тэги:MACD
Индикатор Swing High/Low с подтверждением MACD и EMA от KaizenTraderB
Я разработал этот индикатор для использования в стратегии срыва рыночной структуры. Он обозначает подвижные максимумы и минимумы, которые подтверждаются MACD. Он также отображает более высокие временные рамки Fast и Slow EMA для определения направленного уклонения. Также предоставляет предупреждения, которые сигнализируют о Swing Low в нисходящих тенденциях и Swing High в восходящих. Он начертает горизонтальную линию на последнем высоком и низком колебании.
Покажите этот индикатор на своем временном диапазоне входа и выберите Высший временной диапазон в настройках.
Вы также можете изменить период просмотра для Swing Highs и Lows и EMA
Когда я использую это я ищу Swing высокий / низкий разрыв в направлении HTF тренд Затем следует искать отступление между уровнем ценового перерыва и областями ликвидности (порошки, блоки заказов, ценовое перегружение) для входа в направлении тенденции EMA.
обратная проверка
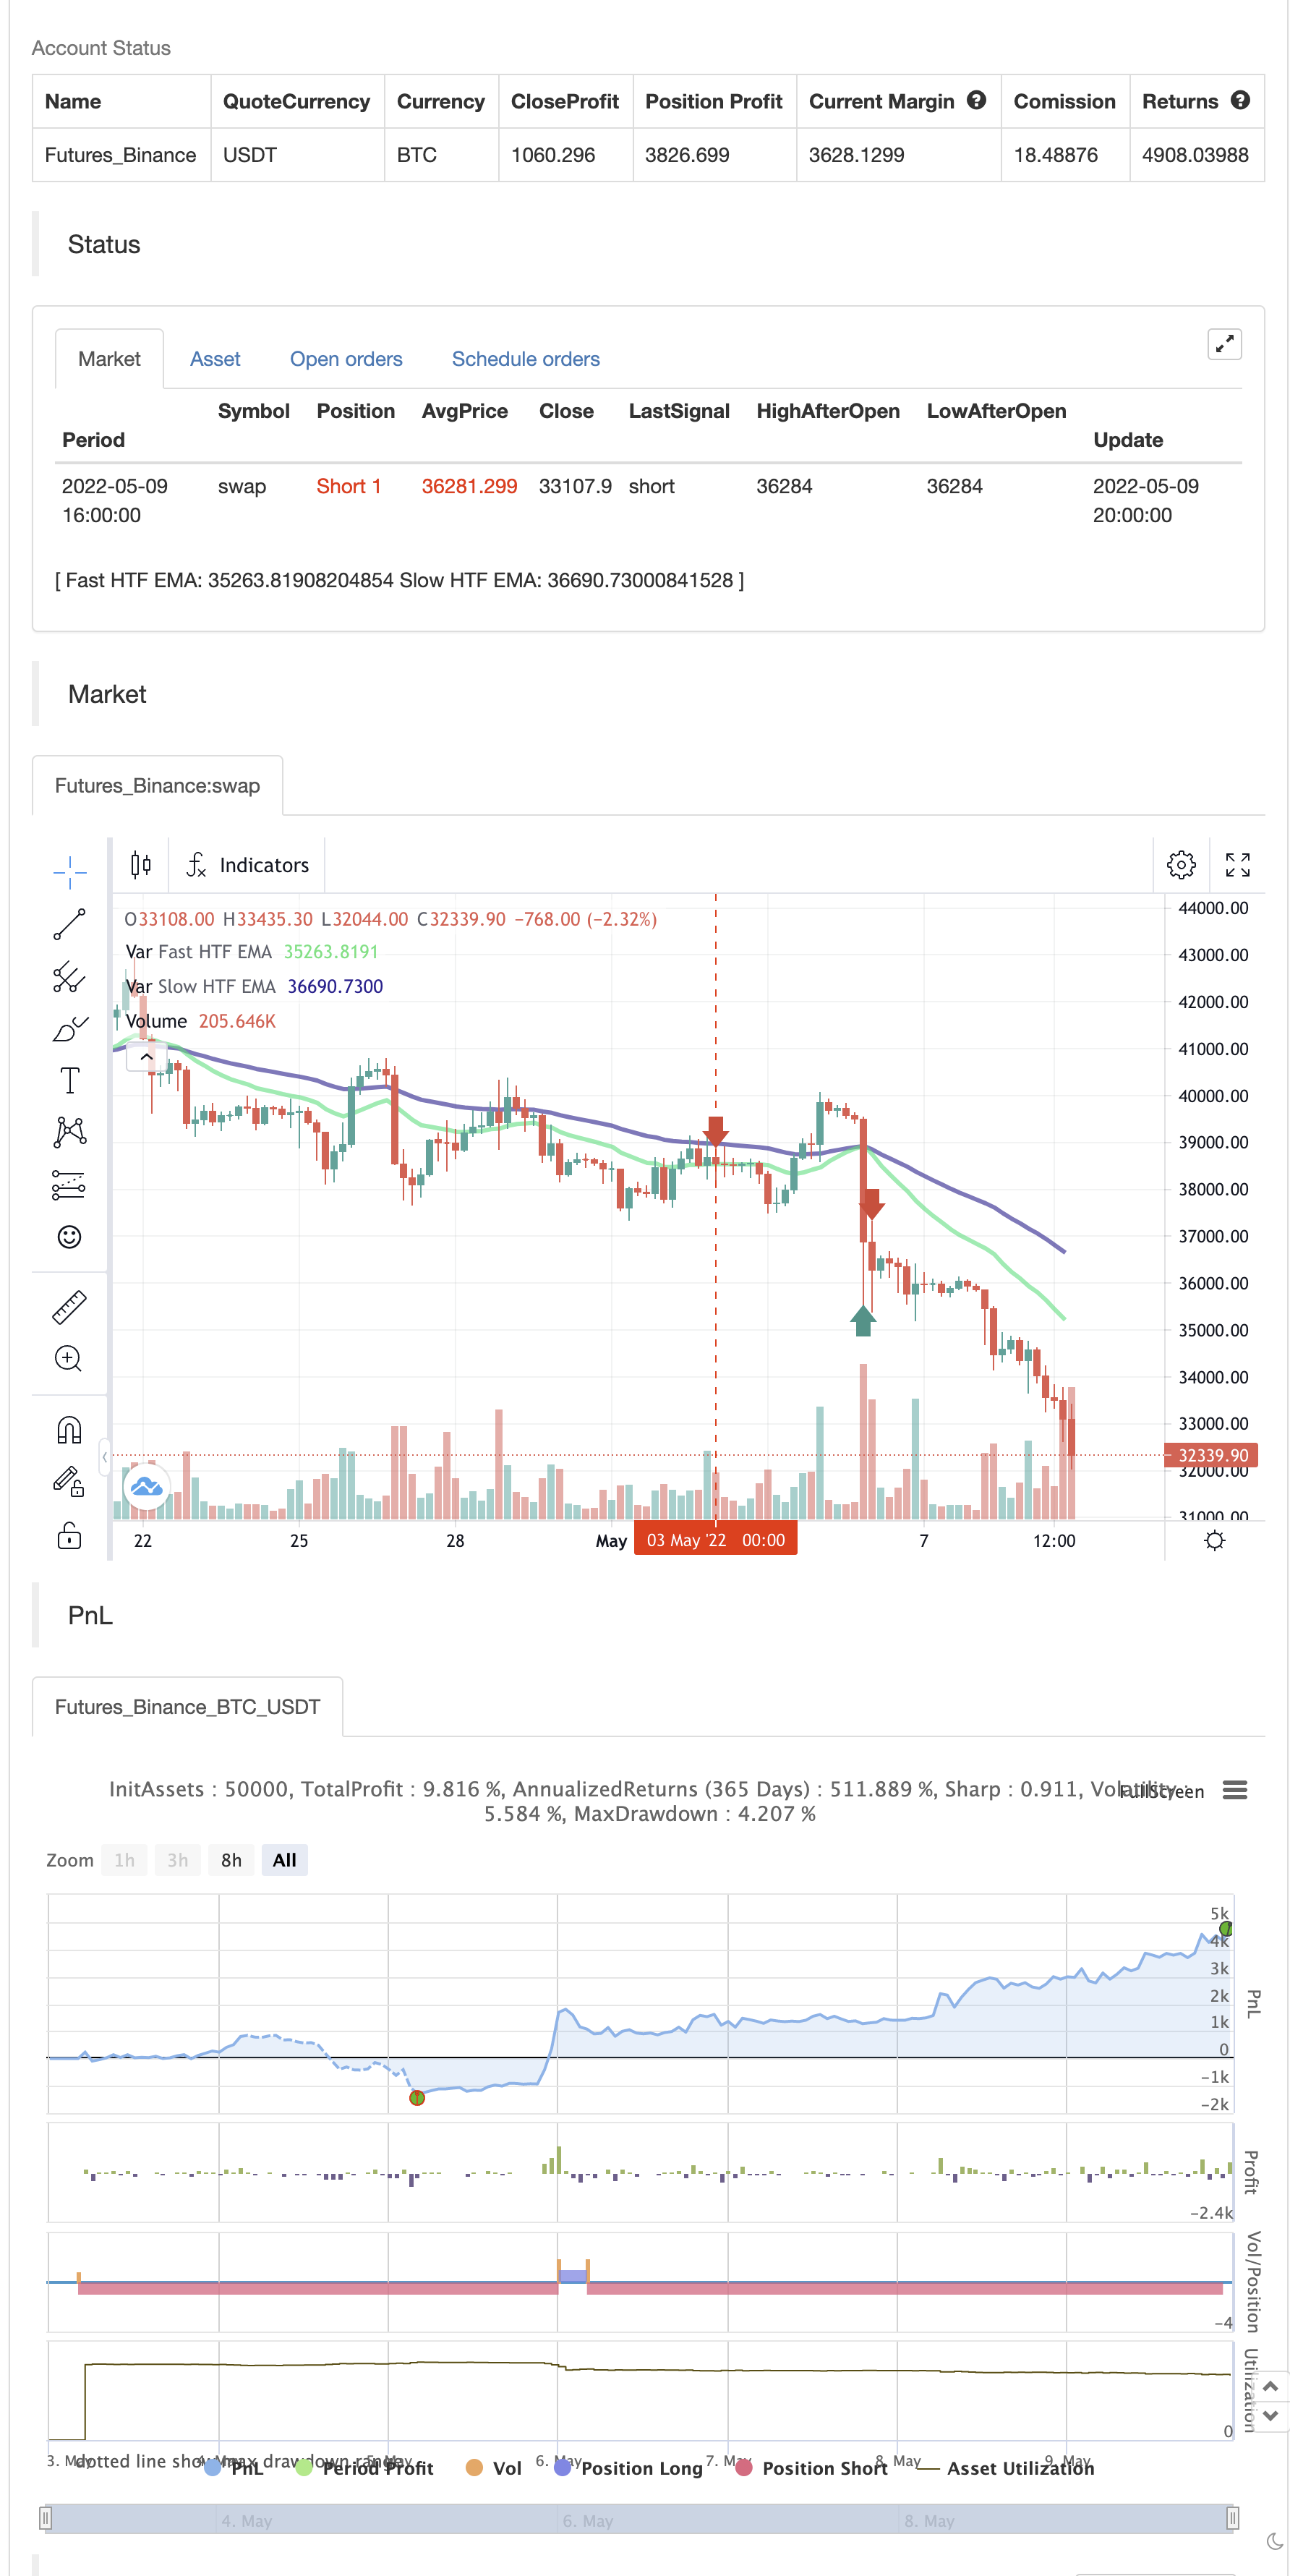
/*backtest
start: 2022-05-03 00:00:00
end: 2022-05-09 23:59:00
period: 4h
basePeriod: 15m
exchanges: [{"eid":"Futures_Binance","currency":"BTC_USDT"}]
*/

// Swing High/Low Indicator w/ MACD and EMA Confirmations by KaizenTraderB
//
//I designed this indicator to be used with a market structure break strategy.
//It labels swing highs and lows that are confirmed by the MACD.
//It also displays a higher timeframe Fast and Slow EMA to determine directional bias.
//Also provides alerts that signal Swing Low breaks in downtrends and Swing High Breaks in uptrends.
//It draws a horizontal line on the last Swing High and Low.
//
//Display this indicator on your entry timeframe and choose your Higher Timeframe in settings.
//You can also change lookback period for Swing Highs and Lows and EMA's.
//
//@version=4
study("Swing High/Low Indicator w/ MACD and HTF EMA's", overlay=true)

barsback = input(5, title='Bars back to check for a swing')
showsig = input(true, title='Show Signal Markers')
res = input(title="EMA Timeframe", defval="240")
flen = input(title="Fast EMA Length", type=input.integer, defval=20)
slen = input(title="Slow EMA Length", type=input.integer, defval=50)
showema = input(title="Show EMA's", type=input.bool, defval=true)
showentry = input(title="Show Swing Break Entry Levels", type=input.bool, defval=true)

//HTF EMA's

fema = ema(close, flen)
sema = ema(close, slen)

rp_security(_symbol, _res, _src, _gaps, _lookahead) => security(_symbol, _res, _src[barstate.isrealtime ? 1 : 0], _gaps, _lookahead)

femaSmooth = rp_security(syminfo.tickerid, res, fema, barmerge.gaps_on, barmerge.lookahead_off)
semaSmooth = rp_security(syminfo.tickerid, res, sema, barmerge.gaps_on, barmerge.lookahead_off)
plot(showema ? femaSmooth : na,"Fast HTF EMA", color.lime, 3)
plot(showema ? semaSmooth : na,"Slow HTF EMA", color.navy, 3)

downtrend = femaSmooth < semaSmooth
uptrend = femaSmooth > semaSmooth

//Swing Highs and Lows
////////////////////////////////////////////////////////////////////////////////
//Thank you Backtest-Rookies.com for the Swing Detection Indicator code

swing_detection(index)=>
    swing_high = false
    swing_low = false
    start = (index*2) - 1 // -1 so we have an even number of
    swing_point_high = high[index]
    swing_point_low = low[index]

    //Swing Highs
    for i = 0 to start
        swing_high := true
        if i < index
            if high[i] > swing_point_high
                swing_high := false
                break
        // Have to do checks before pivot and after seperately because we can get
        // two highs of the same value in a row. Notice the > and >= difference
        if i > index
            if high[i] >= swing_point_high
                swing_high := false
                break

    //Swing lows
    for i = 0 to start
        swing_low := true
        if i < index
            if low[i] < swing_point_low
                swing_low := false
                break
        // Have to do checks before pivot and after seperately because we can get
        // two lows of the same value in a row. Notice the > and >= difference
        if i > index
            if low[i] <= swing_point_low
                swing_low := false
                break

    [swing_high, swing_low]

// Check for a swing
[swing_high, swing_low] = swing_detection(barsback)
////////////////////////////////////////////////////////////////////////////////

float swing_high_price = na
float swing_low_price = na

if swing_high
    swing_high_price := high[barsback]
if swing_low
    swing_low_price := low[barsback]

[macdline, signalline, histline] = macd(close,12,26,9)

macpos = histline[barsback] > 0
macneg = histline[barsback] < 0

// Plotting

SHPrice = "SH\n" + str.tostring(swing_high_price)
SLPrice = "SL\n" + str.tostring(swing_low_price)

if swing_high and macpos and showsig
    //SHLabel = label.new(bar_index[barsback], swing_high_price, SHPrice, xloc.bar_index, yloc.abovebar, color.red, label.style_arrowdown, textcolor=color.red, size=size.normal)
    //SHLine = line.new(bar_index[barsback], swing_high_price, bar_index[barsback] + 20, swing_high_price, xloc.bar_index, extend.none, color.black, width=2)
    //line.delete(SHLine[1])

if swing_low and macneg and showsig
    //label.new(bar_index[barsback], swing_low_price, SLPrice, xloc.bar_index, yloc.belowbar, color.green, label.style_arrowup, textcolor=color.green)
    //SLLine = line.new(bar_index[barsback], swing_low_price, bar_index[barsback] + 20, swing_low_price, xloc.bar_index, extend.none, color.black, width=2)
    //line.delete(SLLine[2])

//alerts
alertcondition(uptrend and close > swing_high_price, "Swing High Break in Uptrend", "Swing High Break!")
alertcondition(downtrend and close < swing_low_price, "Swing Low Break in Downtrend", "Swing Low Break!")

if uptrend
    strategy.entry("Enter Long", strategy.long)
else if downtrend
    strategy.entry("Enter Short", strategy.short)
- Улучшенная стратегия перекрестного использования EMA с RSI/MACD/ATR
- Комбинированная долгосрочная стратегия торговли MACD и RSI
- Стратегия комбинирования нескольких индикаторов (CCI, DMI, MACD, ADX)
- Многопоказательная тенденция в соответствии со стратегией
- Гибридная краткосрочная стратегия CCI, DMI и MACD
- Теория волн Эллиота 4-9 Импульсная волна Автоматическое обнаружение Стратегия торговли
- Стратегия MACD "Золотой крест" и "Крест смерти"
- MACD-V и многовременная динамическая стратегия получения прибыли Фибоначчи
- Стратегия прорыва MACD BB
- Оптимизированная стратегия MACD для отслеживания тренда с управлением рисками на основе ATR
- Длинная краткосрочная стратегия
- РСИ и BB и одновременно перепроданные
- Прокатывающие свечи Хайкина Аши
- Комбо 2/20 EMA и фильтр пропускания полосы
- ESSMA
- 3EMA
- Ключевые блоки порядка
- NMVOB-S
- Движущаяся средняя цветная EMA/SMA
- Группа MAHL
- 3 Супертенденция добавления в этом единственном сценарии
- Трехкратная EMA + MACD
- Играть в крест
- Меньшие фракталы (+ Прозрачность)
- Точки входа BB-RSI-ADX
- Корпус-4ema
- Угол атаки Следующий индикатор линии
- Киджунсенская линия с крестом
- AMACD - Все скользящие средние конвергенции Дивергенция
- MA HYBRID BY RAJ (магический гибрид)
- Диамантный тренд