CM MACD Custom Indicator - Многократные временные рамки - V2
Автор:Чао Чжан, Дата: 2022-05-20 17:08:49Тэги:MACDSMAЕМА
Спасибо @SKTennis за помощь в обновлении кода в V2
Добавить группы в панель настроек.
Добавление цветовых графиков в панель настроек
Переключение на логику MTF для автоматического включения/выключения с/ TradingView
обратная проверка
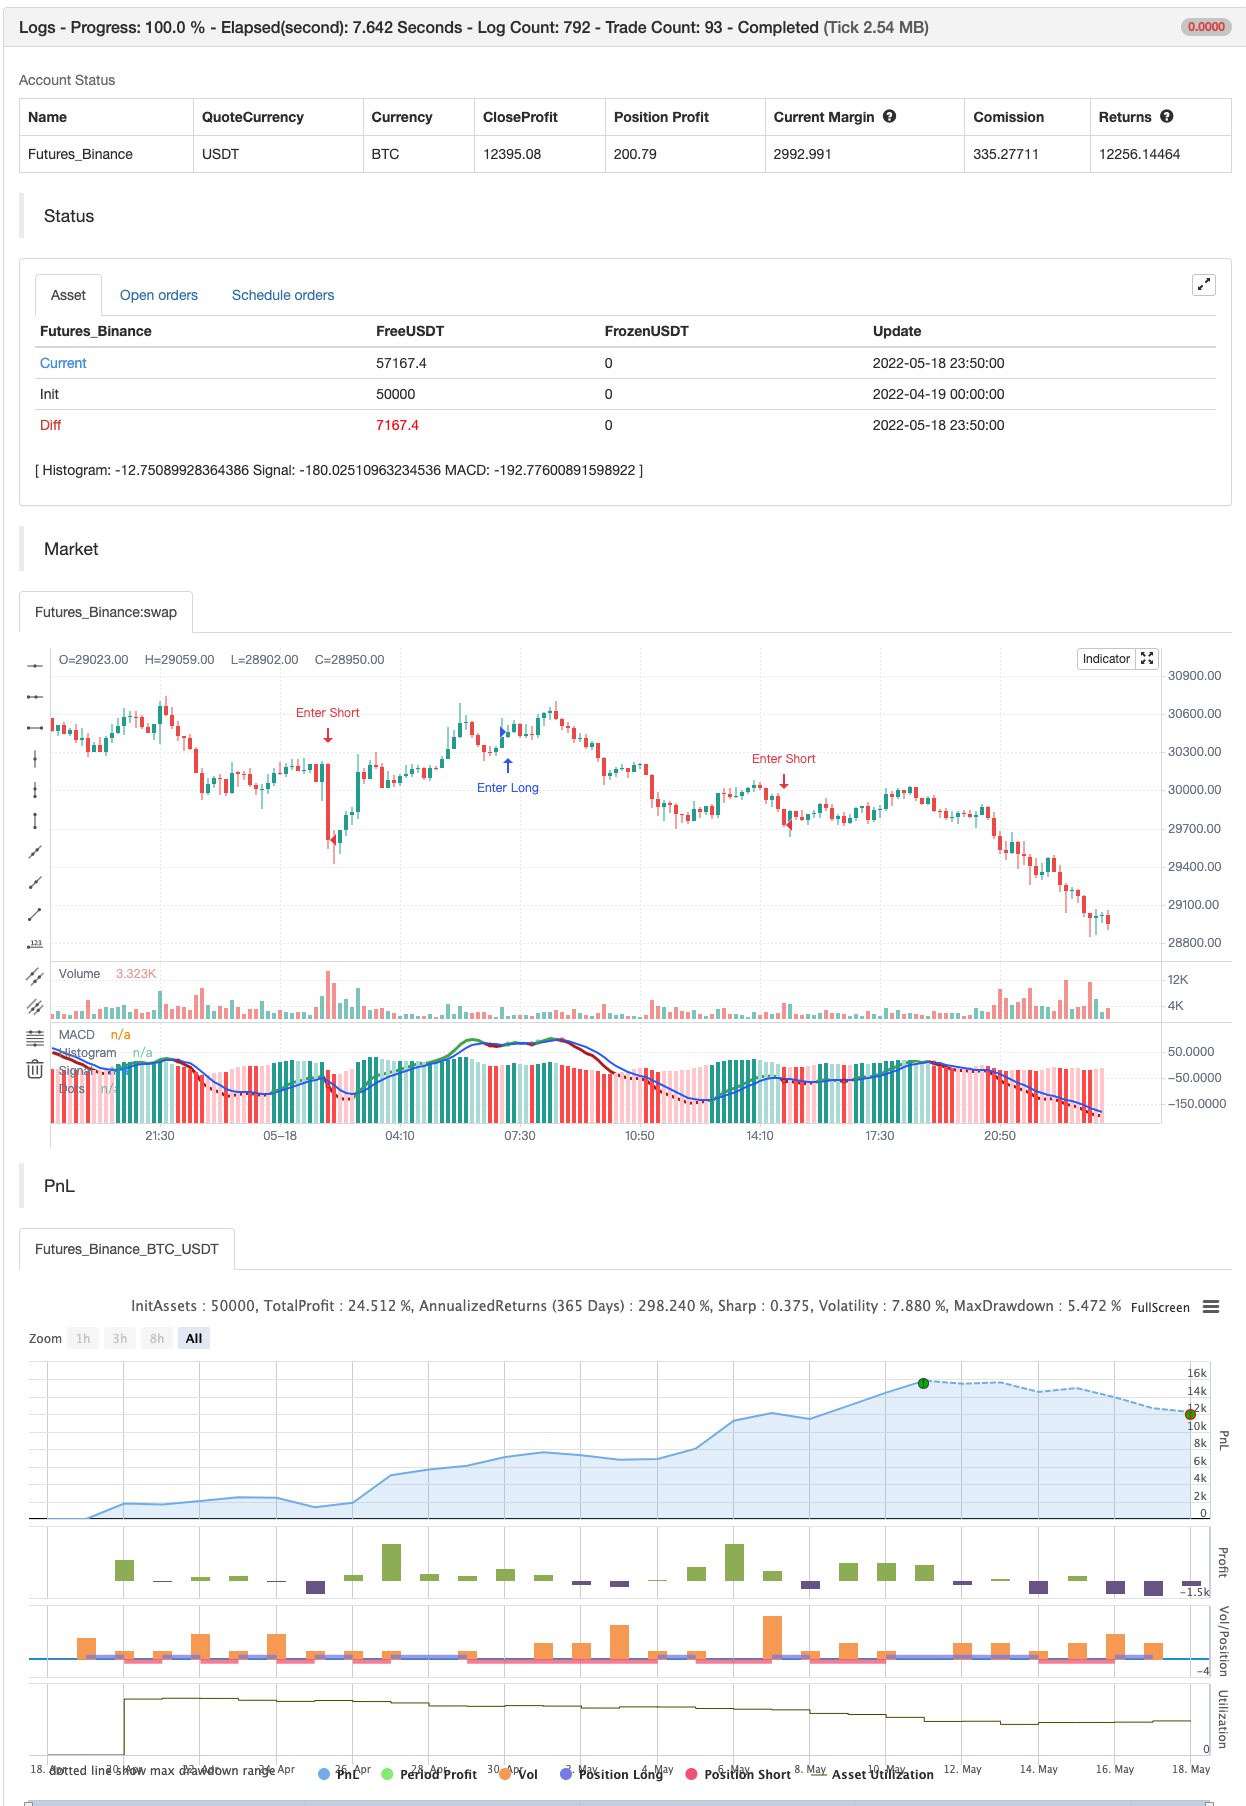
/*backtest
start: 2022-04-19 00:00:00
end: 2022-05-18 23:59:00
period: 10m
basePeriod: 1m
exchanges: [{"eid":"Futures_Binance","currency":"BTC_USDT"}]
*/

//------New V2 Update 07-28-2021----------
//Thanks to @SKTennis for help in Updating code to V2
//Added Groups to Settings Pane.
//Added Color Plots to Settings Pane
//Switched MTF Logic to turn ON/OFF automatically w/ TradingView's Built in Feature
//Updated Color Transparency plots to work in future update
//Added Ability to Turn ON/OFF Show MacD & Signal Line
//Added Ability to Turn ON/OFF Show Histogram
//Added Ability to Change MACD Line Colors Based on Trend
//Added Ability to Highlight Price Bars Based on Trend
//Added Alerts to Settings Pane.
//Customized how Alerts work.  Must keep Checked in Settings Pane, and...
//When you go to Alerts Panel, Change Symbol to Indicator (CM_Ult_MacD_MTF_V2)
//Customized Alerts to Show Symbol, TimeFrame, Closing Price, MACD Crosses Up & MACD Crosses Down Signals in Alert
//Alerts are Pre-Set to only Alert on Bar Close

//------New V2.1 Update 08-03-2021----------
//Added back in ability to show Dots when MACD Crosses.
//Added Ability to Change Plot Widths in Settings Pane
//Added in Alert Feature where Cross Up if above 0 or cross down if below 0 (OFF By Default) user Request. @creid58
//FIXED - Plot Orders to Default what Plots are on top of each other
//FIXED - Two of the histogrm colors were backwrds

//------New V2.1 Update 12-07-2021----------
//Updated to PineScript V5

//------Minor Update 02-16-2022----------
//Per user request...Increased the Maxval for Signal Smoothing
//Next Add in Plot Types to Settings Pane.
//Next Add in more Moving Average types.
//See Video for Detailed Overview

//@version=5
indicator(title="_CM_MacD_Ult_MTF_V2.1", shorttitle="_CM_Ult_MacD_MTF_V2.1")
//Plot Inputs
res           = input.timeframe("",  "Indicator TimeFrame")
fast_length   = input.int(title="Fast Length", defval=12)
slow_length   = input.int(title="Slow Length", defval=26)
src           = input.source(title="Source", defval=close)
signal_length = input.int(title="Signal Smoothing", minval = 1, maxval = 999, defval = 5)
sma_source    = input.string(title="Oscillator MA Type", defval="EMA", options=["SMA", "EMA"])
sma_signal    = input.string(title="Signal Line MA Type", defval="EMA", options=["SMA", "EMA"])
// Show Plots T/F
show_macd     = input.bool(true, title="Show MACD Lines", group="Show Plots?", inline="SP10")
show_macd_LW  = input.int(3, minval=0, maxval=5, title = "MACD Width", group="Show Plots?", inline="SP11")
show_signal_LW= input.int(2, minval=0, maxval=5, title = "Signal Width", group="Show Plots?", inline="SP11")
show_Hist     = input.bool(true, title="Show Histogram", group="Show Plots?", inline="SP20")
show_hist_LW  = input.int(5, minval=0, maxval=5, title = "-- Width", group="Show Plots?", inline="SP20")
show_trend    = input.bool(true, title = "Show MACD Lines w/ Trend Color", group="Show Plots?", inline="SP30")
show_HB       = input.bool(false, title="Show Highlight Price Bars", group="Show Plots?", inline="SP40")
show_cross    = input.bool(false, title = "Show BackGround on Cross", group="Show Plots?", inline="SP50")
show_dots     = input.bool(true, title = "Show Circle on Cross", group="Show Plots?", inline="SP60")
show_dots_LW  = input.int(5, minval=0, maxval=5, title = "-- Width", group="Show Plots?", inline="SP60")

//show_trend    = input(true, title = "Colors MACD Lines w/ Trend Color", group="Show Plots?", inline="SP5")
// MACD Lines colors
col_macd      = input(#FF6D00, "MACD Line  ",  group="Color Settings", inline="CS1")
col_signal    = input(#2962FF, "Signal Line  ",  group="Color Settings", inline="CS1")
col_trnd_Up   = input(#4BAF4F, "Trend Up      ",  group="Color Settings", inline="CS2")
col_trnd_Dn   = input(#B71D1C, "Trend Down    ",  group="Color Settings", inline="CS2")
// Histogram Colors
col_grow_above = input(#26A69A, "Above   Grow",  group="Histogram Colors", inline="Hist10")
col_fall_above = input(#B2DFDB, "Fall",  group="Histogram Colors", inline="Hist10")
col_grow_below = input(#FF5252, "Below Grow",  group="Histogram Colors", inline="Hist20")
col_fall_below = input(#FFCDD2, "Fall",  group="Histogram Colors", inline="Hist20")
// Alerts T/F Inputs
alert_Long    = input.bool(true, title = "MACD Cross Up", group = "Alerts", inline="Alert10")
alert_Short   = input.bool(true, title = "MACD Cross Dn", group = "Alerts", inline="Alert10")
alert_Long_A  = input.bool(true, title = "MACD Cross Up & > 0", group = "Alerts", inline="Alert20")
alert_Short_B = input.bool(true, title = "MACD Cross Dn & < 0", group = "Alerts", inline="Alert20")
// Calculating
fast_ma = request.security(syminfo.tickerid, res, sma_source == "SMA" ? ta.sma(src, fast_length) : ta.ema(src, fast_length))
slow_ma = request.security(syminfo.tickerid, res, sma_source == "SMA" ? ta.sma(src, slow_length) : ta.ema(src, slow_length))
macd = fast_ma - slow_ma
signal = request.security(syminfo.tickerid, res, sma_signal == "SMA" ? ta.sma(macd, signal_length) : ta.ema(macd, signal_length))
hist = macd - signal
// MACD Trend and Cross Up/Down conditions
trend_up   = macd > signal
trend_dn   = macd < signal
cross_UP   = signal[1] >= macd[1] and signal < macd
cross_DN   = signal[1] <= macd[1] and signal > macd
cross_UP_A = (signal[1] >= macd[1] and signal < macd) and macd > 0
cross_DN_B = (signal[1] <= macd[1] and signal > macd) and macd < 0
// Condition that changes Color of MACD Line if Show Trend is turned on..
trend_col = show_trend  and trend_up ? col_trnd_Up : trend_up ? col_macd : show_trend  and trend_dn ? col_trnd_Dn: trend_dn ? col_macd : na

//Var Statements for Histogram Color Change
var bool histA_IsUp = false
var bool histA_IsDown = false
var bool histB_IsDown = false
var bool histB_IsUp = false
histA_IsUp   := hist == hist[1] ? histA_IsUp[1] : hist > hist[1] and hist > 0
histA_IsDown := hist == hist[1] ? histA_IsDown[1] : hist < hist[1] and hist > 0
histB_IsDown := hist == hist[1] ? histB_IsDown[1] : hist < hist[1] and hist <= 0
histB_IsUp   := hist == hist[1] ? histB_IsUp[1] : hist > hist[1] and hist <= 0

hist_col =  histA_IsUp ? col_grow_above : histA_IsDown ? col_fall_above : histB_IsDown ? col_grow_below : histB_IsUp ? col_fall_below :color.silver

// Plot Statements
//Background Color
bgcolor(show_cross and cross_UP ? col_trnd_Up : na, editable=false)
bgcolor(show_cross and cross_DN ? col_trnd_Dn : na, editable=false)
//Highlight Price Bars
barcolor(show_HB and trend_up ? col_trnd_Up : na, title="Trend Up", offset = 0, editable=false)
barcolor(show_HB and trend_dn ? col_trnd_Dn : na, title="Trend Dn", offset = 0, editable=false)
//Regular Plots
plot(show_Hist and hist ? hist : na, title="Histogram", style=plot.style_columns, color=color.new(hist_col ,0),linewidth=show_hist_LW)
plot(show_macd  and signal ? signal : na, title="Signal", color=color.new(col_signal, 0),  style=plot.style_line ,linewidth=show_signal_LW)
plot(show_macd  and macd ? macd : na, title="MACD", color=color.new(trend_col, 0),  style=plot.style_line ,linewidth=show_macd_LW)
hline(0, title="0 Line", color=color.new(color.gray, 0), linestyle=hline.style_dashed, linewidth=1, editable=false)
plot(show_dots and cross_UP ? macd : na, title="Dots", color=color.new(trend_col ,0), style=plot.style_circles, linewidth=show_dots_LW, editable=false)
plot(show_dots and cross_DN ? macd : na, title="Dots", color=color.new(trend_col ,0), style=plot.style_circles, linewidth=show_dots_LW, editable=false)

//Alerts
if alert_Long and cross_UP
    alert("Symbol = (" + syminfo.tickerid + ") TimeFrame = (" + timeframe.period + ") Current Price (" + str.tostring(close) + ") MACD Crosses Up.", alert.freq_once_per_bar_close)

if alert_Short and cross_DN
    alert("Symbol = (" + syminfo.tickerid + ") TimeFrame = (" + timeframe.period + ") Current Price (" + str.tostring(close) + ") MACD Crosses Down.", alert.freq_once_per_bar_close)
//Alerts - Stricter Condition - Only Alerts When MACD Crosses UP & MACD > 0 -- Crosses Down & MACD < 0
if alert_Long_A and cross_UP_A
    alert("Symbol = (" + syminfo.tickerid + ") TimeFrame = (" + timeframe.period + ") Current Price (" + str.tostring(close) + ") MACD > 0 And Crosses Up.", alert.freq_once_per_bar_close)

if alert_Short_B and cross_DN_B
    alert("Symbol = (" + syminfo.tickerid + ") TimeFrame = (" + timeframe.period + ") Current Price (" + str.tostring(close) + ") MACD < 0 And Crosses Down.", alert.freq_once_per_bar_close)

//End Code

if alert_Long_A and cross_UP_A
    strategy.entry("Enter Long", strategy.long)
else if alert_Short_B and cross_DN_B
    strategy.entry("Enter Short", strategy.short)
- Длинная краткосрочная стратегия
- Индикатор обратного движения K I
- Кроссовер скользящей средней + стратегия импульса медленной линии MACD
- Стратегия прорыва MACD BB
- Шаблон предупреждений о запуске на Луну [индикатор]
- СТРАТЕГИЯ перегрузки MACD
- Умный MACD
- Движение на основе импульса
- Динамическая стратегия DCA на основе объема
- Теория волн Эллиота 4-9 Импульсная волна Автоматическое обнаружение Стратегия торговли
- 15 мин BTCUSDTPERP BOT
- Энтропия Шеннона V2
- Супер-трейдер с задержкой остановки
- Поток объема v3
- Часовой скальпинг крипто-фьючерсов с ma & rsi - ogcheckers
- АТР сглаженный
- Поисковик блоков заказов
- TrendScalp-FractalBox-3EMA (включение)
- Сигналы QQE
- U-битная сетка фильтрации амплитуды
- ЛИНА КОГА
- 2 Определение направления движущегося среднего цвета
- Инструмент Scalping PullBack R1
- Стратегия покупки и продажи зависит от AO+Stoch+RSI+ATR
- EMA ТРЕНД НОКУД
- RedK соотношение объемно-ускоренной направленной энергии
- Дончианский прорыв без переокраски
- Красные импульсные полоски
- SuperJump Turn Back Болинджерская полоса
- Фукуицкая тенденция