Стратегия следования за трендом, сочетающая двойную EMA и RSI
Обзор
Эта стратегия использует двойные EMA и RSI, чтобы идентифицировать ценовые тенденции и вовремя войти в рынок при повороте в направлении тенденции. В частности, стратегия использует более длинные циклы EMA, чтобы определить направление тенденции, а также использует RSI, чтобы определить краткосрочные сверхпокупки и сверхпродажи.
Стратегический принцип
Используйте 200-циклическую EMA, чтобы определить направление тенденции. Вверх по линии EMA - это сигнал к повышению, вниз по линии EMA - сигнал к снижению.
Параметр RSI устанавливается на 10 циклов. В них RSI превышает 40 - это сигнал о перепродаже, а 60 - это сигнал о перекупе.
При большом тренде вверх (цены выше линии EMA), если произойдет сигнал о перепродаже под RSI, который пробивает 40, сделайте дополнительный вход.
При большом тренде в сторону снижения (цены ниже линии EMA) в случае появления на RSI сигнала сверхпокупа на уровне 60 - ввод в позицию.
Стоп-лост установлен в 4 раза выше показателя ATR. Стоп-стоп установлен в 2 раза выше показателя стоп-лоста и обеспечивает риск-возвращение соотношения 2:1.
Анализ преимуществ
Наибольшее преимущество этой стратегии заключается в том, что она сочетает в себе одновременно трендовые и обратные показатели, что позволяет вовремя войти в игру, когда происходит трендовый откат, и, следовательно, получать лучшие результаты. Конкретные преимущества:
Используя систему двойных EMA, можно определить направление основных тенденций и эффективно отслеживать тенденции цен.
Индекс RSI позволяет определить, когда стоит начать торговлю, и определить, когда в ближайшее время может произойти перекуп или перепродажа.
Стоп-убыток устанавливается с помощью показателя ATR, который может быть скорректирован в зависимости от волатильности рынка, что способствует контролю риска.
Строгое соблюдение принципов трендового трейдинга позволяет сократить ненужные сделки и снизить системный риск.
Анализ рисков
Основные риски этой стратегии:
В процессе ослабления трендовых колебаний может возникнуть ошибочный торговый сигнал.
В экстремальных ситуациях, установленный ATR показатель может быть слишком большим или слишком маленьким, требуя динамической корректировки. Также можно рассмотреть возможность замены другим способом остановки.
Торговые сигналы могут генерироваться с более высокой частотой, поэтому следует следить за тем, чтобы они соответствовали вашим предпочтениям по частоте торгов.
Необходимо обратить внимание на то, правильно ли настроены параметры RSI, при необходимости их следует оптимизировать.
Направление оптимизации
Основные направления оптимизации стратегии:
Дополнительные индикаторы тренда, такие как MACD, могут быть протестированы, чтобы помочь определить направление тренда.
Можно тестировать другие инверсионные индикаторы, такие как KDJ, Брин-бейнд и т. д. в сочетании с RSI, в поисках лучших торговых сигналов.
Можно внедрить алгоритмы машинного обучения, чтобы реализовать динамические остановки и остановки с помощью адаптивной коррекции параметров.
В результате, в системе может быть создано более устойчивое общее состояние, которое может быть оценено с помощью эмоциональных показателей, новостных сообщений и т.д.
Подвести итог
В целом, эта стратегия является очень типичной короткой линией стратегии, которая сочетает в себе отслеживание тенденции и обратный индикатор. Используя двойную ЭМА, чтобы определить большую тенденцию, а также использовать обратную характеристику RSI, чтобы захватить возможность Pullback в тренде. В принципе, эта стратегия объединяет преимущества различных индикаторов вместе, и FORM хорошо взаимодополняет.
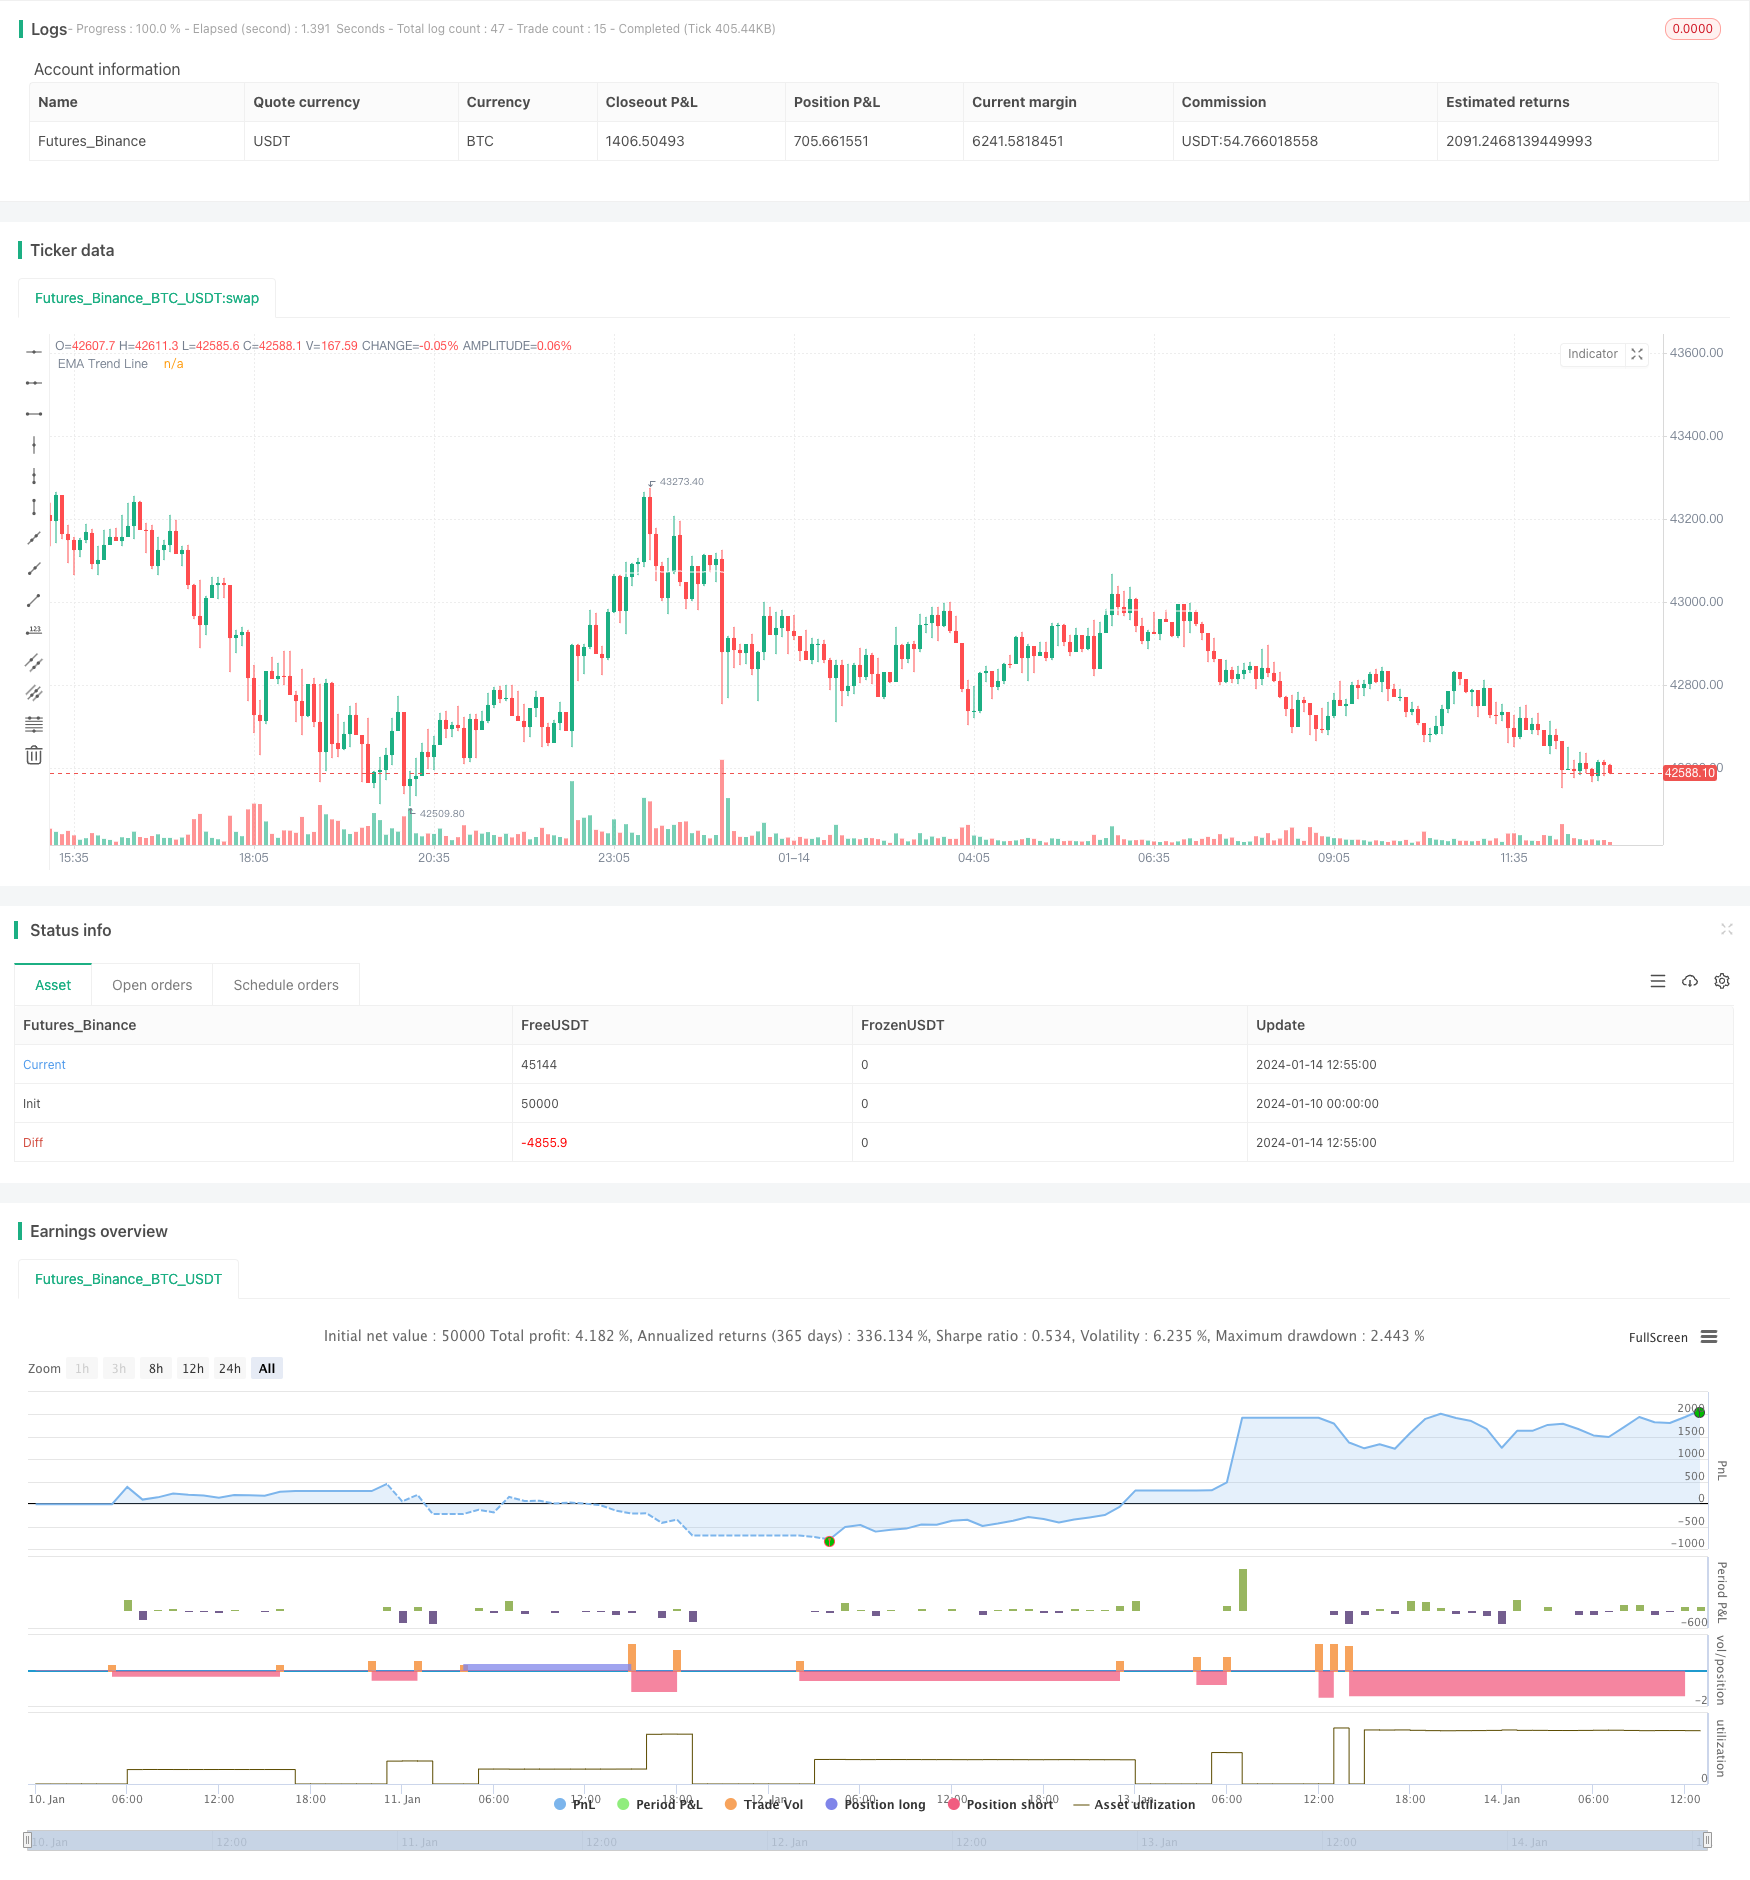
/*backtest
start: 2024-01-10 00:00:00
end: 2024-01-14 13:00:00
period: 5m
basePeriod: 1m
exchanges: [{"eid":"Futures_Binance","currency":"BTC_USDT"}]
*/

// This source code is subject to the terms of the Mozilla Public License 2.0 at https://mozilla.org/MPL/2.0/
// © kevinmck100

// @description
// This strategy is intended to be used as a base template for building new strategies.
//
// It incorporates the following features:
//
//      - Risk management:  Configurable X% loss per stop loss
//                          Configurable R:R ratio
//
//      - Trade entry:      Calculated position size based on risk tolerance
//
//      - Trade exit:       Stop Loss currently configurable ATR multiplier but can be replaced based on strategy
//                          Take Profit calculated from Stop Loss using R:R ratio
//
//      - Backtesting:      Configurable backtesting range by date
//
//      - Trade drawings:   TP/SL boxes drawn for all trades. Can be turned on and off
//                          Trade exit information labels. Can be turned on and off
//                          NOTE: Trade drawings will only be applicable when using overlay strategies
//
//      - Debugging:        Includes section with useful debugging techniques
//
// Strategy conditions:
//
//      - Trade entry:      LONG:   C1: Price is above EMA line
//                                  C2: RSI is crossing out of oversold area
//                          SHORT:  C1: Price is below EMA line
//                                  C2: RSI is crossing out of overbought area
//
//      - Trade exit:       Stop Loss:      Stop Loss ATR multiplier is hit
//                          Take Profit:    R:R multiplier * Stop Loss is hit
//
// The idea is to use RSI to catch pullbacks within the main trend. Note that
// this strategy is intended to be a simple base strategy for building upon.
// It was not designed to be traded in its current form.

//@version=5
INITIAL_CAPITAL = 1000
DEFAULT_COMMISSION = 0.02
MAX_DRAWINGS = 500
IS_OVERLAY = true

strategy("Risk Management Strategy Template", "Strategy Template", overlay = IS_OVERLAY, initial_capital = INITIAL_CAPITAL, currency = currency.NONE, max_labels_count = MAX_DRAWINGS, max_boxes_count = MAX_DRAWINGS, max_lines_count = MAX_DRAWINGS, default_qty_type = strategy.cash, commission_type = strategy.commission.percent, commission_value = DEFAULT_COMMISSION)

// =============================================================================
// INPUTS
// =============================================================================

// ------------------------ Replacable section - Start -------------------------
// ------------------
// Indicator Settings
// ------------------
emaLength           = input.int (200,   "EMA Length          ",             group = "Indicators: Settings",         inline = "IS1", minval = 1,                 tooltip = "EMA line to identify trend direction. Above EMA trend line is bullish. Below EMA trend line is bearish")
rsiLength           = input.int (10,    "RSI Length            ",           group = "Indicators: Settings",         inline = "IS2", minval = 1)

// ----------------------
// Trade Entry Conditions
// ----------------------
rsiOverbought       = input.int (60,    "RSI Overbought        ",           group = "Strategy: Conditions",         inline = "SC1", minval = 50, maxval = 100,  tooltip = "RSI overbought level used to identify pullbacks within the main trend. RSI crossing BELOW this level triggers a SHORT when in a DOWN trend")
rsiOversold         = input.int (40,    "RSI Oversold          ",           group = "Strategy: Conditions",         inline = "SC2", minval = 0,  maxval = 50,   tooltip = "RSI overbought level used to identify pullbacks within the main trend. RSI crossing ABOVE this level triggers a LONG when in an UP trend")

// ---------------------
// Trade Exit Conditions
// ---------------------
atrLength           = input.int  (14,   "Stop Loss ATR Length      ",       group = "Strategy: Exit Conditions",    inline = "EC1", minval = 0,                 tooltip = "Length of ATR used to calculate Stop Loss.")
slAtrMultiplier     = input.float(4,    "Stop Loss ATR Multiplier     ",    group = "Strategy: Exit Conditions",    inline = "EC2", minval = 0, step = 0.1,     tooltip = "Size of StopLoss is determined by multiplication of ATR value. Take Profit is derived from this also by multiplying the StopLoss value by the Risk:Reward multiplier.")
// ------------------------- Replacable section - End --------------------------

// ---------------
// Risk Management
// ---------------
riskReward          = input.float(2,    "Risk : Reward        1 :",         group = "Strategy: Risk Management",    inline = "RM1", minval = 0, step = 0.1,     tooltip = "Previous high or low (long/short dependant) is used to determine TP level. 'Risk : Reward' ratio is then used to calculate SL based of previous high/low level.\n\nIn short, the higher the R:R ratio, the smaller the SL since TP target is fixed by previous high/low price data.")
accountRiskPercent  = input.float(1,    "Portfolio Risk %         ",        group = "Strategy: Risk Management",    inline = "RM1", minval = 0, step = 0.1,     tooltip = "Percentage of portfolio you lose if trade hits SL.\n\nYou then stand to gain\n  Portfolio Risk % * Risk : Reward\nif trade hits TP.")

// ----------
// Date Range
// ----------
startYear           = input.int (2022,  "Start Date       ",                group = 'Strategy: Date Range',         inline = 'DR1', minval    = 1900, maxval = 2100)
startMonth          = input.int (1,     "",                                 group = 'Strategy: Date Range',         inline = 'DR1', options   = [1, 2, 3, 4, 5, 6, 7, 8, 9, 10, 11, 12])
startDate           = input.int (1,     "",                                 group = 'Strategy: Date Range',         inline = 'DR1', options   = [1, 2, 3, 4, 5, 6, 7, 8, 9, 10, 11, 12, 13, 14, 15, 16, 17, 18, 19, 20, 21, 22, 23, 24, 25, 26, 27, 28, 29, 30, 31])
endYear             = input.int (2100,  "End Date      ",                   group = 'Strategy: Date Range',         inline = 'DR2', minval    = 1900, maxval = 2100)
endMonth            = input.int (1,     "",                                 group = 'Strategy: Date Range',         inline = 'DR2', options   = [1, 2, 3, 4, 5, 6, 7, 8, 9, 10, 11, 12])
endDate             = input.int (1,     "",                                 group = 'Strategy: Date Range',         inline = 'DR2', options   = [1, 2, 3, 4, 5, 6, 7, 8, 9, 10, 11, 12, 13, 14, 15, 16, 17, 18, 19, 20, 21, 22, 23, 24, 25, 26, 27, 28, 29, 30, 31])

// ----------------
// Drawing Settings
// ----------------
showTpSlBoxes       = input.bool(false,  "Show TP / SL Boxes",               group = "Strategy: Drawings",           inline = "D1",  tooltip = "Show or hide TP and SL position boxes.\n\nNote: TradingView limits the maximum number of boxes that can be displayed to 500 so they may not appear for all price data under test.")
showLabels          = input.bool(false, "Show Trade Exit Labels",           group = "Strategy: Drawings",           inline = "D2",  tooltip = "Useful labels to identify Profit/Loss and cumulative portfolio capital after each trade closes.\n\nAlso note that TradingView limits the max number of 'boxes' that can be displayed on a chart (max 500). This means when you lookback far enough on the chart you will not see the TP/SL boxes. However you can check this option to identify where trades exited.")

// =============================================================================
// INDICATORS
// =============================================================================

// ------------------------ Replacable section - Start -------------------------
// ---
// EMA
// ---
ema = ta.ema(close, emaLength)
plot(ema, "EMA Trend Line", color.white)

// ---
// RSI
// ---
rsi = ta.rsi(close, rsiLength)
// ------------------------- Replacable section - End --------------------------


// =============================================================================
// STRATEGY LOGIC
// =============================================================================

// ---------
// FUNCTIONS
// ---------

percentAsPoints(pcnt) =>
    math.round(pcnt / 100 * close / syminfo.mintick)

calcStopLossPrice(pointsOffset, isLong) =>
    priceOffset = pointsOffset * syminfo.mintick
    if isLong
        close - priceOffset
    else
        close + priceOffset

calcProfitTrgtPrice(pointsOffset, isLong) =>
    calcStopLossPrice(-pointsOffset, isLong)


printLabel(barIndex, msg) => label.new(barIndex, close, msg)

printTpSlHitBox(left, right, slHit, tpHit, entryPrice, slPrice, tpPrice) =>
    if showTpSlBoxes
        box.new (left = left,   top = entryPrice,   right = right,  bottom = slPrice,   bgcolor = slHit ? color.new(color.red, 60)   : color.new(color.gray, 90), border_width = 0)
        box.new (left = left,   top = entryPrice,   right = right,  bottom = tpPrice,   bgcolor = tpHit ? color.new(color.green, 60) : color.new(color.gray, 90), border_width = 0)
        line.new(x1 = left,     y1 = entryPrice,    x2 = right,     y2 = entryPrice,    color = color.new(color.yellow, 20))
        line.new(x1 = left,     y1 = slPrice,       x2 = right,     y2 = slPrice,       color = color.new(color.red, 20))
        line.new(x1 = left,     y1 = tpPrice,       x2 = right,     y2 = tpPrice,       color = color.new(color.green, 20))

printTpSlNotHitBox(left, right, entryPrice, slPrice, tpPrice) =>
    if showTpSlBoxes
        box.new (left = left,   top = entryPrice,   right = right,  bottom = slPrice,   bgcolor = color.new(color.gray, 90), border_width = 0)
        box.new (left = left,   top = entryPrice,   right = right,  bottom = tpPrice,   bgcolor = color.new(color.gray, 90), border_width = 0)
        line.new(x1 = left,     y1 = entryPrice,    x2 = right,     y2 = entryPrice,    color = color.new(color.yellow, 20))
        line.new(x1 = left,     y1 = slPrice,       x2 = right,     y2 = slPrice,       color = color.new(color.red, 20))
        line.new(x1 = left,     y1 = tpPrice,       x2 = right,     y2 = tpPrice,       color = color.new(color.green, 20))

printTradeExitLabel(x, y, posSize, entryPrice, pnl) =>
    if showLabels
        labelStr = "Position Size: " + str.tostring(math.abs(posSize), "#.##") + "\nPNL: " + str.tostring(pnl, "#.##") + "\nCapital: " + str.tostring(strategy.equity, "#.##") + "\nEntry Price: " + str.tostring(entryPrice, "#.##")
        label.new(x = x, y = y, text = labelStr, color = pnl > 0 ? color.new(color.green, 60) : color.new(color.red, 60), textcolor = color.white, style = label.style_label_down)

// ----------
// CONDITIONS
// ----------

inDateRange         = time >= timestamp(syminfo.timezone, startYear, startMonth, startDate, 0, 0) and time < timestamp(syminfo.timezone, endYear, endMonth, endDate, 0, 0)

// ------------------------ Replacable section - Start -------------------------
// Condition 1: Price above EMA indicates bullish trend, price below EMA indicates bearish trend
bullEma             = close > ema
bearEma             = close < ema

// Condition 2: RSI crossing back from overbought/oversold indicates pullback within trend
bullRsi             = ta.crossover  (rsi, rsiOversold)
bearRsi             = ta.crossunder (rsi, rsiOverbought)

// Combine all entry conditions
goLong              = inDateRange and bullEma and bullRsi
goShort             = inDateRange and bearEma and bearRsi
// ------------------------- Replacable section - End --------------------------

// Trade entry and exit variables
var tradeEntryBar   = bar_index
var profitPoints    = 0.
var lossPoints      = 0.
var slPrice         = 0.
var tpPrice         = 0.
var inLong          = false
var inShort         = false

// Entry decisions
openLong            = (goLong and not inLong)
openShort           = (goShort and not inShort)
flippingSides       = (goLong and inShort) or (goShort and inLong)
enteringTrade       = openLong or openShort
inTrade             = inLong or inShort

// ------------------------ Replacable section - Start -------------------------
// Exit calculations
atr                 = ta.atr(atrLength)
slAmount            = atr * slAtrMultiplier
slPercent           = math.abs((1 - (close - slAmount) / close) * 100)
tpPercent           = slPercent * riskReward
// ------------------------- Replacable section - End --------------------------

// Risk calculations
riskAmt             = strategy.equity * accountRiskPercent / 100
entryQty            = math.abs(riskAmt / slPercent * 100)  / close

if openLong
    if strategy.position_size < 0
        printTpSlNotHitBox(tradeEntryBar + 1, bar_index + 1, strategy.position_avg_price, slPrice, tpPrice)
        printTradeExitLabel(bar_index + 1, math.max(tpPrice, slPrice), strategy.position_size, strategy.position_avg_price, strategy.openprofit)
    strategy.entry("Long", strategy.long, qty = entryQty, alert_message = "Long Entry")
    enteringTrade   := true
    inLong          := true
    inShort         := false

if openShort
    if strategy.position_size > 0
        printTpSlNotHitBox(tradeEntryBar + 1, bar_index + 1, strategy.position_avg_price, slPrice, tpPrice)
        printTradeExitLabel(bar_index + 1, math.max(tpPrice, slPrice), strategy.position_size, strategy.position_avg_price, strategy.openprofit)
    strategy.entry("Short", strategy.short, qty = entryQty, alert_message = "Short Entry")
    enteringTrade   := true
    inShort         := true
    inLong          := false

if enteringTrade
    profitPoints    := percentAsPoints(tpPercent)
    lossPoints      := percentAsPoints(slPercent)
    slPrice         := calcStopLossPrice(lossPoints, openLong)
    tpPrice         := calcProfitTrgtPrice(profitPoints, openLong)
    tradeEntryBar   := bar_index

strategy.exit("TP/SL", profit = profitPoints, loss = lossPoints, comment_profit = "TP Hit", comment_loss = "SL Hit", alert_profit = "TP Hit Alert", alert_loss = "SL Hit Alert")

// =============================================================================
// DRAWINGS
// =============================================================================

// -----------
// TP/SL Boxes
// -----------

slHit           = (inShort and high >= slPrice) or (inLong  and low <= slPrice)
tpHit           = (inLong  and high >= tpPrice) or (inShort and low <= tpPrice)
exitTriggered   = slHit or tpHit
entryPrice      = strategy.closedtrades.entry_price (strategy.closedtrades - 1)
pnl             = strategy.closedtrades.profit      (strategy.closedtrades - 1)
posSize         = strategy.closedtrades.size        (strategy.closedtrades - 1)

// Print boxes for trades closed at profit or loss
if (inTrade and exitTriggered)
    inShort    := false
    inLong     := false
    printTpSlHitBox(tradeEntryBar + 1, bar_index, slHit, tpHit, entryPrice, slPrice, tpPrice)
    printTradeExitLabel(bar_index, math.max(tpPrice, slPrice), posSize, entryPrice, pnl)

// Print TP/SL box for current open trade
if barstate.islastconfirmedhistory and strategy.position_size != 0
    printTpSlNotHitBox(tradeEntryBar + 1, bar_index + 1, strategy.position_avg_price, slPrice, tpPrice)

// =============================================================================
// DEBUGGING
// =============================================================================

// Data window plots
plotchar(slPrice,    "Stop Loss Price",     "")
plotchar(tpPrice,    "Take Profit Price",   "")

// Label plots
plotDebugLabels = false
if plotDebugLabels
    if bar_index == tradeEntryBar
        printLabel(bar_index, "Position size: " + str.tostring(entryQty * close, "#.##"))