Индикатор RSI стратегия торговли с разделением длинных и коротких интервалов

Обзор
Эта стратегия использует RSI, чтобы определить, что происходит, и принять решение о сделке. Ее основная идея заключается в том, что когда цена имеет новый низкий уровень, но RSI имеет новый высокий уровень, она создает многоголовый разрывный сигнал, показывающий, что дно уже сформировано, и делает больше; когда цена имеет новый высокий уровень, но RSI имеет новый низкий уровень, она создает разрывный сигнал, показывающий, что вершина уже сформирована, и делает пустоту.
Стратегический принцип
Эта стратегия использует RSI, чтобы определить многомерное разделение между ценой и RSI.
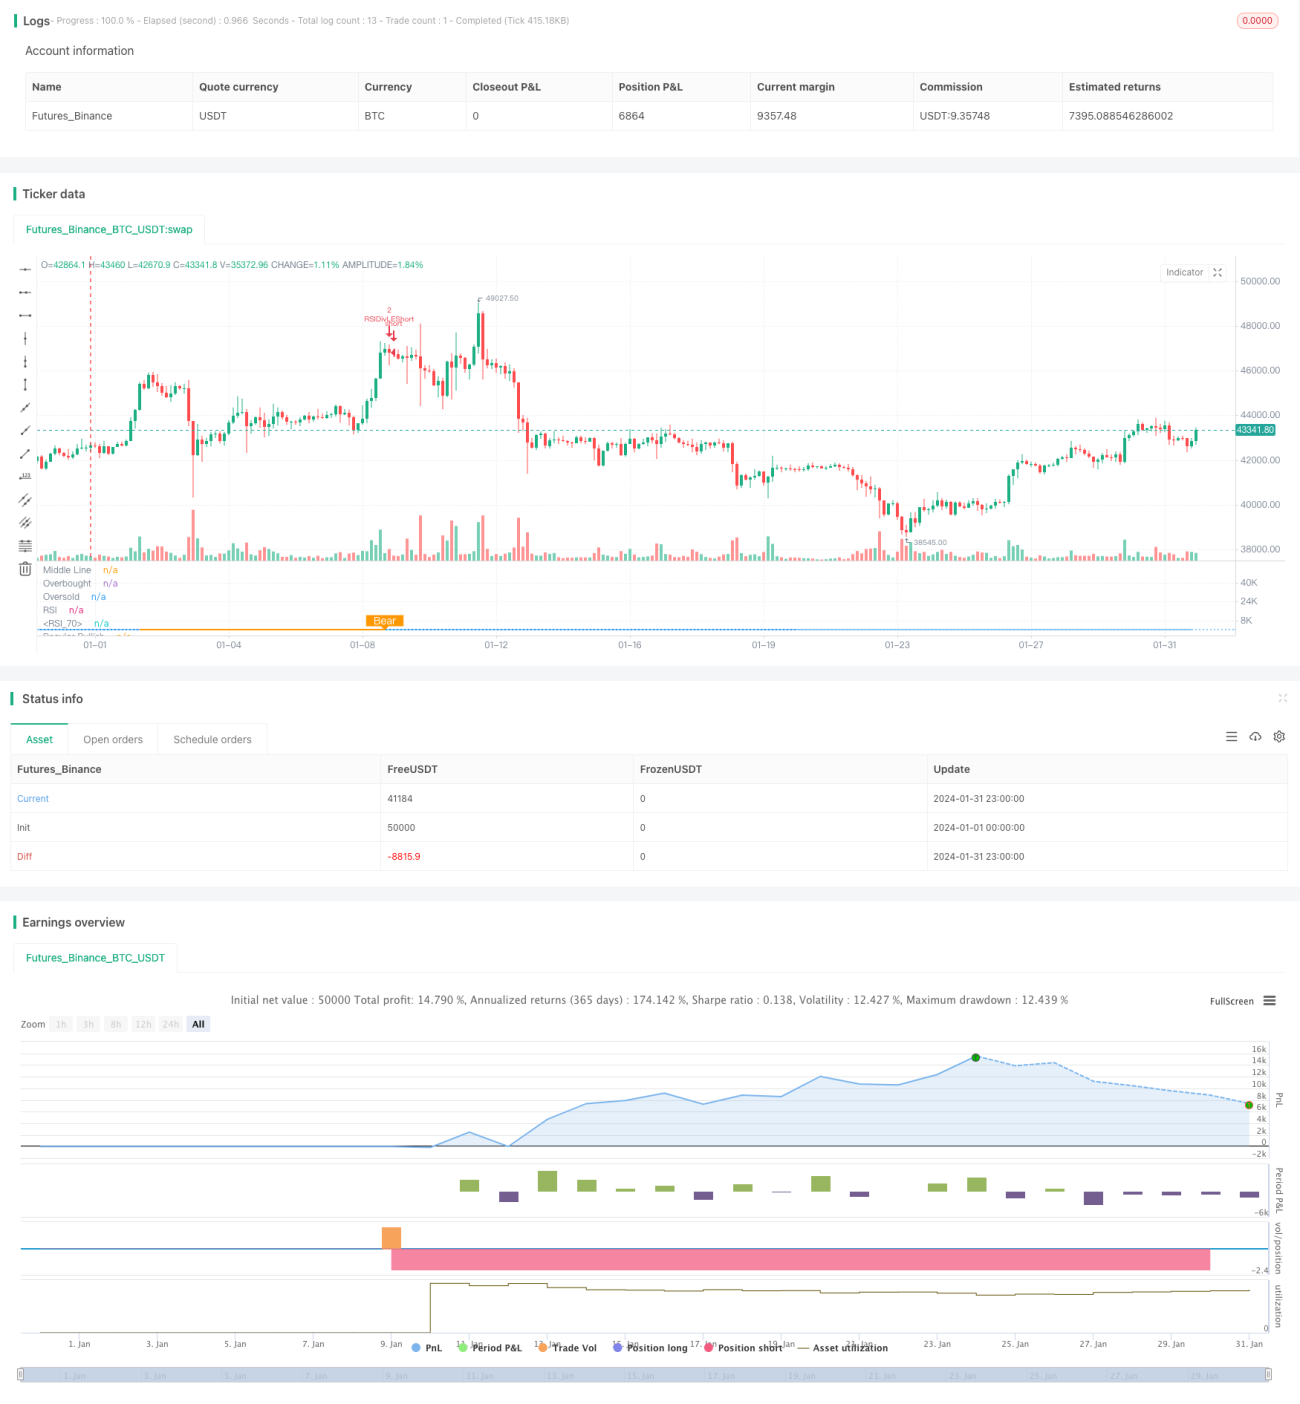
- Используйте RSI с параметром 13, исходные данные - цена закрытия
- Определенный диапазон левого и правого отклонений для многоголосной разделения составляет 14 дней и 2 дня
- Определенный диапазон лево- и право-отклонения для разделения головы составляет 47 дней и 1 день
- Когда цена достигает более низкого минимума, но RSI достигает более высокого минимума, удовлетворяя условию многоголовной разделения, генерируется многоголовый сигнал
- Когда цена достигает более высокого максимума, но RSI достигает более низкого максимума, удовлетворяя условию разделения, создается сигнал дефолта
Признание многомерного разделения между ценой и RSI позволяет заранее определить переломные моменты в ценовом движении и принять соответствующие торговые решения.
Стратегические преимущества
Основные преимущества этой стратегии:
- Выявление многомерного разрыва между ценой и RSI позволяет заранее определить переломные моменты в ценовых тенденциях и использовать торговые возможности
- Поскольку используется индикаторный анализ, он не подвержен субъективным эмоциям.
- Использование фиксированного регрессивного интервала для выявления отклонений, чтобы избежать частого перенаправления
- В сочетании с дополнительными условиями, такими как RSI, можно уменьшить вероятность ошибочных сделок
Риски и решения
Однако эта стратегия несет в себе определенные риски:
-
Отступление от RSI не обязательно предвещает немедленный обратный курс, может быть временная разница, что может привести к риску, что будет вызван стоп-убыток. Решение - это соответствующее ослабление стоп-убытков, чтобы дать цене достаточно времени, чтобы подтвердить разрывные сигналы.
-
Продолжительное пребывание в состоянии разделения также увеличивает риск. Решение заключается в сочетании более длительного дня или круговой RSI в качестве фильтрующего условия.
-
Слишком небольшое разделение также не позволяет подтвердить обратный тренд, требуя надлежащего увеличения интервала обратного отсчета для поиска более заметного разделения RSI.
Направление оптимизации стратегии
Эта стратегия также может быть оптимизирована в следующих направлениях:
-
Оптимизируйте RSI, чтобы найти оптимальную комбинацию параметров
-
Попробуйте другие технические показатели, такие как MACD, KD и т. д., чтобы идентифицировать многопространственное разделение
-
Добавление соответствующих фильтров в период шока, чтобы избежать увеличения числа ошибочных сделок в период шока
-
Поиск оптимального комбинированного сигнала в сочетании с RSI с большим количеством периодов времени
Подвести итог
Стратегия RSI многопрофильного разделения является эффективной количественной стратегией торговли. С помощью RSI многопрофильного разделения можно определить переломные моменты в ценовом движении, чтобы создать торговый сигнал. Эта стратегия проста в использовании, и вы можете улучшить вероятность получения прибыли, оптимизировав параметры и добавляя условия фильтрации.
- 1