سوئنگ ہائٹس/لوز اور موم بتی پیٹرن
مصنف:چاؤ ژانگ، تاریخ: 2022-05-07 21:12:40ٹیگز:صعودینشیبی
یہ اسکرپٹ سوئنگ ہائیز اور سوئنگ لوز کے ساتھ ساتھ موم بتی کے پیٹرن کو بھی نشان زد کرتا ہے۔ اسکرپٹ مندرجہ ذیل 6 موم بتی کے پیٹرن کا پتہ لگاسکتا ہے: ہتھوڑا ، الٹا ہتھوڑا ، بولش نگلفنگ ، ہینگ مین ، فٹنگ اسٹار ، اور bearish نگلفنگ۔
HH، HL، LH، اور LL کے اشارے آپ کو لیبل پر دیکھ سکتے ہیں مندرجہ ذیل طور پر بیان کیا جاتا ہے:
HH: اعلی اعلی HL: اعلی کم ایل ایچ: نچلے اعلی LL: کم کم
ترتیب
لمبائی: سوئنگ اعلی / کم کا پتہ لگانے کی حساسیت ، جس میں کم اقدار مختصر مدت کی قیمت میں تبدیلیوں کی زیادہ سے زیادہ / کم سے کم واپسی کرتی ہیں۔
استعمال اور تفصیلات
یہ دیکھنا دلچسپ ہوسکتا ہے کہ آیا اوپر یا نیچے ایک مخصوص موم بتی کے نمونہ سے وابستہ ہے ، اس سے ہمیں اس طرح کے نمونہ کی واپسی کی نشاندہی کرنے کی صلاحیت کا مطالعہ کرنے کی اجازت ملتی ہے۔ آپ اس کے بارے میں مزید تفصیلات دیکھنے کے لئے مخصوص نمونہ والے لیبل پر سوار ہوسکتے ہیں۔
نوٹ کریں کہ لیبل آفسیٹ ہیں، اور بعد میں حقیقی وقت میں ظاہر ہوں گے، اس طرح اس اشارے کو حقیقی وقت میں سب سے اوپر / سب سے نیچے کا پتہ لگانے کے لئے نہیں ہے.
لمبائی کی اعلی اقدار غلطیوں کو واپس کر سکتے ہیں.
بیک ٹسٹ
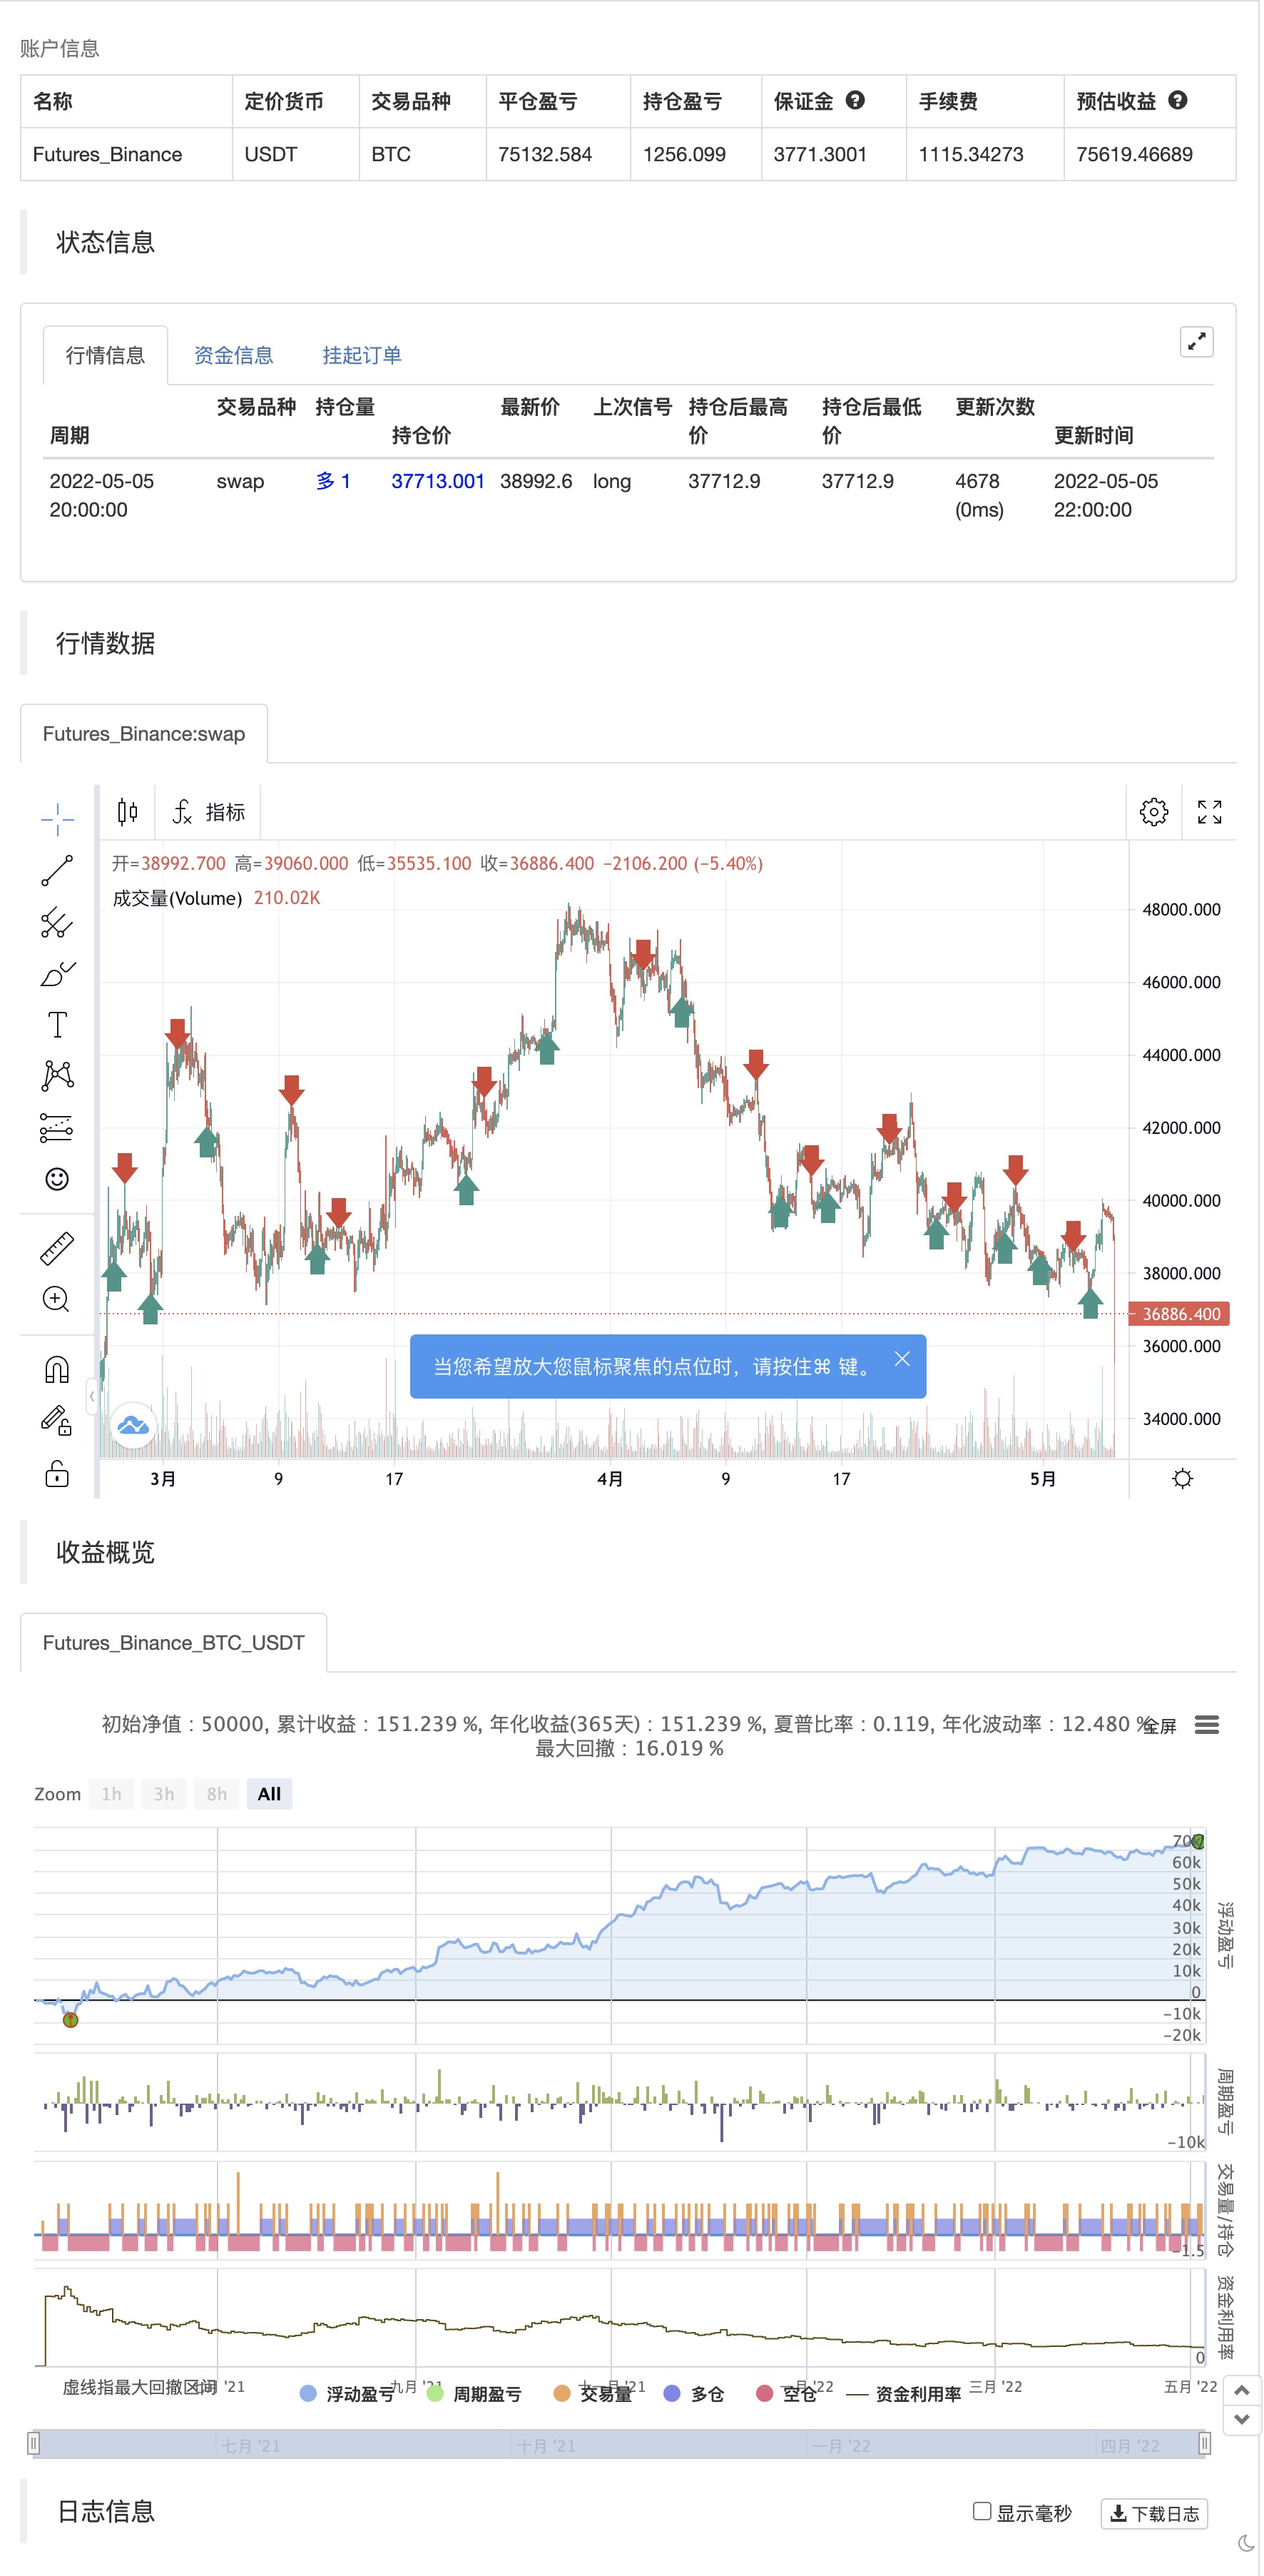
/*backtest
start: 2021-05-06 00:00:00
end: 2022-05-05 23:59:00
period: 2h
basePeriod: 15m
exchanges: [{"eid":"Futures_Binance","currency":"BTC_USDT"}]
*/

// This work is licensed under a Attribution-NonCommercial-ShareAlike 4.0 International (CC BY-NC-SA 4.0) https://creativecommons.org/licenses/by-nc-sa/4.0/
// © LuxAlgo

//@version=4
study("Swing Highs/Lows & Candle Patterns",overlay=true)
length = input(21)
//------------------------------------------------------------------------------
o = open[length],h = high[length]
l = low[length],c = close[length]
//------------------------------------------------------------------------------
ph = pivothigh(close,length,length)
pl = pivotlow(open,length,length)
valH = valuewhen(ph,c,0)
valL = valuewhen(pl,c,0)
valpH = valuewhen(ph,c,1)
valpL = valuewhen(pl,c,1)
//------------------------------------------------------------------------------
d = abs(c - o)
hammer = pl and min(o,c) - l > d and h - max(c,o) < d
ihammer = pl and h - max(c,o) > d and min(c,o) - l < d
bulleng = c > o and c[1] < o[1] and c > o[1] and o < c[1]
hanging = ph and min(c,o) - l > d and h - max(o,c) < d
shooting = ph and h - max(o,c) > d and min(c,o) - l < d
beareng = c > o and c[1] < o[1] and c > o[1] and o < c[1]
//------------------------------------------------------------------------------
//Descriptions
//------------------------------------------------------------------------------
hammer_ = "The hammer candlestick pattern is formed of a short body with a long lower wick, and is found at the bottom of a downward trend."
  + "\n" + "\n A hammer shows that although there were selling pressures during the day, ultimately a strong buying pressure drove the price back up."
ihammer_ = "The inverted hammer is a similar pattern than the hammer pattern. The only difference being that the upper wick is long, while the lower wick is short."
  + "\n" + "\n It indicates a buying pressure, followed by a selling pressure that was not strong enough to drive the market price down. The inverse hammer suggests that buyers will soon have control of the market."
bulleng_ = "The bullish engulfing pattern is formed of two candlesticks. The first candle is a short red body that is completely engulfed by a larger green candle"
  + "\n" + "\n Though the second day opens lower than the first, the bullish market pushes the price up, culminating in an obvious win for buyers"
hanging_ = "The hanging man is the bearish equivalent of a hammer; it has the same shape but forms at the end of an uptrend."
  + "\n" + "It indicates that there was a significant sell-off during the day, but that buyers were able to push the price up again. The large sell-off is often seen as an indication that the bulls are losing control of the market."
shotting_ = "The shooting star is the same shape as the inverted hammer, but is formed in an uptrend: it has a small lower body, and a long upper wick."
  + "\n" + "Usually, the market will gap slightly higher on opening and rally to an intra-day high before closing at a price just above the open – like a star falling to the ground."
beareng_ = "A bearish engulfing pattern occurs at the end of an uptrend. The first candle has a small green body that is engulfed by a subsequent long red candle."
  + "\n" + "It signifies a peak or slowdown of price movement, and is a sign of an impending market downturn. The lower the second candle goes, the more significant the trend is likely to be."
//------------------------------------------------------------------------------
n = bar_index
label lbl = na
H = valH > valpH ? "HH" : valH < valpH ? "LH" : na
L = valL < valpL ? "LL" : valL > valpL ? "HL" : na
txt = hammer ? "Hammer" : ihammer ? "Inverse Hammer" :
  bulleng ? "Bullish Engulfing" : hanging ? "Hanging Man" :
  shooting ? "Shooting Star" : beareng ? "Bearish Engulfing" : "None"
des = hammer ? hammer_ : ihammer ? ihammer_ :
  bulleng ? bulleng_ : hanging ? hanging_ :
  shooting ? shotting_ : beareng ? beareng_ : ""

//------------------------------------------------------------------------------
if ph
    strategy.entry("Enter Long", strategy.long)
else if pl
    strategy.entry("Enter Short", strategy.short)
- ٹوٹا ہوا فریکٹل: کسی کا ٹوٹا ہوا خواب آپ کا منافع ہے!
- ZigZag PA حکمت عملی V4.1
- ڈیمارک سیٹ اپ اشارے
- چمکتی ہوئی موم بتیاں
- سپورٹ- مزاحمت توڑ
- MTF RSI & STOCH حکمت عملی
- جے ایم اے + ڈبلیو ایم اے کثیر اناج کے ذریعہ
- حرکت پذیر اوسط رنگین EMA/SMA
- متعدد ٹائم فریم ٹریڈنگ
- zdmre کی طرف سے RSI
- MAGIC MACD
- سگنل کے ساتھ Z اسکور
- زینون آسان اتار چڑھاؤ کی حکمت عملی پائن زبان ورژن
- 3EMA + بولنگر + PIVOT
- کثیر اناج کی طرف سے بیگیٹ
- میل مشین
- K کے الٹ اشارے I
- چمکتی ہوئی موم بتیاں
- ایم اے شہنشاہ انسلیکوٹ
- ڈیمارک کے الٹ پوائنٹس
- ٹی ایم اے اوورلے
- ایم اے سی ڈی + ایس ایم اے 200 حکمت عملی
- سی ایم سلنگ شاٹ سسٹم
- بولنگر + آر ایس آئی، ڈبل حکمت عملی v1.1
- بولنگر بینڈ کی حکمت عملی
- بہتر ٹرینڈ ٹریکر
- پائن اسکرپٹ کی حکمت عملیوں میں ماہانہ واپسی
- v4 کے لئے ADX اور DI
- میک ڈی اپنی مرضی کے مطابق اشارے-متعدد ٹائم فریم + تمام دستیاب اختیارات!
- اشارے: WaveTrend Oscillator