اسٹاک سپر ٹرڈ ATR 200MA
مصنف:چاؤ ژانگ، تاریخ: 2022-05-10 10:53:25ٹیگز:ای ایم اے
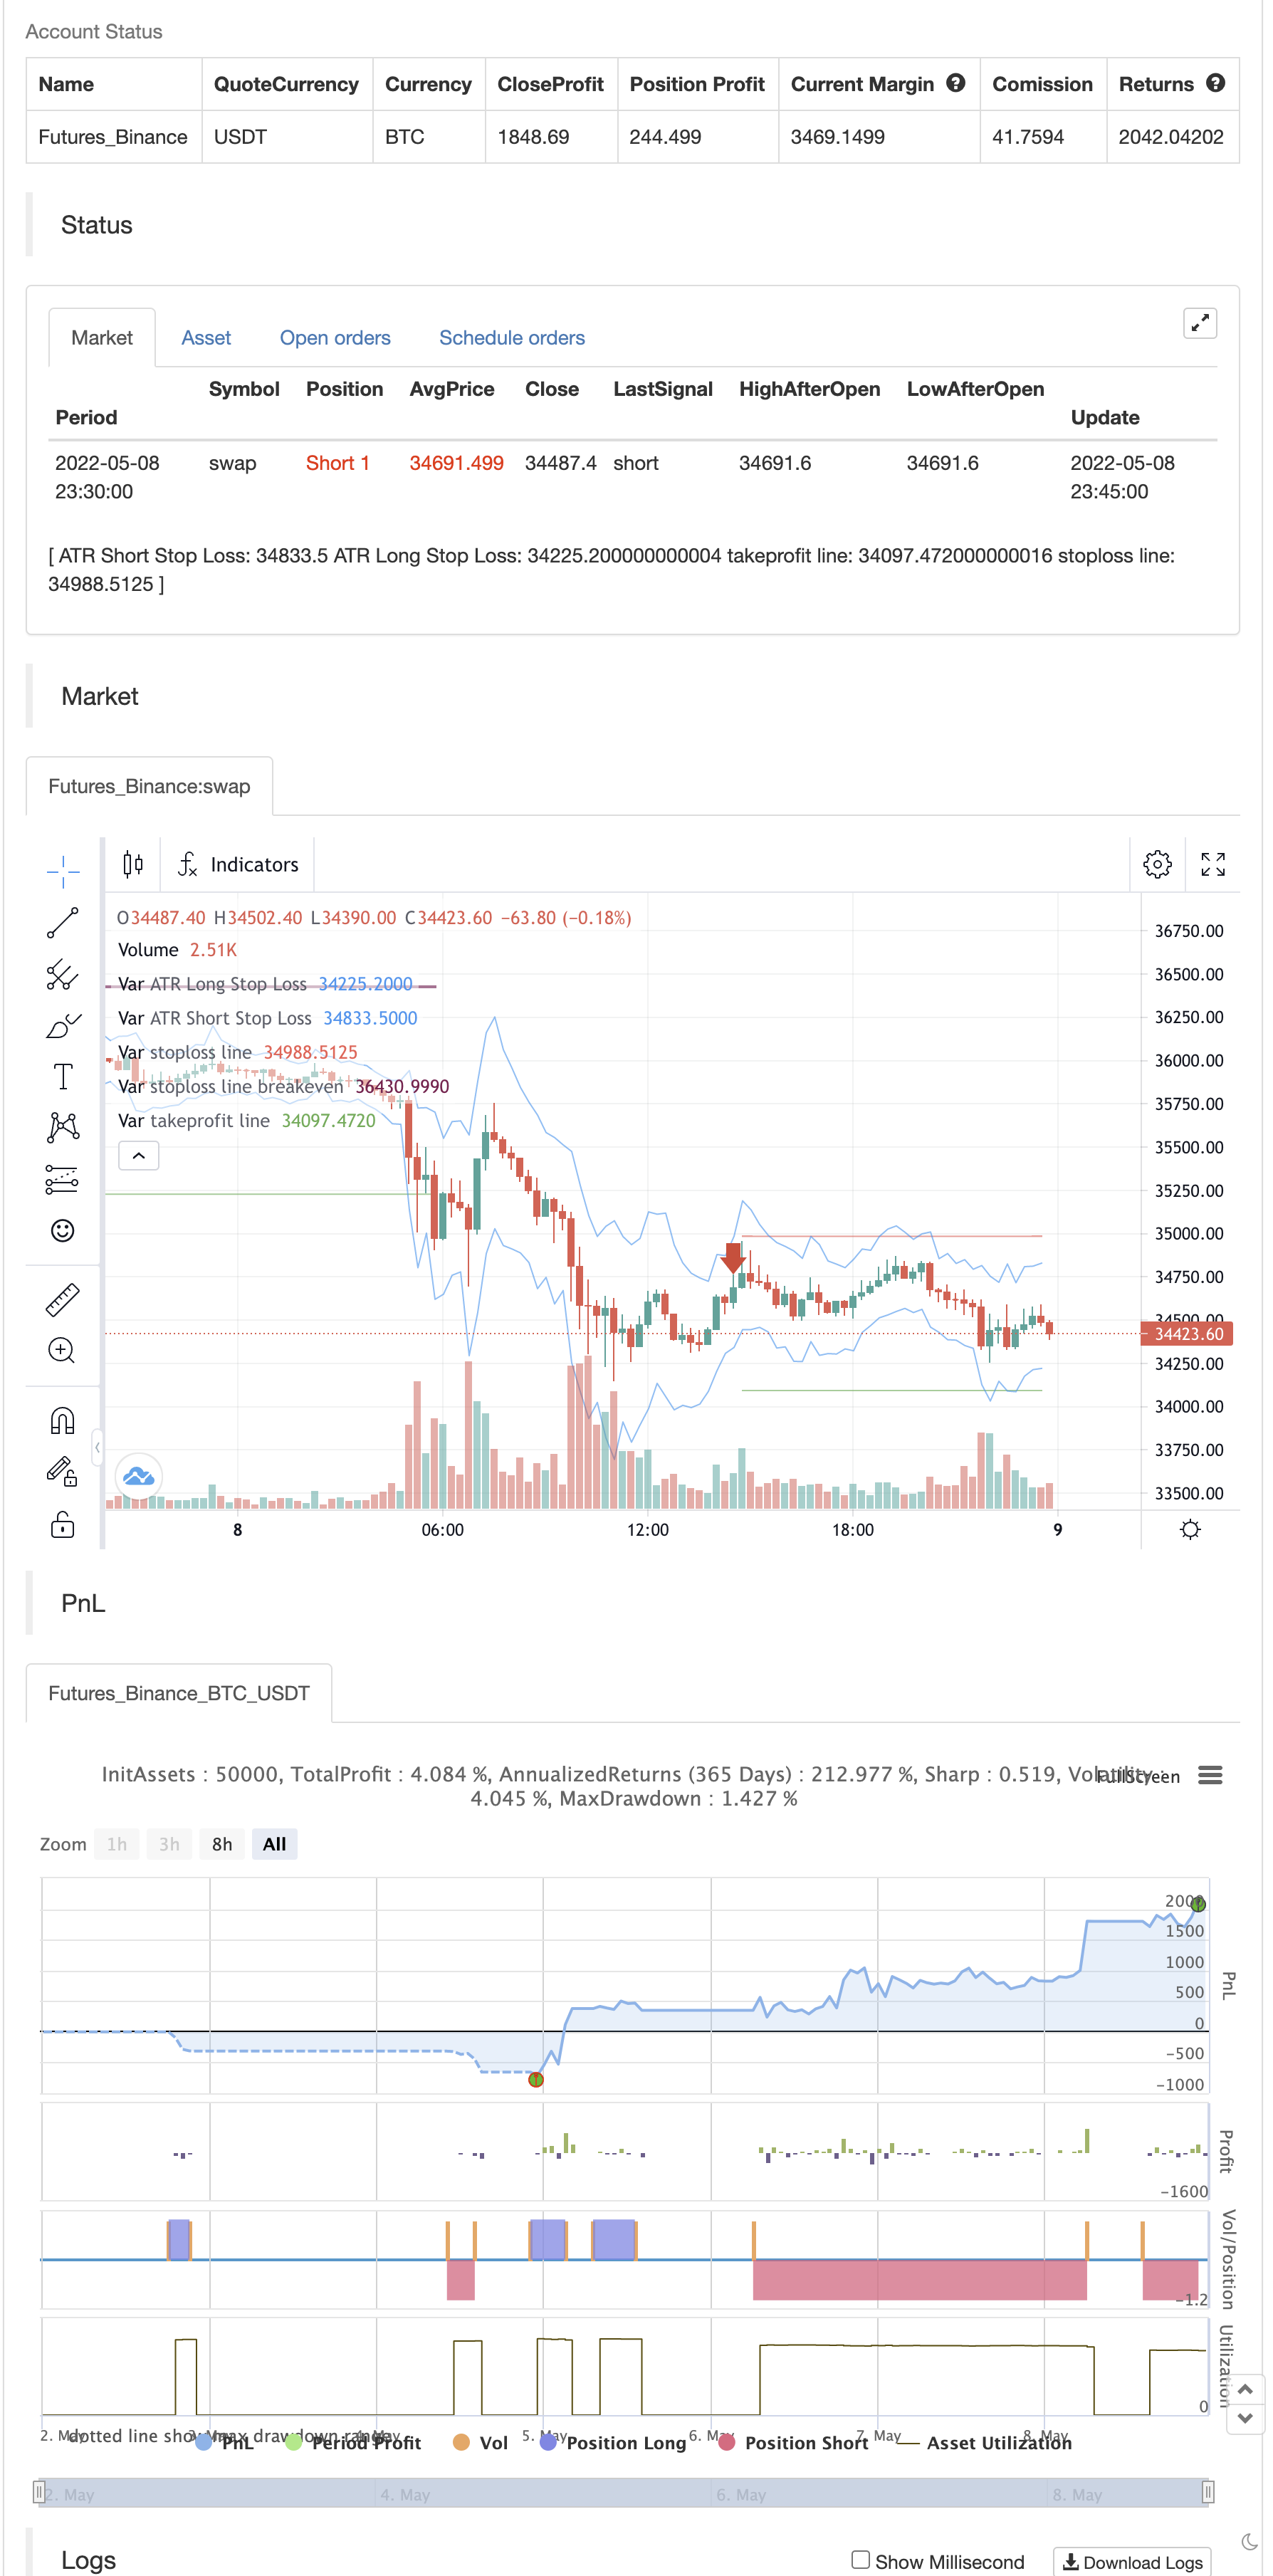
یہ حکمت عملی سپر ٹرینڈ ، 200 ای ایم اے ، اسٹوکاسٹک ، اور اے ٹی آر اسٹاپ نقصان اشارے کو جوڑتی ہے۔ خرید کی شرائط کے ل the ، اسٹوکاسٹک 20 کی سطح سے نیچے ہونا چاہئے ، قیمت 200 ایما سے اوپر ہونی چاہئے اور سپر ٹرینڈ سبز ہونا چاہئے۔ فروخت کی شرائط کے ل it ، اس کا برعکس ہونا چاہئے۔ اسٹوکاسٹک 80 کی سطح سے اوپر ہونا چاہئے ، قیمت 200 ایما سے نیچے ہونی چاہئے اور سپر ٹرینڈ سرخ ہونا چاہئے۔
بیک ٹسٹ
// This source code is subject to the terms of the Mozilla Public License 2.0 at https://mozilla.org/MPL/2.0/
// © araamas

//@version=5
strategy("stoch supertrd atr 200ma", overlay=true, shorttitle="STOCH SUPTR ATR MA", process_orders_on_close=true, max_bars_back=5000)

ema_condition = input.bool(defval=true, title="ema needed?", tooltip="You can choose whether to include the Ema in the buy and sell conditions")
atrPeriod = input(10, "ATR Length")
factor = input.float(3.0, "Factor", step = 0.01)

[supertrend, direction] = ta.supertrend(factor, atrPeriod)

// bodyMiddle = plot((open + close) / 2, display=display.none)
// upTrend = plot(direction < 0 ? supertrend : na, "Up Trend", color = color.green, style=plot.style_linebr)
// downTrend = plot(direction < 0? na : supertrend, "Down Trend", color = color.red, style=plot.style_linebr)

period = input.int(defval=200, title="ema period")
ema = ta.ema(close, period)
// plot(ema, title="200 ema", color=color.yellow)

b = input.int(defval=14, title="length k%")
d = input.int(defval=3, title="smoothing k%")
s = input.int(defval=3, title="smoothing d%")
smooth_k = ta.sma(ta.stoch(close, high, low, b), d)
smooth_d = ta.sma(smooth_k, s)

////////////////////////////////////////////////////////////////////////////////
length = input.int(title="Length", defval=12, minval=1)
smoothing = input.string(title="Smoothing", defval="SMA", options=["RMA", "SMA", "EMA", "WMA"])
m = input(1.5, "Multiplier")
src1 = input(high)
src2 = input(low)
pline = input(true, "Show Price Lines")
col1 = input(color.blue, "ATR Text Color")
col2 = input(color.teal, "Low Text Color",inline ="1")
col3 = input(color.red, "High Text Color",inline ="2")

collong = input(color.teal, "Low Line Color",inline ="1")
colshort = input(color.red, "High Line Color",inline ="2")

ma_function(source, length) =>
	if smoothing == "RMA"
		ta.rma(source, length)
	else
		if smoothing == "SMA"
			ta.sma(source, length)
		else
			if smoothing == "EMA"
				ta.ema(source, length)
			else
				ta.wma(source, length)

a = ma_function(ta.tr(true), length) * m
x = ma_function(ta.tr(true), length) * m + src1
x2 = src2 - ma_function(ta.tr(true), length) * m

p1 = plot(x, title = "ATR Short Stop Loss", color=color.blue)
p2 = plot(x2, title = "ATR Long Stop Loss", color= color.blue)


///////////////////////////////////////////////////////////////////////////////////////////////

shortCondition = high < ema and direction == 1 and smooth_k > 80 or (ema_condition == false and direction == 1 and smooth_k > 80)
if (shortCondition) and strategy.position_size == 0
    strategy.entry("sell", strategy.short)

longCondition = low > ema and direction == -1 and smooth_k < 20 or (ema_condition == false and direction == -1 and smooth_k < 20)
if (longCondition) and strategy.position_size == 0
    strategy.entry("buy", strategy.long)

x2_val = x2[bar_index - strategy.opentrades.entry_bar_index(0)]
g = (strategy.opentrades.entry_price(0) - x2_val) * 2 // tp for buy

x_val = x[bar_index - strategy.opentrades.entry_bar_index(0)]
k = (x_val - strategy.opentrades.entry_price(0)) * 2 //tp for sell

activate_breakeven_sl_price = strategy.opentrades.entry_price(0) + (strategy.opentrades.entry_price(0) - x2_val) //price to activate sl for buy
sl_breakeven_price_activated = ta.highest(high, strategy.position_size == 0 ? nz(strategy.opentrades.entry_bar_index(0), 1):bar_index - strategy.opentrades.entry_bar_index(0)) > activate_breakeven_sl_price ? true:false //checks if 1:1 ratio has been reached

activate_breakeven_sl_price1 = strategy.opentrades.entry_price(0) - (x_val - strategy.opentrades.entry_price(0)) //price to activate sl for buy
sl_breakeven_price_activated1 = ta.lowest(high, strategy.position_size == 0 ? nz(strategy.opentrades.entry_bar_index(0), 1):bar_index - strategy.opentrades.entry_bar_index(0)) < activate_breakeven_sl_price1 ? true:false //checks if 1:1 ratio has been reached

if strategy.position_size > 0
    strategy.exit(id="buy exit", from_entry="buy",limit=strategy.opentrades.entry_price(0) + g, stop=sl_breakeven_price_activated ? strategy.opentrades.entry_price(0):x2_val)

if strategy.position_size < 0
    strategy.exit(id="sell exit", from_entry="sell",limit=strategy.opentrades.entry_price(0) - k, stop=sl_breakeven_price_activated1 ? strategy.opentrades.entry_price(0):x_val)


plot(strategy.position_size > 0 ? strategy.opentrades.entry_price(0) + g:na, color=color.green, style=plot.style_linebr, title="takeprofit line") //to plot tp line for buy
plot(strategy.position_size > 0 and sl_breakeven_price_activated == false ? x2_val:na, color=color.red, style=plot.style_linebr, title="stoploss line") //to plot sl line for buy
plot(sl_breakeven_price_activated and strategy.position_size > 0 ? strategy.opentrades.entry_price(0):na, color=color.maroon, style=plot.style_linebr, linewidth=2, title="stoploss line breakeven") //to plot breakeven sl for buy

plot(strategy.position_size < 0 ? strategy.opentrades.entry_price(0) - k:na, color=color.green, style=plot.style_linebr, title="takeprofit line") //to plot tp line for sell
plot(strategy.position_size < 0 and sl_breakeven_price_activated1 == false ? x_val:na, color=color.red, style=plot.style_linebr, title="stoploss line") //to plot sl line for sell
plot(sl_breakeven_price_activated1 and strategy.position_size < 0 ? strategy.opentrades.entry_price(0):na, color=color.maroon, style=plot.style_linebr, linewidth=2, title="stoploss line breakeven") //to plot breakeven sl for sell
متعلقہ
- RSI/MACD/ATR کے ساتھ EMA کراس اوور کی بہتر حکمت عملی
- Z- اسکور رجحان کی پیروی کی حکمت عملی
- ای ایم اے پر طویل اندراج خطرے کے انتظام کی حکمت عملی کے ساتھ کراس
- وی ڈبلیو اے پی ٹریڈنگ حکمت عملی
- ویو ٹرینڈ کراس لیزیبیئر حکمت عملی
- الفا ٹریڈنگ بوٹ ٹریڈنگ کی حکمت عملی
- آر ایس آئی اور ڈبل ای ایم اے کراس اوور سگنل کی کوانٹیٹیٹیو حکمت عملی
- ایلیٹ ویو تھیوری 4-9 امپیلس ویو خودکار پتہ لگانے کی تجارتی حکمت عملی
- اے آئی میں بہتری کے ساتھ KRK aDa اسٹوکاسٹک سست اوسط ریورسشن حکمت عملی
- EMA23/EMA50 ڈبل حرکت پذیر اوسط کراس اوور مقداری تجارتی حکمت عملی
- ایم اے سی ڈی گولڈن کراس اور ڈیتھ کراس حکمت عملی
مزید
- کراس کھیل
- چھوٹے فریکٹلز (+ شفافیت)
- BB-RSI-ADX اندراج پوائنٹس
- ہیل-4 ایما
- زاویہ حملہ لائن کے بعد اشارے
- کِجُن سِن لائن کراس کے ساتھ
- اے ایم اے سی ڈی - تمام متحرک اوسط کنورجنس ڈائیورجنس
- راج کی طرف سے ایم اے ہائبرڈ
- ہیرے کا رجحان
- نیک اسٹوک
- MTF RSI & STOCH حکمت عملی
- EMA + AROON + ASH
- رفتار 2.0
- ای ایچ ایم اے رینج حکمت عملی
- اوسط خرید و فروخت
- میڈاس ایم کے II - الٹیمیٹ کریپٹو سوئنگ
- ٹی ایم اے-لیگیسی
- ٹی وی ہائی اور لو حکمت عملی
- بہترین ٹریڈنگ ویو حکمت عملی
- بڑے سنیپر انتباہات R3.0 + چیکنگ Volatility حالت + TP RSI