سوئنگ ہائی/لو انڈیکیٹر w/ MACD اور EMA تصدیق
مصنف:چاؤ ژانگ، تاریخ: 2022-05-11 16:28:07ٹیگز:ایم اے سی ڈی
سوئنگ ہائی/لو انڈیکیٹر w/ MACD اور EMA کی تصدیق KaizenTraderB کی طرف سے
میں نے اس اشارے کو مارکیٹ کی ساخت کو توڑنے کی حکمت عملی کے ساتھ استعمال کرنے کے لئے ڈیزائن کیا ہے. یہ سوئنگ اونچائیوں اور اونچائیوں کو لیبل لگاتا ہے جو MACD کی طرف سے تصدیق کی جاتی ہے. یہ سمت کی تعصب کا تعین کرنے کے لئے ایک اعلی ٹائم فریم فاسٹ اور سست ای ایم اے بھی دکھاتا ہے۔ یہ بھی انتباہات فراہم کرتا ہے جو ڈاؤن ٹرینڈز میں سوئنگ لو توڑنے اور اپ ٹرینڈز میں سوئنگ ہائی توڑنے کا اشارہ کرتا ہے۔ یہ آخری سوئنگ ہائی اور لو پر ایک افقی لائن کھینچتا ہے.
اس اشارے کو اپنے داخلہ ٹائم فریم پر دکھائیں اور ترتیبات میں اپنے اعلی ٹائم فریم کا انتخاب کریں۔ آپ Swing Highs اور Lows اور EMAs کے لئے lookback مدت کو بھی تبدیل کر سکتے ہیں.
جب میں اس کا استعمال کر رہا ہوں میں HTF رجحان کی سمت میں سوئنگ ہائی / کم وقفے کے لئے تلاش کر رہا ہوں پھر EMA رجحان کی سمت میں داخل ہونے کے لئے قیمت کی سطح کے وقفے اور لیکویڈیٹی کے علاقوں (ویکس ، آرڈر بلاکس ، قیمتوں کی گنجائش) کے درمیان پل بیک کی تلاش کریں۔
بیک ٹسٹ
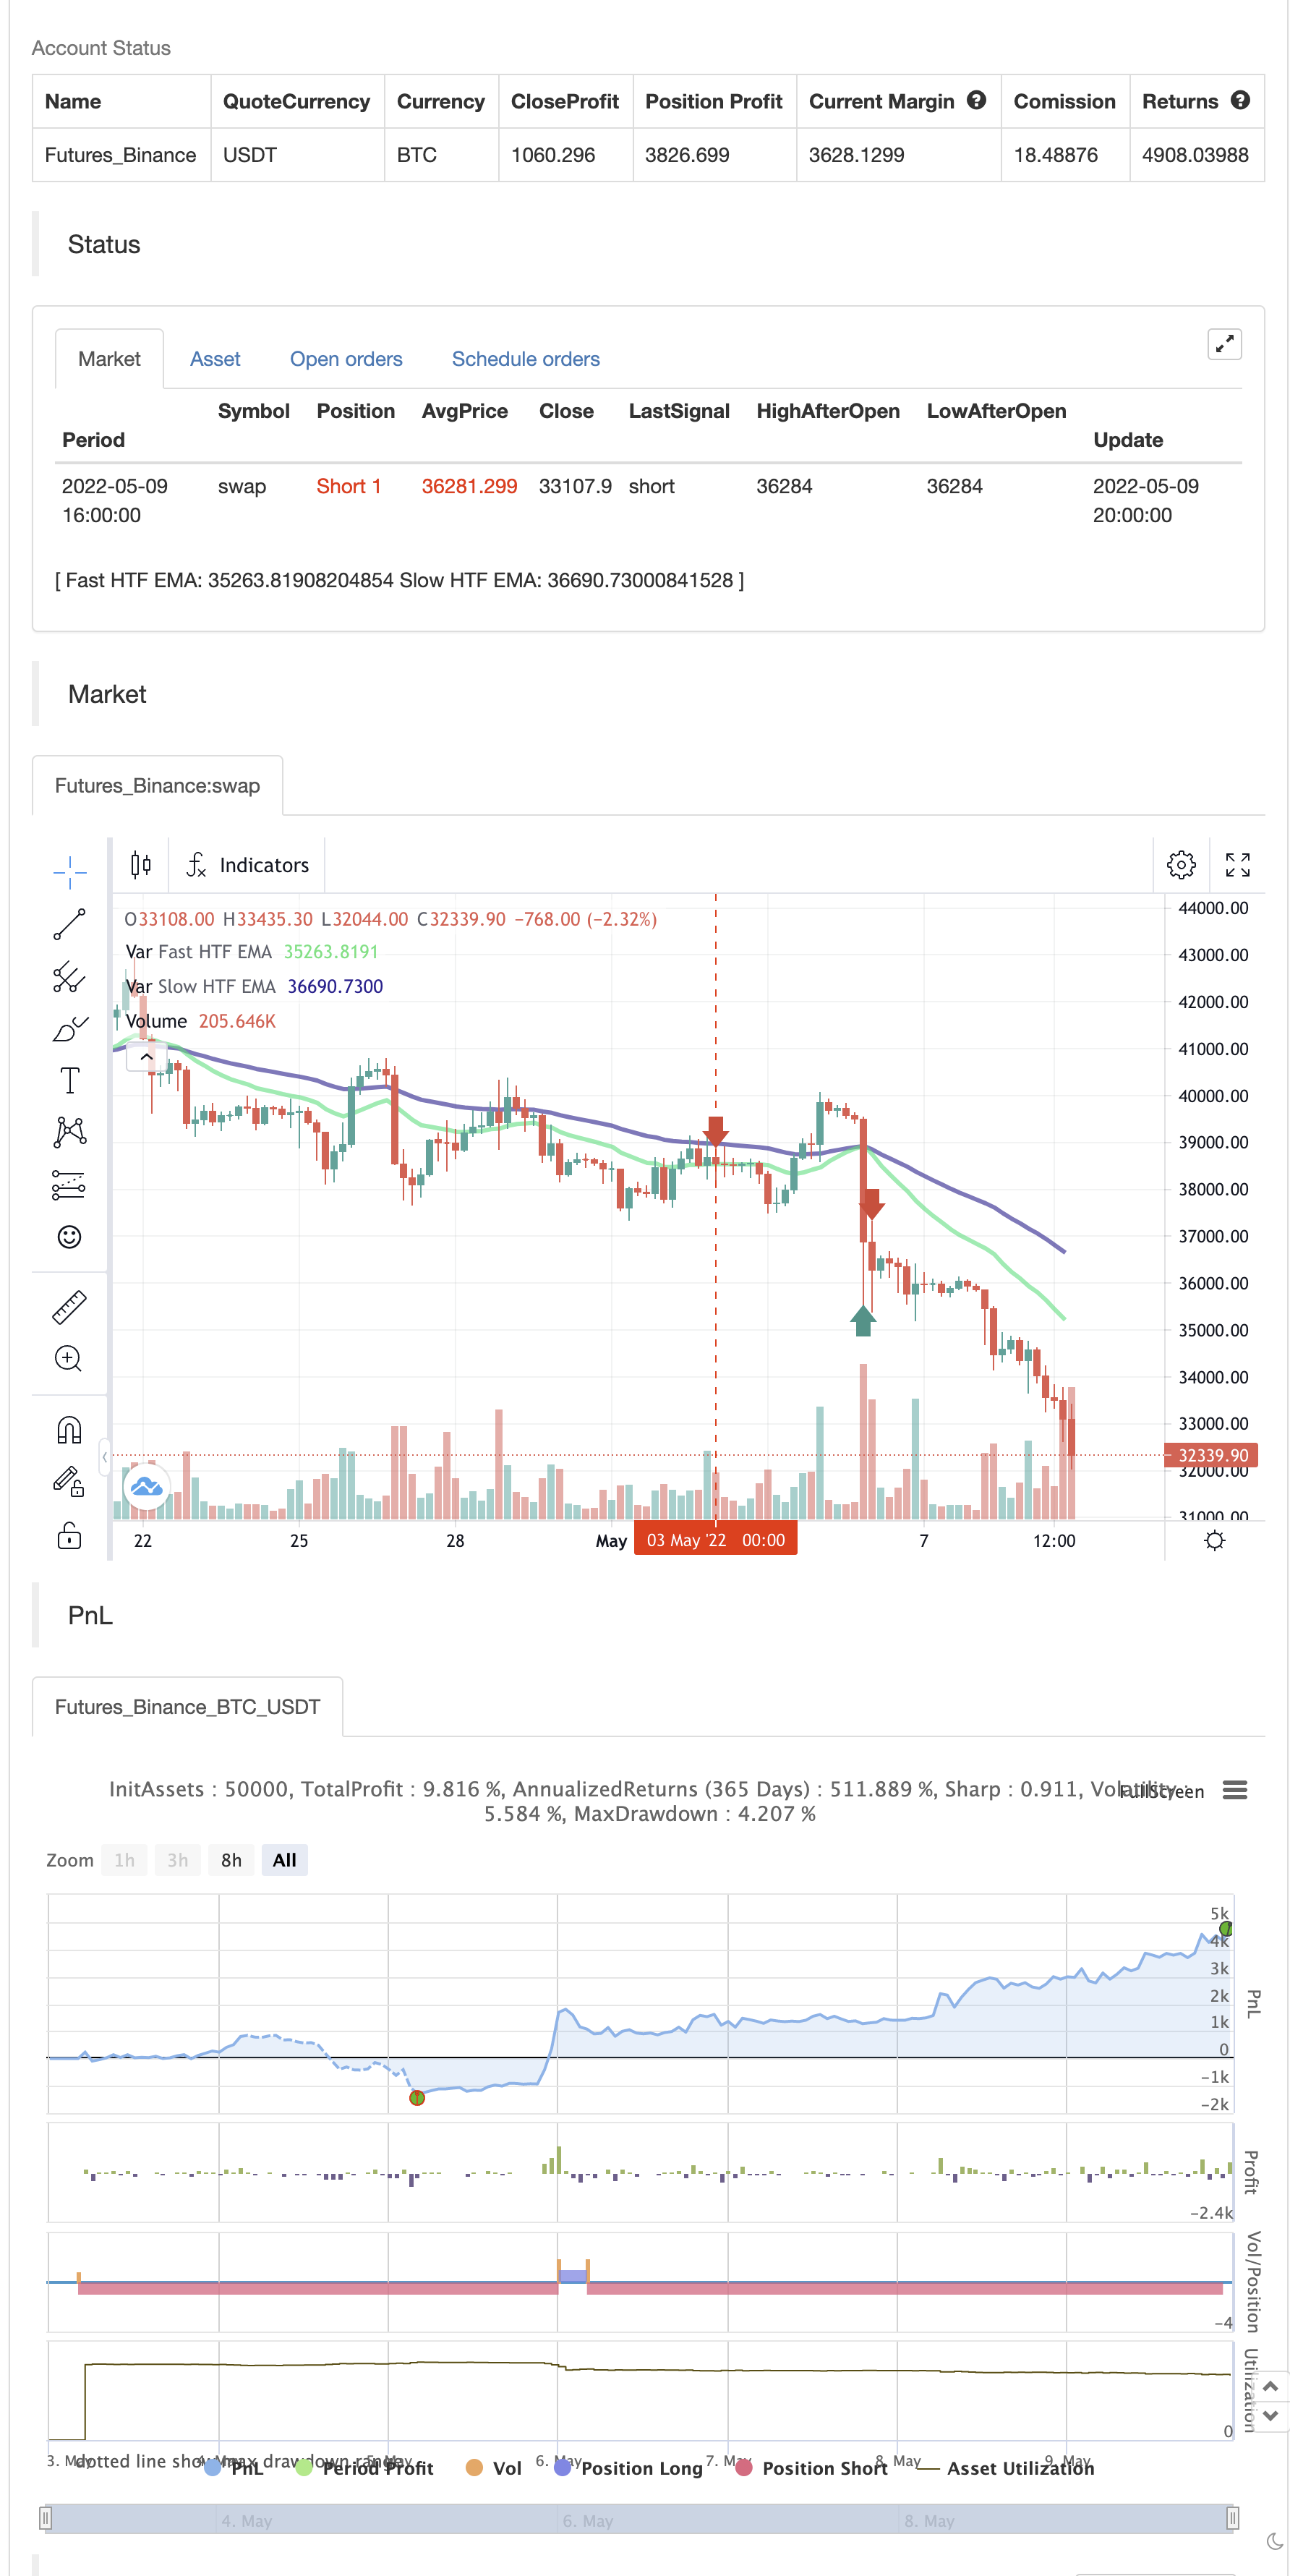
/*backtest
start: 2022-05-03 00:00:00
end: 2022-05-09 23:59:00
period: 4h
basePeriod: 15m
exchanges: [{"eid":"Futures_Binance","currency":"BTC_USDT"}]
*/

// Swing High/Low Indicator w/ MACD and EMA Confirmations by KaizenTraderB
//
//I designed this indicator to be used with a market structure break strategy.
//It labels swing highs and lows that are confirmed by the MACD.
//It also displays a higher timeframe Fast and Slow EMA to determine directional bias.
//Also provides alerts that signal Swing Low breaks in downtrends and Swing High Breaks in uptrends.
//It draws a horizontal line on the last Swing High and Low.
//
//Display this indicator on your entry timeframe and choose your Higher Timeframe in settings.
//You can also change lookback period for Swing Highs and Lows and EMA's.
//
//@version=4
study("Swing High/Low Indicator w/ MACD and HTF EMA's", overlay=true)

barsback = input(5, title='Bars back to check for a swing')
showsig = input(true, title='Show Signal Markers')
res = input(title="EMA Timeframe", defval="240")
flen = input(title="Fast EMA Length", type=input.integer, defval=20)
slen = input(title="Slow EMA Length", type=input.integer, defval=50)
showema = input(title="Show EMA's", type=input.bool, defval=true)
showentry = input(title="Show Swing Break Entry Levels", type=input.bool, defval=true)

//HTF EMA's

fema = ema(close, flen)
sema = ema(close, slen)

rp_security(_symbol, _res, _src, _gaps, _lookahead) => security(_symbol, _res, _src[barstate.isrealtime ? 1 : 0], _gaps, _lookahead)

femaSmooth = rp_security(syminfo.tickerid, res, fema, barmerge.gaps_on, barmerge.lookahead_off)
semaSmooth = rp_security(syminfo.tickerid, res, sema, barmerge.gaps_on, barmerge.lookahead_off)
plot(showema ? femaSmooth : na,"Fast HTF EMA", color.lime, 3)
plot(showema ? semaSmooth : na,"Slow HTF EMA", color.navy, 3)

downtrend = femaSmooth < semaSmooth
uptrend = femaSmooth > semaSmooth

//Swing Highs and Lows
////////////////////////////////////////////////////////////////////////////////
//Thank you Backtest-Rookies.com for the Swing Detection Indicator code

swing_detection(index)=>
    swing_high = false
    swing_low = false
    start = (index*2) - 1 // -1 so we have an even number of
    swing_point_high = high[index]
    swing_point_low = low[index]

    //Swing Highs
    for i = 0 to start
        swing_high := true
        if i < index
            if high[i] > swing_point_high
                swing_high := false
                break
        // Have to do checks before pivot and after seperately because we can get
        // two highs of the same value in a row. Notice the > and >= difference
        if i > index
            if high[i] >= swing_point_high
                swing_high := false
                break

    //Swing lows
    for i = 0 to start
        swing_low := true
        if i < index
            if low[i] < swing_point_low
                swing_low := false
                break
        // Have to do checks before pivot and after seperately because we can get
        // two lows of the same value in a row. Notice the > and >= difference
        if i > index
            if low[i] <= swing_point_low
                swing_low := false
                break

    [swing_high, swing_low]

// Check for a swing
[swing_high, swing_low] = swing_detection(barsback)
////////////////////////////////////////////////////////////////////////////////

float swing_high_price = na
float swing_low_price = na

if swing_high
    swing_high_price := high[barsback]
if swing_low
    swing_low_price := low[barsback]

[macdline, signalline, histline] = macd(close,12,26,9)

macpos = histline[barsback] > 0
macneg = histline[barsback] < 0

// Plotting

SHPrice = "SH\n" + str.tostring(swing_high_price)
SLPrice = "SL\n" + str.tostring(swing_low_price)

if swing_high and macpos and showsig
    //SHLabel = label.new(bar_index[barsback], swing_high_price, SHPrice, xloc.bar_index, yloc.abovebar, color.red, label.style_arrowdown, textcolor=color.red, size=size.normal)
    //SHLine = line.new(bar_index[barsback], swing_high_price, bar_index[barsback] + 20, swing_high_price, xloc.bar_index, extend.none, color.black, width=2)
    //line.delete(SHLine[1])

if swing_low and macneg and showsig
    //label.new(bar_index[barsback], swing_low_price, SLPrice, xloc.bar_index, yloc.belowbar, color.green, label.style_arrowup, textcolor=color.green)
    //SLLine = line.new(bar_index[barsback], swing_low_price, bar_index[barsback] + 20, swing_low_price, xloc.bar_index, extend.none, color.black, width=2)
    //line.delete(SLLine[2])

//alerts
alertcondition(uptrend and close > swing_high_price, "Swing High Break in Uptrend", "Swing High Break!")
alertcondition(downtrend and close < swing_low_price, "Swing Low Break in Downtrend", "Swing Low Break!")

if uptrend
    strategy.entry("Enter Long", strategy.long)
else if downtrend
    strategy.entry("Enter Short", strategy.short)
- RSI/MACD/ATR کے ساتھ EMA کراس اوور کی بہتر حکمت عملی
- ایم اے سی ڈی اور آر ایس آئی مشترکہ طویل مدتی تجارتی حکمت عملی
- کثیر اشارے کا مجموعہ حکمت عملی (CCI، DMI، MACD، ADX)
- حکمت عملی کے بعد کثیر اشارے کا رجحان
- سی سی آئی، ڈی ایم آئی، اور ایم اے سی ڈی ہائبرڈ لانگ شارٹ حکمت عملی
- ایلیٹ ویو تھیوری 4-9 امپیلس ویو خودکار پتہ لگانے کی تجارتی حکمت عملی
- ایم اے سی ڈی گولڈن کراس اور ڈیتھ کراس حکمت عملی
- MACD-V اور فبونیکی ملٹی ٹائم فریم متحرک منافع لینے کی حکمت عملی
- ایم اے سی ڈی بی بی بریک آؤٹ حکمت عملی
- اے ٹی آر پر مبنی رسک مینجمنٹ کے ساتھ MACD ٹرینڈ فالونگ کی بہتر حکمت عملی
- ZeroLag MACD لمبی مختصر حکمت عملی
- آر ایس آئی اور بی بی اور بیک وقت اوور سیلڈ
- رولنگ ہائکن آشی موم بتیاں
- کمبو 2/20 ای ایم اے اور بینڈ پاس فلٹر
- ای ایس ایس ایم اے
- 3EMA
- محور آرڈر بلاکس
- NMVOB-S
- حرکت پذیر اوسط رنگین EMA/SMA
- ایم اے ایچ ایل بینڈ
- اس واحد اسکرپٹ میں 3 سپر رجحان شامل کریں
- ٹرپل ای ایم اے + ایم اے سی ڈی
- کراس کھیل
- چھوٹے فریکٹلز (+ شفافیت)
- BB-RSI-ADX اندراج پوائنٹس
- ہیل-4 ایما
- زاویہ حملہ لائن کے بعد اشارے
- کِجُن سِن لائن کراس کے ساتھ
- اے ایم اے سی ڈی - تمام متحرک اوسط کنورجنس ڈائیورجنس
- راج کی طرف سے ایم اے ہائبرڈ
- ہیرے کا رجحان