سپر ٹرینڈ ڈیلی 2.0 BF
مصنف:چاؤ ژانگ، تاریخ: 2022-05-26 16: 48:33ٹیگز:اے ٹی آرای ایم اےآر او سی
یہ میری سپر ٹرینڈ ڈیلی حکمت عملی ہے لیکن ایک اہم فرق کے ساتھ۔ اب آپ لمبے یا مختصر سگنلز کی ترتیبات کو انفرادی طور پر اور الگ الگ ایڈجسٹ کرسکتے ہیں۔ مثال کے طور پر ، لمبے سگنل کی شرط کو مختصر سگنل کی شرط سے مختلف پیرامیٹر کی ترتیب کی ضرورت پڑسکتی ہے۔ سگنل کی تخلیق میں ہر پیرامیٹر کو ٹون کیا جاسکتا ہے۔ آپ یہ بھی فیصلہ کرسکتے ہیں کہ آپ ہر طرف کس قسم کا اسٹاپ نقصان چاہتے ہیں - آپ لمبے عرصے کے لئے فکسڈ اسٹاپ نقصان اور شارٹس کے لئے اے ٹی آر سے ماخوذ اسٹاپ نقصان یا کچھ بھی کرسکتے ہیں۔
ہمارے پاس یہ بھی اختیار ہے کہ ہم لانگ، شارٹس یا دونوں چاہتے ہیں یا نہیں۔
ہدایات پس منظر کے رنگوں کو دیکھو: سبز لائن = طویل سگنل سرخ لائن = مختصر سگنل ایکوا = کوئی طویل تجارت نہیں سفید = کوئی مختصر تجارت نہیں پیلے رنگ کی ڈاٹ لائن = طویل عرصے تک سٹاپ نقصان اورنج ڈاٹ لائن = اسٹاپ نقصان مختصر
ایکوا اور سفید پس منظر کا مطلب یہ ہے کہ ہماری ترتیبات کے مطابق حالات متضاد / سائیڈ ویز ہیں جو ہم نے بالترتیب ایک لمبی / مختصر سگنل کے لئے شرح تبدیلی کے فنکشن پر لاگو کیا۔ سفید پس منظر میں لمبی سگنل حاصل کرنا ممکن ہے ، لیکن مختصر سگنل نہیں۔ اسی طرح ، ایکوا پس منظر میں مختصر سگنل حاصل کرنا ممکن ہے ، لیکن لمبا سگنل نہیں۔
یہ کام جاری ہے لہذا بہتری کے لئے کسی بھی تجاویز کا خیر مقدم کیا جاتا ہے.
بیک ٹسٹ
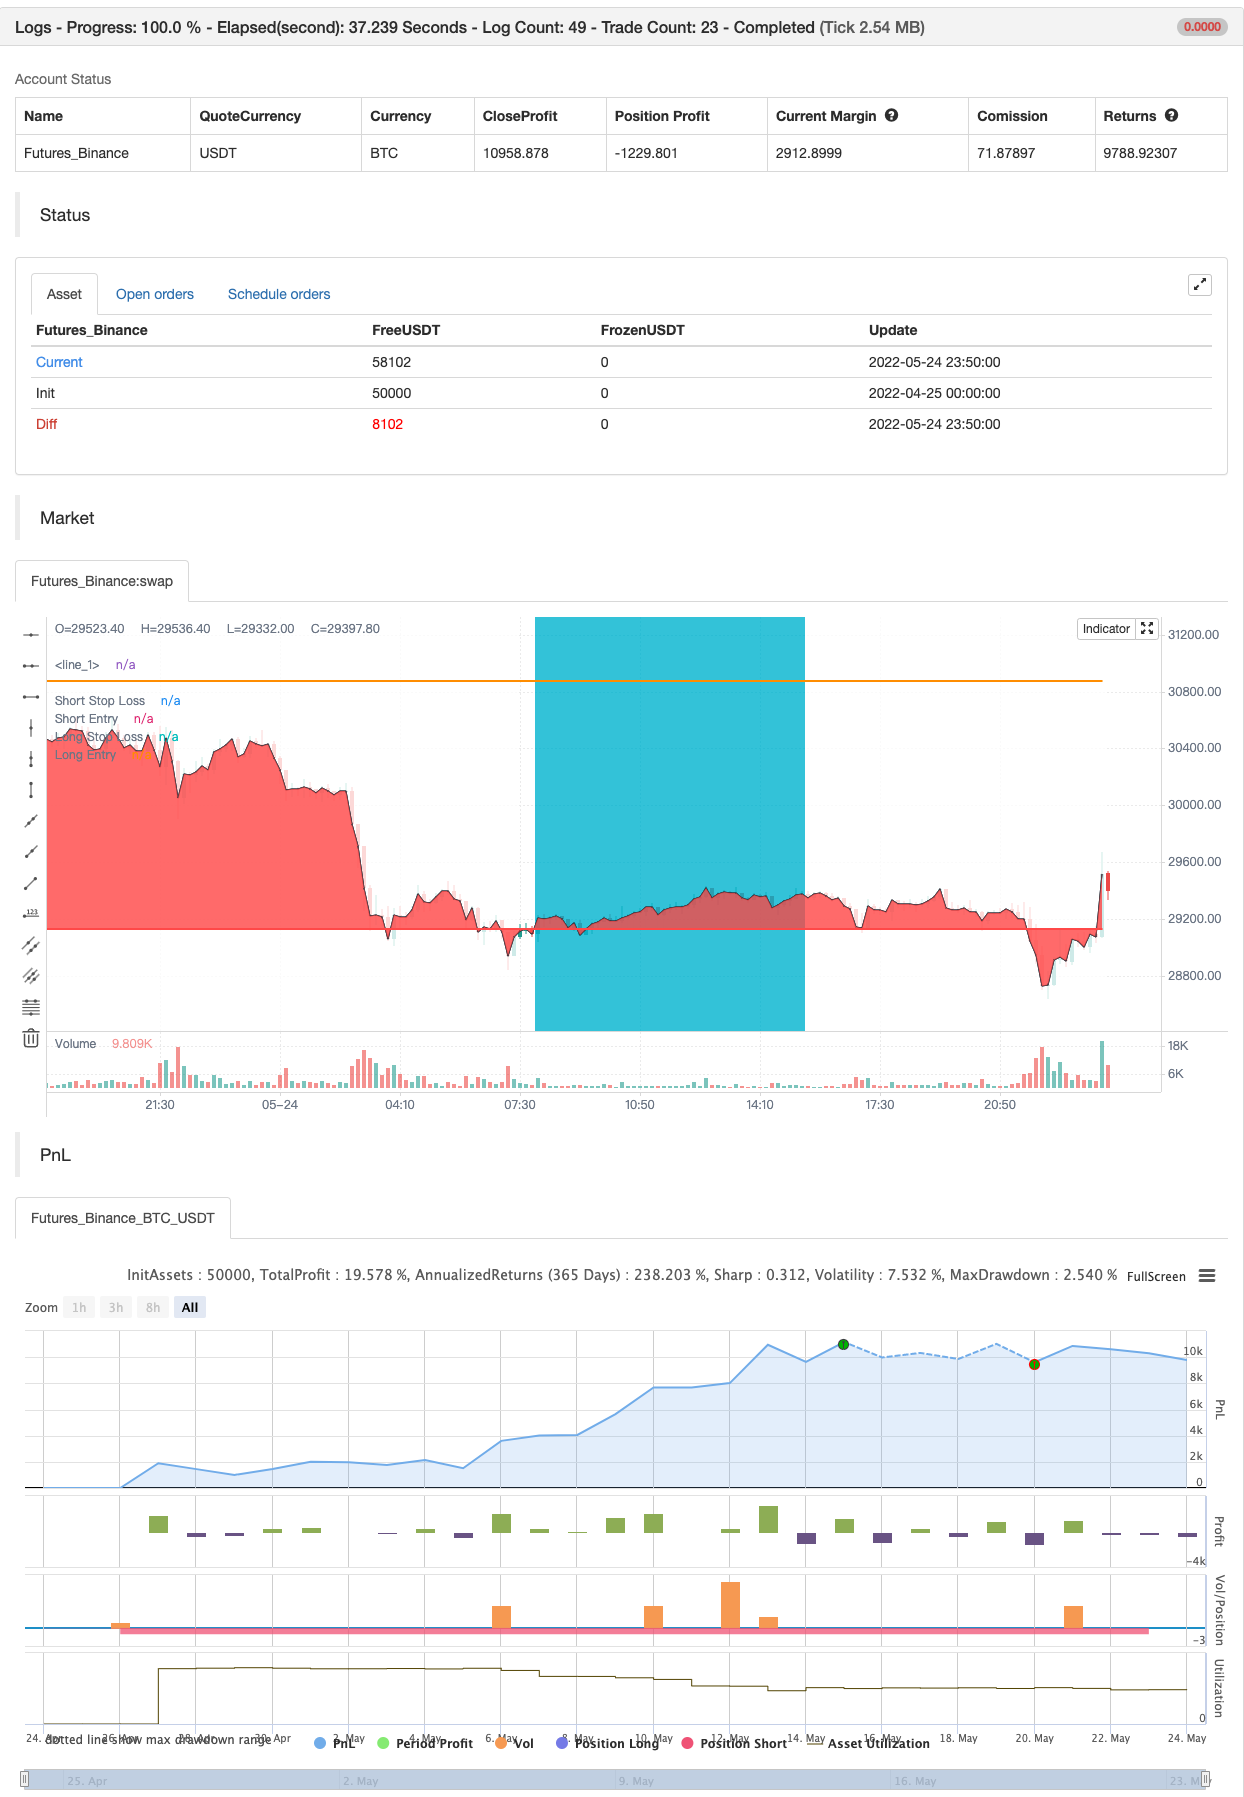
/*backtest
start: 2022-04-25 00:00:00
end: 2022-05-24 23:59:00
period: 10m
basePeriod: 1m
exchanges: [{"eid":"Futures_Binance","currency":"BTC_USDT"}]
*/

//@version=4
strategy("Super Trend Daily 2.0 BF ", overlay=true, precision=2, initial_capital=10000, default_qty_type=strategy.percent_of_equity, default_qty_value=100, commission_type=strategy.commission.percent, commission_value=0.075)

/////////////// Time Frame ///////////////
_0 = input(false,  "════════ Test Period ═══════")
testStartYear = input(2017, "Backtest Start Year")
testStartMonth = input(1, "Backtest Start Month")
testStartDay = input(1, "Backtest Start Day")
testPeriodStart = timestamp(testStartYear,testStartMonth,testStartDay, 0, 0)

testStopYear = input(2019, "Backtest Stop Year")
testStopMonth = input(12, "Backtest Stop Month")
testStopDay = input(31, "Backtest Stop Day")
testPeriodStop = timestamp(testStopYear,testStopMonth,testStopDay, 0, 0)

testPeriod() => true

///////////// Super Trend Long /////////////
_1 = input(false,  "═════ Super Trend L ═════")
lengthl = input(title="ATR Period", type=input.integer, defval=2)
multl = input(title="ATR Multiplier", type=input.float, step=0.1, defval=1.5)

atrl = multl * atr(lengthl)

longStopl = hl2 - atrl
longStopPrevl = nz(longStopl[1], longStopl)
longStopl :=  close[1] > longStopPrevl ? max(longStopl, longStopPrevl) : longStopl

shortStopl = hl2 + atrl
shortStopPrevl = nz(shortStopl[1], shortStopl)
shortStopl := close[1] < shortStopPrevl ? min(shortStopl, shortStopPrevl) : shortStopl

dirl = 1
dirl := nz(dirl[1], dirl)
dirl := dirl == -1 and close > shortStopPrevl ? 1 : dirl == 1 and close < longStopPrevl ? -1 : dirl

///////////// Super Trend Short /////////////
_2 = input(false,  "═════ Super Trend S ═════")
lengths = input(title="ATR Period", type=input.integer, defval=3)
mults = input(title="ATR Multiplier", type=input.float, step=0.1, defval=1.3)

atrs = mults * atr(lengths)

longStops = hl2 - atrs
longStopPrevs = nz(longStops[1], longStops)
longStops :=  close[1] > longStopPrevs ? max(longStops, longStopPrevs) : longStops

shortStops = hl2 + atrs
shortStopPrevs = nz(shortStops[1], shortStops)
shortStops := close[1] < shortStopPrevs ? min(shortStops, shortStopPrevs) : shortStops

dirs = 1
dirs := nz(dirs[1], dirs)
dirs := dirs == -1 and close > shortStopPrevs ? 1 : dirs == 1 and close < longStopPrevs ? -1 : dirs

///////////// Rate Of Change Long /////////////
_3 = input(false,  "═════ Rate of Change L ═════")
sourcel = close
roclengthl = input(30, "ROC Length",  minval=1)
pcntChangel = input(6, "ROC % Change", minval=1)
rocl = 100 * (sourcel - sourcel[roclengthl]) / sourcel[roclengthl]
emarocl = ema(rocl, roclengthl / 2)
isMovingl() => emarocl > (pcntChangel / 2) or emarocl < (0 - (pcntChangel / 2))

///////////// Rate Of Change Short /////////////
_4 = input(false,  "═════ Rate of Change S ═════")
sources = close
roclengths = input(76, "ROC Length",  minval=1)
pcntChanges = input(6, "ROC % Change", minval=1)
rocs = 100 * (sources - sources[roclengths]) / sources[roclengths]
emarocs = ema(rocs, roclengths / 2)
isMovings() => emarocs > (pcntChanges / 2) or emarocs < (0 - (pcntChanges / 2))

/////////////// Strategy ///////////////
long = dirl == 1 and dirl[1] == -1 and isMovingl()
short = dirs == -1 and dirs[1] == 1 and isMovings()

last_long = 0.0
last_short = 0.0
last_long := long ? time : nz(last_long[1])
last_short := short ? time : nz(last_short[1])

long_signal = crossover(last_long, last_short)
short_signal = crossover(last_short, last_long)

last_open_long_signal = 0.0
last_open_short_signal = 0.0
last_open_long_signal := long_signal ? open : nz(last_open_long_signal[1])
last_open_short_signal := short_signal ? open : nz(last_open_short_signal[1])

last_long_signal = 0.0
last_short_signal = 0.0
last_long_signal := long_signal ? time : nz(last_long_signal[1])
last_short_signal := short_signal ? time : nz(last_short_signal[1])

in_long_signal = last_long_signal > last_short_signal
in_short_signal = last_short_signal > last_long_signal

last_high = 0.0
last_low = 0.0
last_high := not in_long_signal ? na : in_long_signal and (na(last_high[1]) or high > nz(last_high[1])) ? high : nz(last_high[1])
last_low := not in_short_signal ? na : in_short_signal and (na(last_low[1]) or low < nz(last_low[1])) ? low : nz(last_low[1])

since_longEntry = barssince(last_open_long_signal != last_open_long_signal[1])
since_shortEntry = barssince(last_open_short_signal != last_open_short_signal[1])

/////////////// Stop Losses Long ///////////////
_5 = input(false,  "═══════ Stop Loss L ══════")
SL_typel = input("Fixed", options=["Fixed", "ATR Derived"], title="Stop Loss Type")
sl_inpl = input(5.0, title='Fixed Stop Loss %') / 100
atrLkbl = input(20, minval=1, title='ATR Stop Period')
atrMultl = input(1.5, step=0.25, title='ATR Stop Multiplier')
atr1l = atr(atrLkbl)

longStop1l = 0.0
longStop1l :=  short_signal ? na : long_signal ? close - (atr1l * atrMultl) : longStop1l[1]

slLongl = in_long_signal ? strategy.position_avg_price * (1 - sl_inpl) : na
long_sll = in_long_signal ? slLongl : na

/////////////// Stop Losses Short ///////////////
_6 = input(false,  "═══════ Stop Loss S ══════")
SL_types = input("Fixed", options=["Fixed", "ATR Derived"], title="Stop Loss Type")
sl_inps = input(6.0, title='Fixed Stop Loss %') / 100
atrLkbs = input(20, minval=1, title='ATR Stop Period')
atrMults = input(1.5, step=0.25, title='ATR Stop Multiplier')
atr1s = atr(atrLkbs)

shortStop1s = 0.0
shortStop1s := long_signal ? na : short_signal ? close + (atr1s * atrMults) : shortStop1s[1]

slShorts = strategy.position_avg_price * (1 + sl_inps)
short_sls = in_short_signal ? slShorts : na

_7 = input(false,  "══════ Longs or Shorts ═════")
useLongs = input(true, title="Use Longs")
useShorts = input(true, title="Use Shorts")

/////////////// Execution ///////////////
if testPeriod()
    if useLongs
        strategy.entry("L", strategy.long, when=long)
        strategy.exit("L SL", "L", stop = SL_typel == "Fixed" ? long_sll : longStop1l, when=since_longEntry > 0)
    if useShorts
        strategy.exit("S SL", "S", stop = SL_types == "Fixed" ? short_sls : shortStop1s, when=since_shortEntry > 0)
        strategy.entry("S", strategy.short, when=short)
    if not useShorts
        strategy.close("L", when=short)
    if not useLongs
        strategy.close("S", when=long)

/////////////// Plotting ///////////////
bgcolor(long_signal ? color.lime : short_signal ? color.red : na, transp=40)
bgcolor(not isMovings() ? color.white : not isMovingl() ? color.aqua : na)
p0 = plot(close, color=color.black)
p1 = plot(strategy.position_size <= 0 ? na : SL_typel == "Fixed" ? long_sll : longStop1l, title="Long Stop Loss", color=color.yellow, style=plot.style_linebr, linewidth=2)
p2 = plot(strategy.position_size >= 0 ? na : SL_types == "Fixed" ? short_sls : shortStop1s, title="Short Stop Loss", color=color.orange, style=plot.style_linebr, linewidth=2)
p3 = plot(strategy.position_size <= 0 ? na : strategy.position_avg_price, style=plot.style_linebr, title="Long Entry", color=color.green, linewidth=2)
p4 = plot(strategy.position_size >= 0 ? na : strategy.position_avg_price, style=plot.style_linebr, title="Short Entry", color=color.red, linewidth=2)
fill(p0, p3, color = color.lime, transp=60)
fill(p0, p4, color = color.red, transp=60)
- ٹرپل ای ایم اے کراس اوور حکمت عملی
- ایم ایل انتباہات کا نمونہ
- الفا ٹریڈنگ بوٹ ٹریڈنگ کی حکمت عملی
- ایس ایس ایل ہائبرڈ
- ایم اے سی ڈی ویلی ڈیٹیکٹر حکمت عملی
- RSI/MACD/ATR کے ساتھ EMA کراس اوور کی بہتر حکمت عملی
- متحرک خطرے کے انتظام کی حکمت عملی کے بعد کثیر اشارے کا رجحان
- وِلا ڈائنامک پِیوٹ سپر ٹرینڈ حکمت عملی
- سپر جمپ ٹرن بیک بولنگر بینڈ
- ای ایس ایس ایم اے
- چوٹی کا پتہ لگانے والا
- کم تلاش کرنے والا
- ایس ایم اے رجحان
- بولنگر کی کمیاں
- سپر ٹرینڈ بی
- سوئنگ ٹریڈ سگنل
- شیف رجحان سائیکل
- 72s: ایڈجسٹ ہول چلتی اوسط +
- خرید/فروخت کے ساتھ EMA ADX RSI کا اسکیلپنگ
- حجم کا فرق
- ہل منتقل اوسط سوئنگ ٹریڈر
- FTSMA - رجحان آپ کا دوست ہے
- رینج فلٹر خریدیں اور فروخت کریں
- ایس ایس ایل چینل
- ہل سویٹ حکمت عملی
- پیرابولک SAR خریدیں اور فروخت کریں
- پییوٹ پر مبنی ٹریلنگ زیادہ سے زیادہ اور کم سے کم
- نِک رِپاک ٹریلنگ ریورس (NRTR)
- ZigZag PA حکمت عملی V4.1
- دن کے اندر خرید/فروخت