Chỉ số Swing High/Low với xác nhận của MACD và EMA
Tác giả:ChaoZhang, Ngày: 2022-05-11 16:28:07Tags:MACD
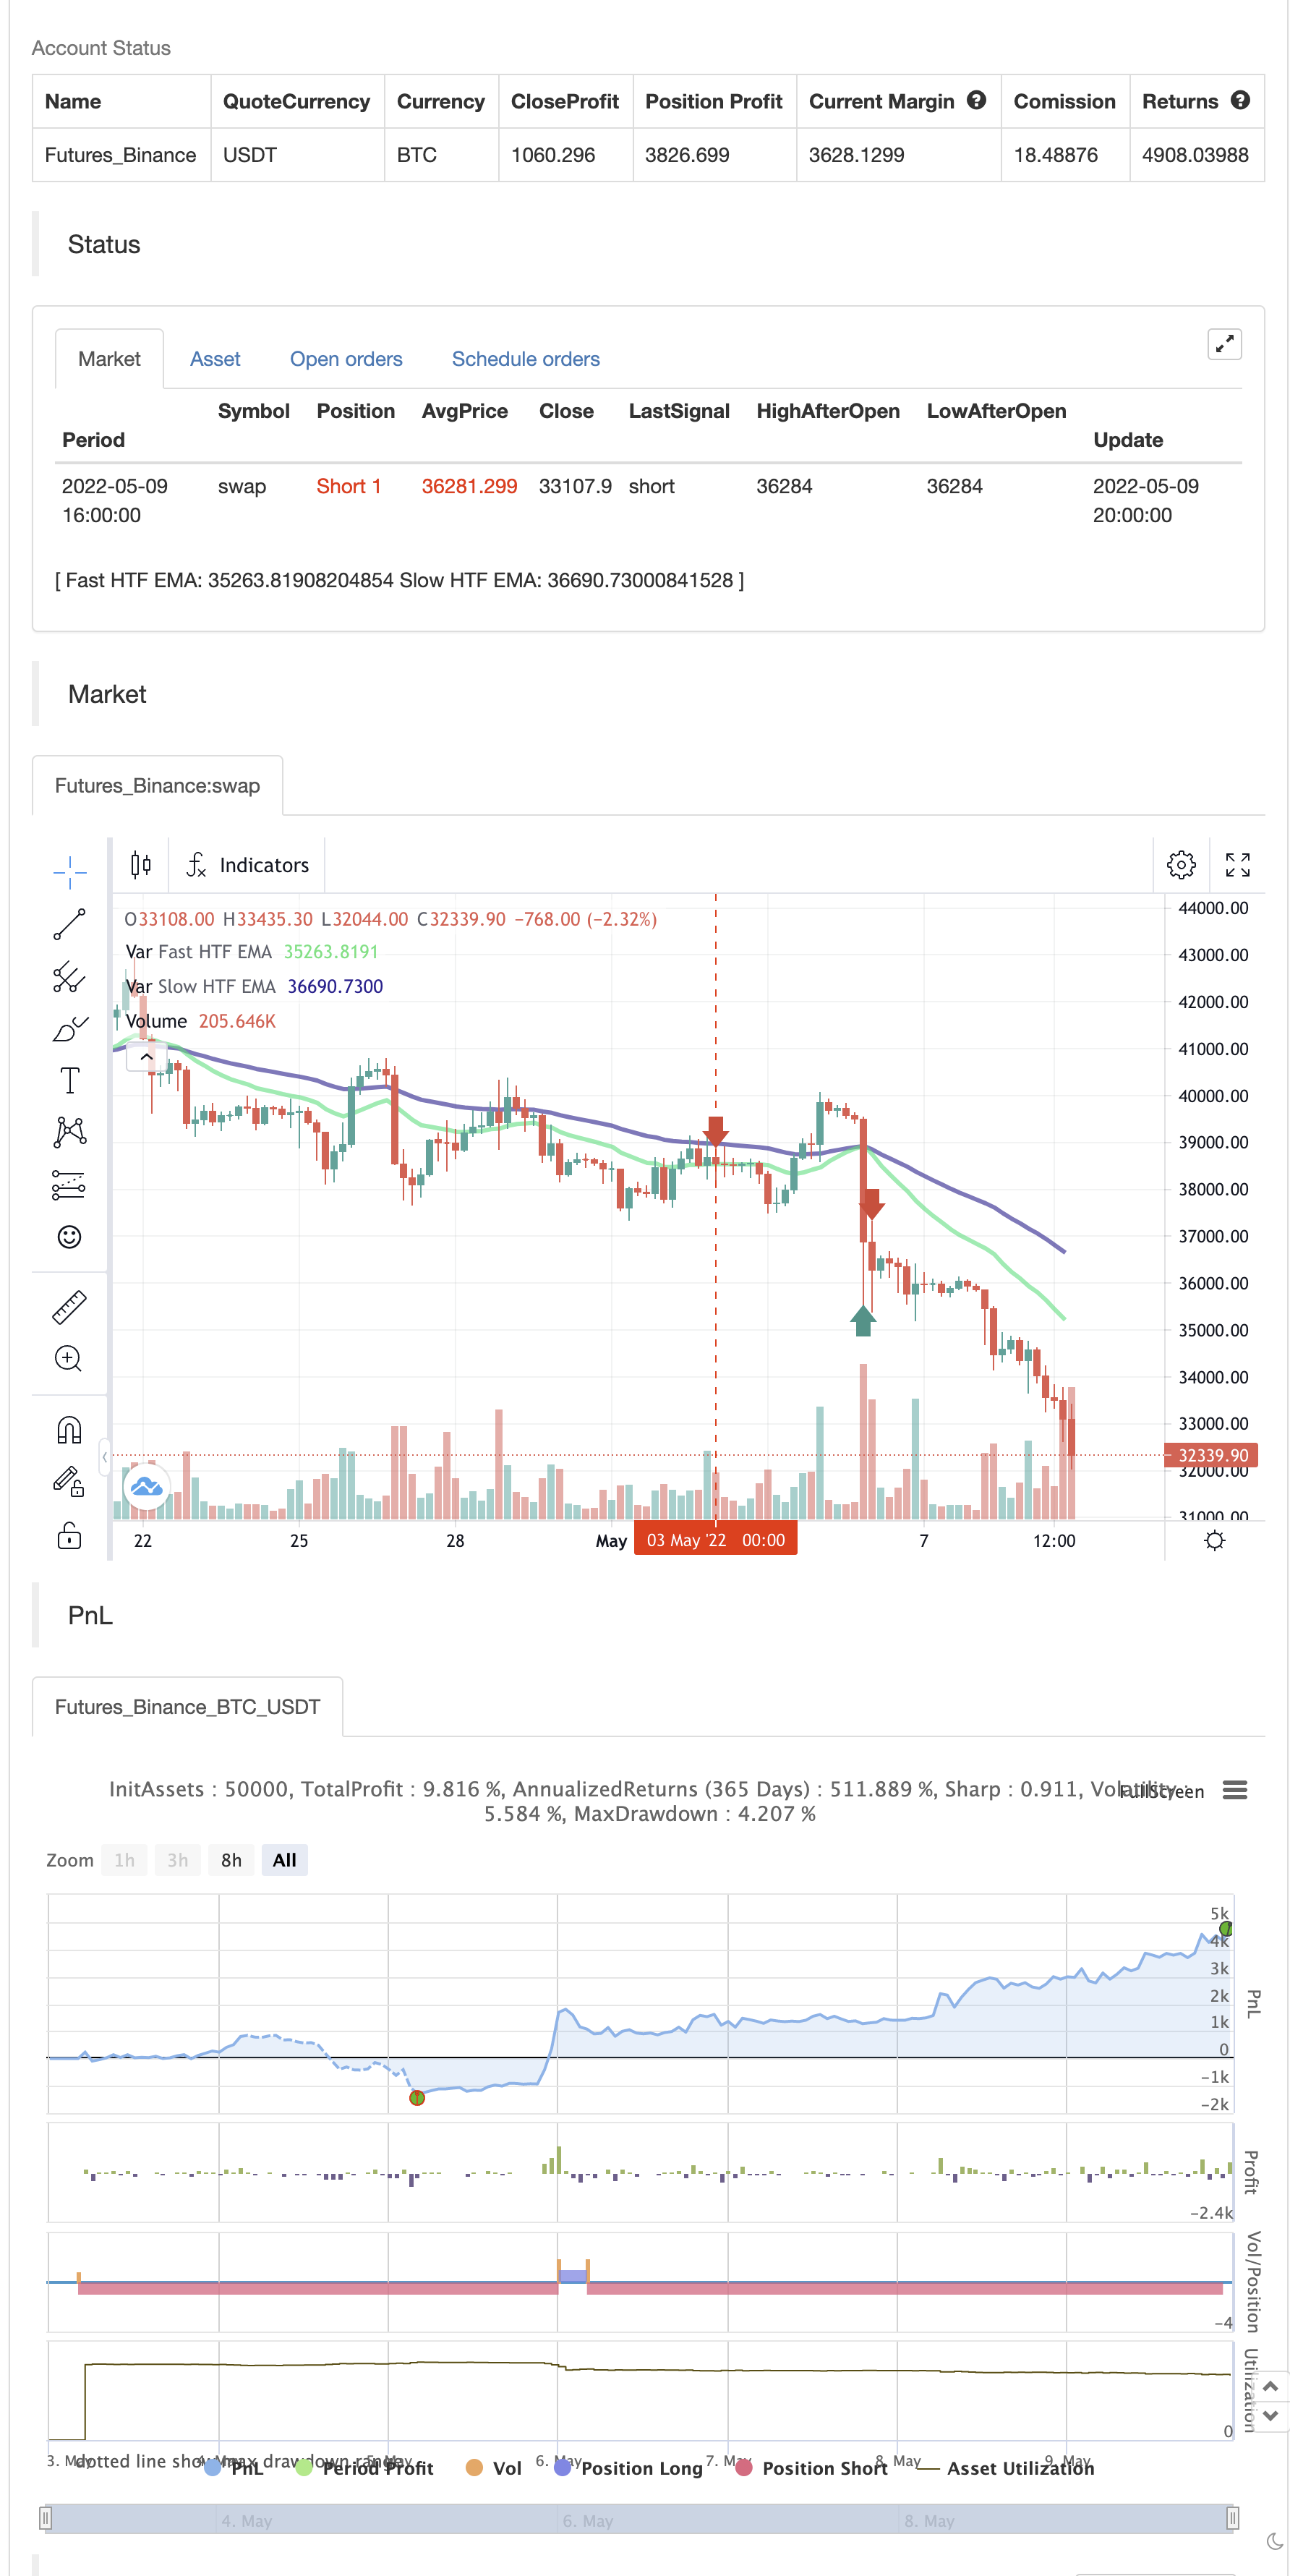
Chỉ số Swing High/Low với xác nhận MACD và EMA của KaizenTraderB
Tôi đã thiết kế chỉ số này để sử dụng với một chiến lược phá vỡ cấu trúc thị trường. Nó gắn nhãn các điểm cao và thấp được xác nhận bởi MACD. Nó cũng hiển thị một khung thời gian cao hơn EMA nhanh và chậm để xác định thiên vị hướng. Cũng cung cấp cảnh báo báo hiệu Swing Low phá vỡ trong xu hướng giảm và Swing High phá vỡ trong xu hướng tăng. Nó vẽ một đường ngang trên Swing High và Low cuối cùng.
Hiển thị chỉ số này trên khung thời gian nhập và chọn khung thời gian cao hơn trong cài đặt.
Bạn cũng có thể thay đổi thời gian xem lại cho Swing Highs và Lows và EMA
Khi tôi sử dụng điều này tôi đang tìm kiếm Swing High/Low break theo hướng HTF Trend Sau đó tìm kiếm sự rút lui giữa mức giá của sự phá vỡ và các khu vực thanh khoản (các dây thừng, khối lệnh, tắc nghẽn giá) để bước vào hướng xu hướng EMA.
backtest
/*backtest
start: 2022-05-03 00:00:00
end: 2022-05-09 23:59:00
period: 4h
basePeriod: 15m
exchanges: [{"eid":"Futures_Binance","currency":"BTC_USDT"}]
*/

// Swing High/Low Indicator w/ MACD and EMA Confirmations by KaizenTraderB
//
//I designed this indicator to be used with a market structure break strategy.
//It labels swing highs and lows that are confirmed by the MACD.
//It also displays a higher timeframe Fast and Slow EMA to determine directional bias.
//Also provides alerts that signal Swing Low breaks in downtrends and Swing High Breaks in uptrends.
//It draws a horizontal line on the last Swing High and Low.
//
//Display this indicator on your entry timeframe and choose your Higher Timeframe in settings.
//You can also change lookback period for Swing Highs and Lows and EMA's.
//
//@version=4
study("Swing High/Low Indicator w/ MACD and HTF EMA's", overlay=true)

barsback = input(5, title='Bars back to check for a swing')
showsig = input(true, title='Show Signal Markers')
res = input(title="EMA Timeframe", defval="240")
flen = input(title="Fast EMA Length", type=input.integer, defval=20)
slen = input(title="Slow EMA Length", type=input.integer, defval=50)
showema = input(title="Show EMA's", type=input.bool, defval=true)
showentry = input(title="Show Swing Break Entry Levels", type=input.bool, defval=true)

//HTF EMA's

fema = ema(close, flen)
sema = ema(close, slen)

rp_security(_symbol, _res, _src, _gaps, _lookahead) => security(_symbol, _res, _src[barstate.isrealtime ? 1 : 0], _gaps, _lookahead)

femaSmooth = rp_security(syminfo.tickerid, res, fema, barmerge.gaps_on, barmerge.lookahead_off)
semaSmooth = rp_security(syminfo.tickerid, res, sema, barmerge.gaps_on, barmerge.lookahead_off)
plot(showema ? femaSmooth : na,"Fast HTF EMA", color.lime, 3)
plot(showema ? semaSmooth : na,"Slow HTF EMA", color.navy, 3)

downtrend = femaSmooth < semaSmooth
uptrend = femaSmooth > semaSmooth

//Swing Highs and Lows
////////////////////////////////////////////////////////////////////////////////
//Thank you Backtest-Rookies.com for the Swing Detection Indicator code

swing_detection(index)=>
    swing_high = false
    swing_low = false
    start = (index*2) - 1 // -1 so we have an even number of
    swing_point_high = high[index]
    swing_point_low = low[index]

    //Swing Highs
    for i = 0 to start
        swing_high := true
        if i < index
            if high[i] > swing_point_high
                swing_high := false
                break
        // Have to do checks before pivot and after seperately because we can get
        // two highs of the same value in a row. Notice the > and >= difference
        if i > index
            if high[i] >= swing_point_high
                swing_high := false
                break

    //Swing lows
    for i = 0 to start
        swing_low := true
        if i < index
            if low[i] < swing_point_low
                swing_low := false
                break
        // Have to do checks before pivot and after seperately because we can get
        // two lows of the same value in a row. Notice the > and >= difference
        if i > index
            if low[i] <= swing_point_low
                swing_low := false
                break

    [swing_high, swing_low]

// Check for a swing
[swing_high, swing_low] = swing_detection(barsback)
////////////////////////////////////////////////////////////////////////////////

float swing_high_price = na
float swing_low_price = na

if swing_high
    swing_high_price := high[barsback]
if swing_low
    swing_low_price := low[barsback]

[macdline, signalline, histline] = macd(close,12,26,9)

macpos = histline[barsback] > 0
macneg = histline[barsback] < 0

// Plotting

SHPrice = "SH\n" + str.tostring(swing_high_price)
SLPrice = "SL\n" + str.tostring(swing_low_price)

if swing_high and macpos and showsig
    //SHLabel = label.new(bar_index[barsback], swing_high_price, SHPrice, xloc.bar_index, yloc.abovebar, color.red, label.style_arrowdown, textcolor=color.red, size=size.normal)
    //SHLine = line.new(bar_index[barsback], swing_high_price, bar_index[barsback] + 20, swing_high_price, xloc.bar_index, extend.none, color.black, width=2)
    //line.delete(SHLine[1])

if swing_low and macneg and showsig
    //label.new(bar_index[barsback], swing_low_price, SLPrice, xloc.bar_index, yloc.belowbar, color.green, label.style_arrowup, textcolor=color.green)
    //SLLine = line.new(bar_index[barsback], swing_low_price, bar_index[barsback] + 20, swing_low_price, xloc.bar_index, extend.none, color.black, width=2)
    //line.delete(SLLine[2])

//alerts
alertcondition(uptrend and close > swing_high_price, "Swing High Break in Uptrend", "Swing High Break!")
alertcondition(downtrend and close < swing_low_price, "Swing Low Break in Downtrend", "Swing Low Break!")

if uptrend
    strategy.entry("Enter Long", strategy.long)
else if downtrend
    strategy.entry("Enter Short", strategy.short)
- Chiến lược chéo EMA tăng cường với RSI/MACD/ATR
- Chiến lược giao dịch dài hạn kết hợp MACD và RSI
- Chiến lược kết hợp nhiều chỉ số (CCI, DMI, MACD, ADX)
- Xu hướng đa chỉ số theo chiến lược
- CCI, DMI và MACD Chiến lược ngắn hạn lai
- Lý thuyết sóng Elliott 4-9 Sóng xung phát hiện tự động Chiến lược giao dịch
- Chiến lược MACD Golden Cross và Death Cross
- MACD-V và Fibonacci Multi-Timeframe Dynamic Take Profit Strategy
- Chiến lược đột phá MACD BB
- Chiến lược theo xu hướng MACD tối ưu hóa với quản lý rủi ro dựa trên ATR
- Chiến lược ngắn dài ZeroLag MACD
- RSI và BB và đồng thời OverSold
- Quay nến Heikin Ashi
- Combo 2/20 EMA & Bandpass Filter
- ESSMA
- 3EMA
- Các khối thứ tự trục trục
- NMVOB-S
- Đường trung bình chuyển động màu EMA/SMA
- Nhóm MAHL
- 3 Tăng siêu xu hướng trong kịch bản duy nhất này
- Triple EMA + MACD
- Chơi trò chơi.
- Fractals nhỏ hơn (+ minh bạch)
- Các điểm nhập BB-RSI-ADX
- Hull-4ema
- Chỉ số đường dẫn theo góc tấn công
- KijunSen Line với Cross
- AMACD - Tất cả các trung bình chuyển động
- MA HYBRID BY RAJ
- Xu hướng kim cương