HALFTREND + HEMA + SMA (Chiến lược tín hiệu sai)
Tác giả:ChaoZhang, Ngày: 2022-05-12 17:36:04Tags:SMAWMAEMA
=== INTRO và CREDITS ===
Kịch bản này là sự kết hợp của 3 chỉ số để tái tạo chiến lược FALSE SIGNAL
=== Chiến lược === Cài đặt mặc định đã được như FALSE SIGNALs yêu cầu vì vậy bạn không cần phải thay đổi bất cứ điều gì. Đối với LONG (phía sau màu xanh lá cây cho thấy các mục LONG).
- HEMA phải ở trên SMA.
- Cơ thể của nến phải nằm hoàn toàn trên HEMA (wick có thể chạm vào HEMA, nhưng có một tùy chọn để bật / tắt bộ lọc này).
- Halftrend phải kích hoạt một mũi tên BUY (màu màu nước nhìn lên).
Đối với SHORTS (hình nền màu đỏ cho thấy các mục SHORT).
- HEMA* phải dưới SMA.
- Cơ thể của nến phải nằm hoàn toàn bên dưới HEMA (wick có thể chạm vào HEMA, nhưng có một tùy chọn để bật / tắt bộ lọc này).
- Halftrend phải kích hoạt một mũi tên SELL (màu cam nhìn xuống). * FALSE SIGNAL đề nghị thay đổi thời gian HEMA thành 40 cho quần ngắn thay vì 50.
Vui lòng kiểm tra kênh YouTube của FALSE SIGNAL để biết thêm thông tin.
=== Cải thiện chung === Nâng cấp lên PineScript 5. Một số cải tiến về hiệu suất. SMA có màu xanh lá cây khi chỉ có LONG nên được lấy, màu đỏ cho SHORTS. HEMA lấy màu AQUA khi chỉ có LONG nên được lấy, màu cam cho SHORTS.
=== Lưu ý cá nhân === Các khung thời gian dài (1h +) có thể mất nhiều thời gian để kích hoạt các mục nhập, hãy kiên nhẫn hoặc sử dụng các khung thời gian ngắn hơn.
Một lần nữa cảm ơn các tác giả của các chỉ số tạo nên kịch bản này và FALSE SINGAL để tạo ra chiến lược này.
backtest
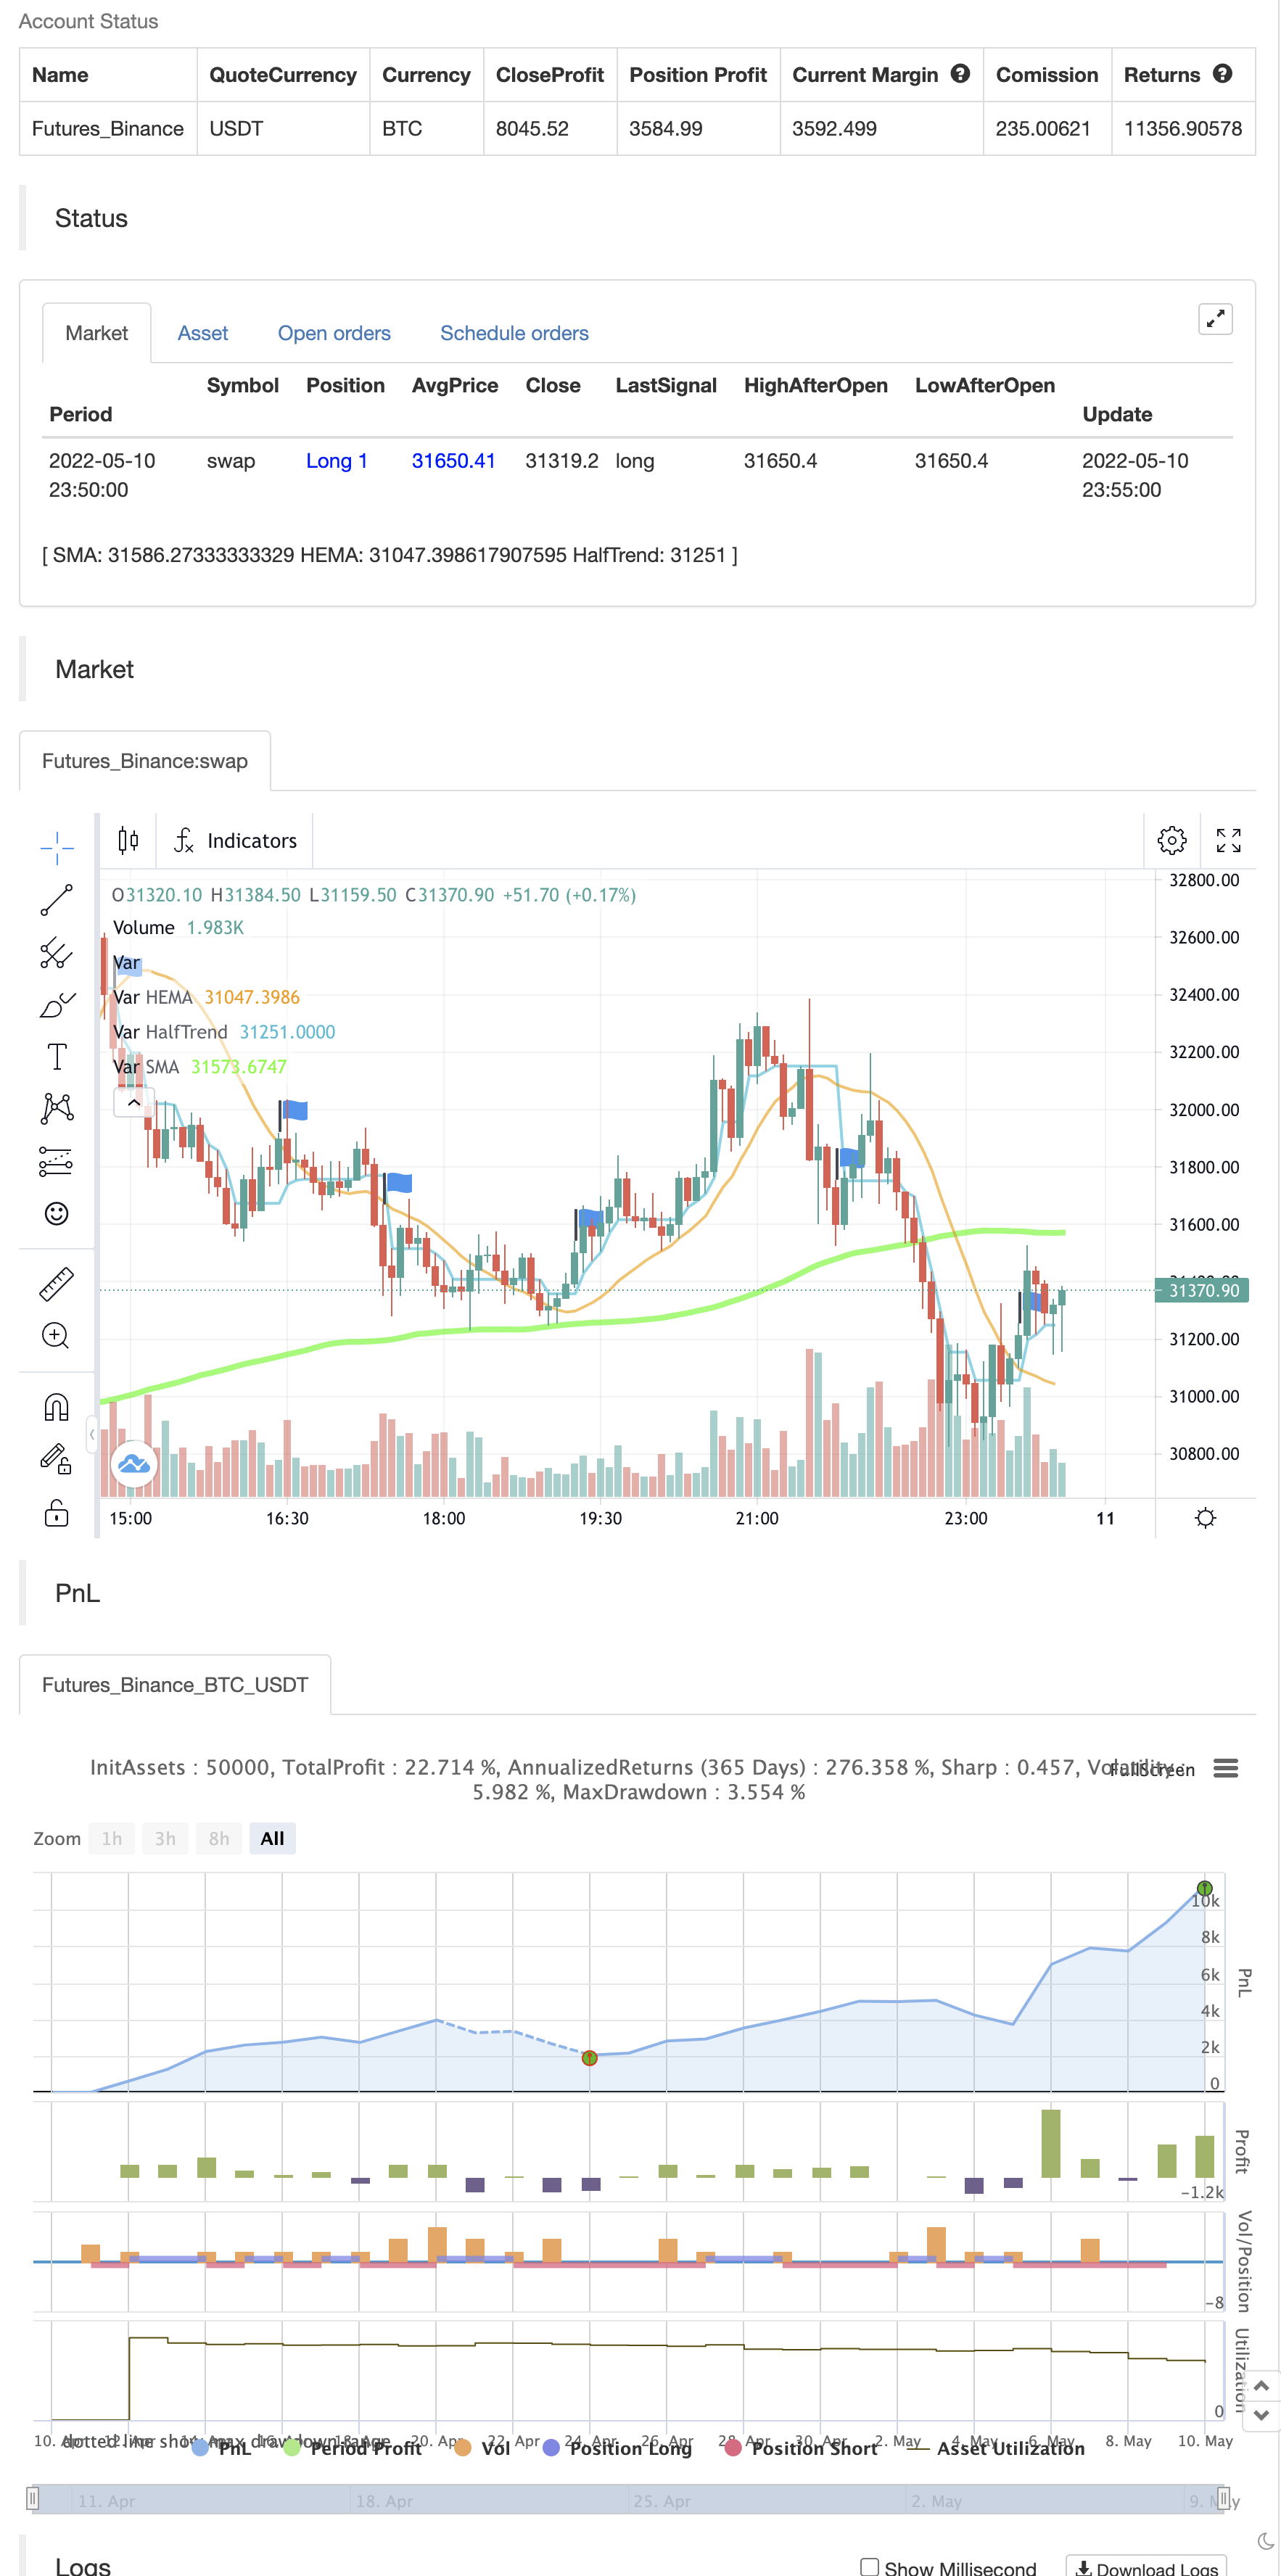
/*backtest
start: 2022-04-11 00:00:00
end: 2022-05-10 23:59:00
period: 5m
basePeriod: 1m
exchanges: [{"eid":"Futures_Binance","currency":"BTC_USDT"}]
*/

// Source code is subject to the terms of the Mozilla Public License 2.0 at https://mozilla.org/MPL/2.0/ - © José Manuel Gassin Pérez-Traverso
// Credit for each indicator belongs to its author.

//@version=5
indicator(title="HALFTREND + HEMA + SMA (FALSE SIGNAL)", shorttitle="HALFTREND + HEMA + SMA (FALSE SIGNAL)", overlay=true)


//== Constantes
c_negro               = color.rgb(0, 0, 0, 0)
c_verde_radiactivo    = color.rgb(0, 255, 0, 0)
c_verde               = color.rgb(0, 128, 0, 0)
c_verde_oscuro        = color.rgb(0, 80, 0, 0)
c_rojo_radiactivo     = color.rgb(255, 0, 0, 0)
c_rojo                = color.rgb(128, 0, 0, 0)
c_rojo_oscuro         = color.rgb(80, 0, 0, 0)
c_red_t               = color.new(color.red, 90)
c_amarillo            = color.rgb(255, 255, 0, 0)
noneColor             = color.new(color.white, 100)


//== Estrategia
GRUPO_ESTRATEGIA = "Strategy"
ESTRATEGIA_vela_completa_fuera_hema = input.bool(title="Full candle must be outside the HEMA / Wicks can touch the HEMA but body must be out", defval=false, group=GRUPO_ESTRATEGIA)

//== Simple Moving Average (SMA)
GRUPO_SMA = "Simple Moving Average (SMA)"
len = input.int(150, minval=1, title="Length", group=GRUPO_SMA)
src = input(close, title="Source", group=GRUPO_SMA)
offset = input.int(title="Offset", defval=6, minval=-500, maxval=500, group=GRUPO_SMA)
sma = ta.sma(src, len)


//== Hull Estimate (HEMA) - Source code is subject to the terms of the Mozilla Public License 2.0 at https://mozilla.org/MPL/2.0/ - © alexgrover
GRUPO_HEMA = "Hull Estimate (HEMA)"
length = input.int(title="Length", defval=50, minval=1, group=GRUPO_HEMA)
hema = 3 * ta.wma(close, length / 2) - 2 * ta.ema(close, length / 2)


//== HALFTREND - Copyright (c) 2021-present, Alex Orekhov (everget)
GRUPO_HT = "Halftrend"
amplitude = input(title='Amplitude', defval=1, group=GRUPO_HT)
channelDeviation = input(title='Channel Deviation', defval=2, group=GRUPO_HT)
showArrows = input(title='Show Arrows', defval=true, group=GRUPO_HT)
showChannels = input(title='Show Channels', defval=false, group=GRUPO_HT)

var int trend = 0
var int nextTrend = 0
var float maxLowPrice = nz(low[1], low)
var float minHighPrice = nz(high[1], high)

var float up = 0.0
var float down = 0.0
float atrHigh = 0.0
float atrLow = 0.0
float arrowUp = na
float arrowDown = na

atr2 = ta.atr(100) / 2
dev = channelDeviation * atr2

highPrice = high[math.abs(ta.highestbars(amplitude))]
lowPrice = low[math.abs(ta.lowestbars(amplitude))]
highma = ta.sma(high, amplitude)
lowma = ta.sma(low, amplitude)

if nextTrend == 1
    maxLowPrice := math.max(lowPrice, maxLowPrice)

    if highma < maxLowPrice and close < nz(low[1], low)
        trend := 1
        nextTrend := 0
        minHighPrice := highPrice
        minHighPrice
else
    minHighPrice := math.min(highPrice, minHighPrice)

    if lowma > minHighPrice and close > nz(high[1], high)
        trend := 0
        nextTrend := 1
        maxLowPrice := lowPrice
        maxLowPrice

if trend == 0
    if not na(trend[1]) and trend[1] != 0
        up := na(down[1]) ? down : down[1]
        arrowUp := up - atr2
        arrowUp
    else
        up := na(up[1]) ? maxLowPrice : math.max(maxLowPrice, up[1])
        up
    atrHigh := up + dev
    atrLow := up - dev
    atrLow
else
    if not na(trend[1]) and trend[1] != 1
        down := na(up[1]) ? up : up[1]
        arrowDown := down + atr2
        arrowDown
    else
        down := na(down[1]) ? minHighPrice : math.min(minHighPrice, down[1])
        down
    atrHigh := down + dev
    atrLow := down - dev
    atrLow

ht = trend == 0 ? up : down

var color buyColor = color.aqua
var color sellColor = color.orange

htColor = trend == 0 ? buyColor : sellColor

buySignal = not na(arrowUp) and trend == 0 and trend[1] == 1
sellSignal = not na(arrowDown) and trend == 1 and trend[1] == 0


//== Plots
// SMA
sma_color = ohlc4 > sma ? c_verde_radiactivo : c_rojo_radiactivo
plot(sma, title="SMA", color=sma_color, linewidth=4, offset=offset)

// HEMA
hema_color = hema > sma ? color.aqua : color.orange
plot(hema, title="HEMA", color=hema_color, linewidth=2)

// HALFTREND
htPlot = plot(ht, title='HalfTrend', linewidth=2, color=htColor, display=display.none)
atrHighPlot = plot(showChannels ? atrHigh : na, title='ATR High', style=plot.style_circles, color=color.new(sellColor, 0))
atrLowPlot = plot(showChannels ? atrLow : na, title='ATR Low', style=plot.style_circles, color=color.new(buyColor, 0))
fill(htPlot, atrHighPlot, title='ATR High Ribbon', color=color.new(sellColor, 90))
fill(htPlot, atrLowPlot, title='ATR Low Ribbon', color=color.new(buyColor, 90))
plotshape(showArrows and buySignal ? atrLow : na, title='Arrow Up', style=shape.triangleup, location=location.absolute, size=size.tiny, color=color.new(buyColor, 0))
plotshape(showArrows and sellSignal ? atrHigh : na, title='Arrow Down', style=shape.triangledown, location=location.absolute, size=size.tiny, color=color.new(sellColor, 0))

//== Señales estrategia
min = ESTRATEGIA_vela_completa_fuera_hema ? low : math.min(open, close)
max = ESTRATEGIA_vela_completa_fuera_hema ? high : math.max(open, close)
long_sma_y_hema  = hema > sma
short_sma_y_hema = hema < sma
long_halftrend   = buySignal
short_halftrend  = sellSignal
long_vela        = min > hema and max > hema
short_vela       = min < hema and max < hema
long = long_sma_y_hema and long_halftrend and long_vela
short = short_sma_y_hema and short_halftrend and short_vela
color_fondo = long ? color.new(color.lime, 85) : short ? color.new(color.red, 80) : noneColor
bgcolor(color_fondo)


//== Alertas
alertcondition(long, title="▶ LONG", message="[{{exchange}}:{{ticker}}] LONG ENTRY")
alertcondition(short, title="▶ SHORT", message="[{{exchange}}:{{ticker}}] SHORT ENTRY")


if long
    strategy.entry("Enter Long", strategy.long)
else if short
    strategy.entry("Enter Short", strategy.short)
- RedK Dual VADER với thanh năng lượng
- Chiến lược giao dịch định lượng dựa trên đường trung bình động và băng Bollinger
- Cảnh báo chéo trung bình chuyển động, nhiều khung thời gian (MTF)
- Tỷ lệ năng lượng hướng tăng tốc theo khối lượng RedK
- Rainbow Oscillator
- RedK Momentum Bars
- ESSMA
- Super Scalper
- SuperJump quay lại Bollinger Band
- MACD thông minh hơn
- KLineChart Demo
- Chiến lược siêu xu hướng Villa Dynamic Pivot
- Crodl's Supertrend
- RSI của zdmre
- FTL - Range Filter X2 + EMA + UO
- BRAHMASTRA
- Nhóm nhạc Mobo
- SAR + 3SMMA với SL & TP
- SSS
- Mô hình cảnh báo phóng mặt trăng [Dấu hiệu]
- RSI Divergence với Pivot, BB, SMA, EMA, SMMA, WMA, VWMA
- RSI và BB và đồng thời OverSold
- Quay nến Heikin Ashi
- Combo 2/20 EMA & Bandpass Filter
- ESSMA
- 3EMA
- Các khối thứ tự trục trục
- NMVOB-S
- Đường trung bình chuyển động màu EMA/SMA
- Nhóm MAHL