Chiến lược giao dịch nhiều khung thời gian dựa trên RSI và đường trung bình động

Tổng quan
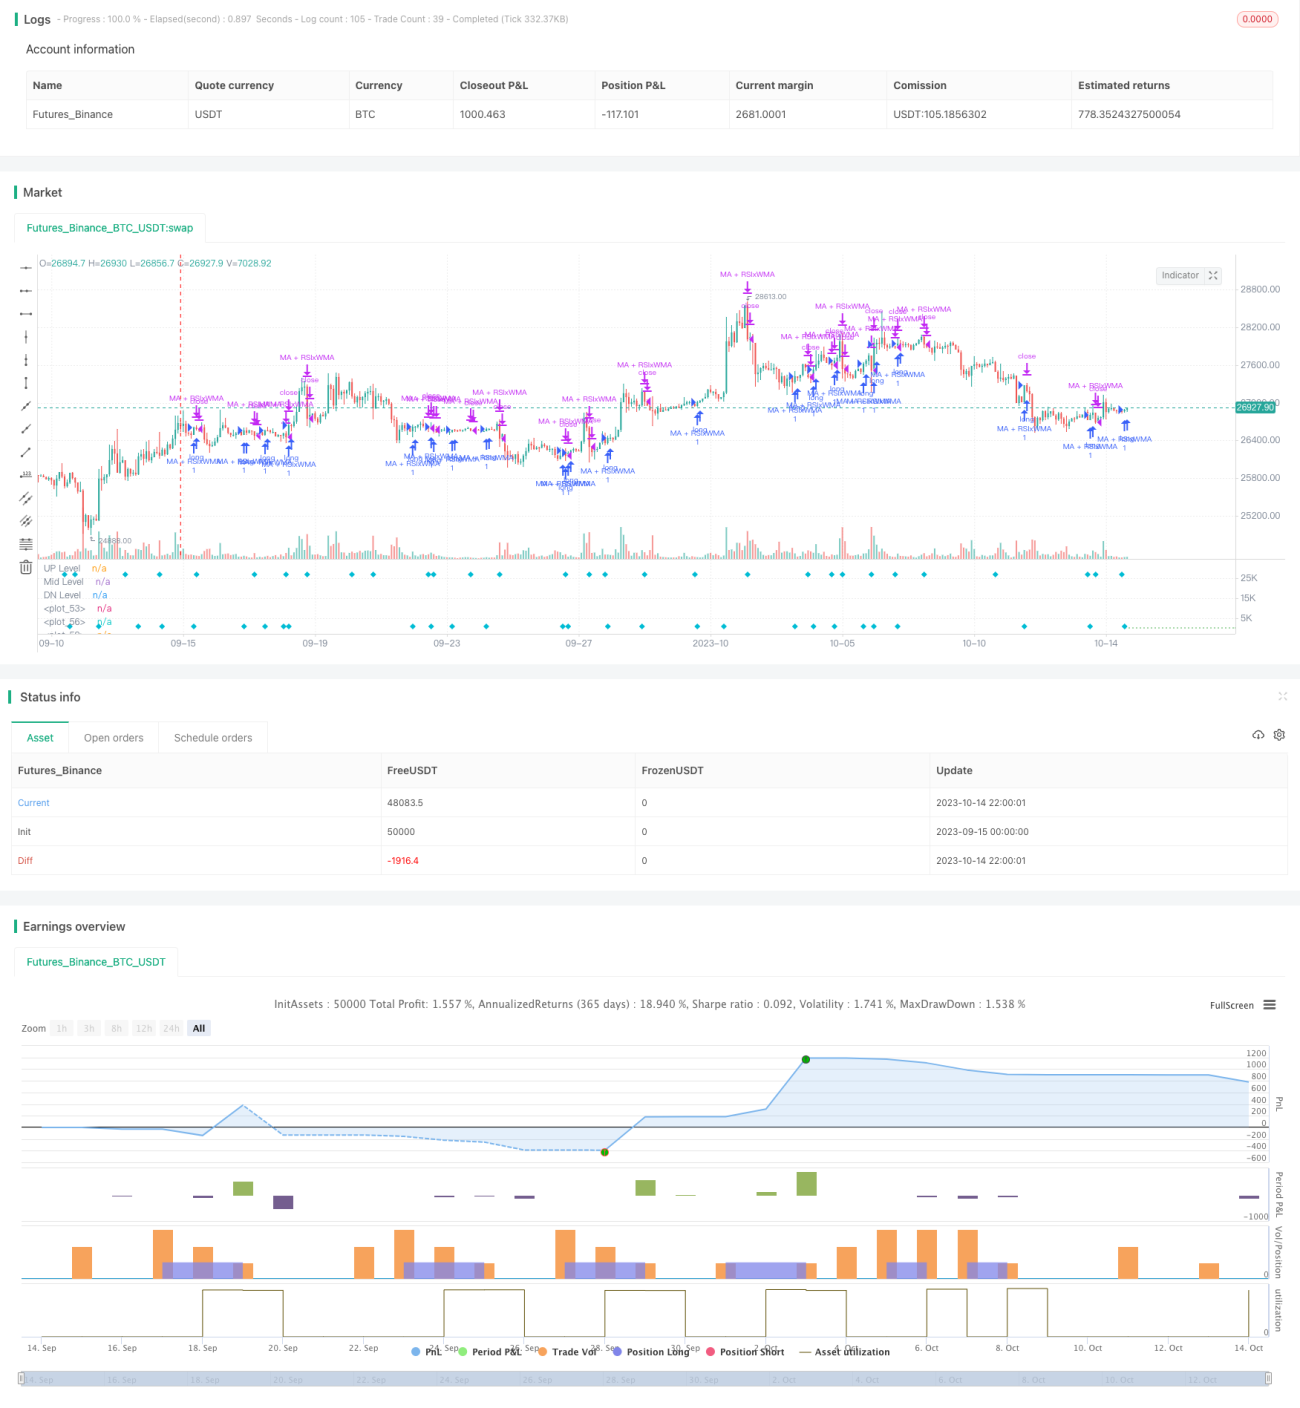
Ý tưởng cốt lõi của chiến lược này là sử dụng chỉ số tương đối mạnh (RSI) và trung bình di chuyển trong các chu kỳ thời gian khác nhau để xác định điểm đảo ngược xu hướng, để bắt được xu hướng đường dài và đường ngắn. Chiến lược này tổng hợp nhiều tín hiệu giao dịch nhằm tăng tỷ lệ thành công của giao dịch.
Nguyên tắc chiến lược
- Tính toán chỉ số RSI, cũng như đường EMA nhanh và đường trung bình di chuyển WMA chậm.
- Khi đường chỉ số RSI phá vỡ đường trung bình di chuyển WMA, nó tạo ra tín hiệu mua / bán.
- Khi đường nhanh EMA vượt qua đường chậm WMA, nó tạo ra tín hiệu mua/bán.
- Khi RSI và EMA cùng phá vỡ WMA, tạo ra tín hiệu mua/bán mạnh mẽ.
- Đồng thời, tín hiệu chính có thể được tăng cường khi giá phá vỡ đường trung bình di chuyển hỗ trợ.
- Thiết lập các điều kiện dừng lỗ.
Chiến lược này tổng hợp các tín hiệu đột phá của nhiều chỉ số kỹ thuật, các đường trung bình di chuyển với các tham số khác nhau để xác định xu hướng trong các chu kỳ khác nhau, do đó tăng độ tin cậy của chiến lược. Chỉ số RSI đánh giá tình trạng quá mua quá bán, đường nhanh EMA đánh giá xu hướng ngắn hạn, đường chậm WMA đánh giá xu hướng trung hạn, giá cả và trung bình hỗ trợ của xu hướng xác nhận đột phá.
Phân tích lợi thế
- Sử dụng tính năng đảo ngược của chỉ số RSI, bạn có thể nắm bắt cơ hội đảo ngược trong khu vực quá mua quá bán.
- Các trung bình di chuyển phụ trợ như một bộ lọc xu hướng, tránh phá vỡ giả.
- Kết hợp nhiều chu kỳ thời gian, bạn có thể theo dõi xu hướng đường dài và nắm bắt cơ hội đường ngắn.
- Các tín hiệu tổng hợp từ nhiều chỉ số có thể giúp tăng tỷ lệ giao dịch thành công.
- Thiết lập chiến lược dừng lỗ để chủ động kiểm soát rủi ro.
Phân tích rủi ro
- Chỉ số RSI dễ tạo ra các tín hiệu giả và cần lọc trung bình di chuyển hỗ trợ.
- Một sự hồi phục trong xu hướng chu kỳ lớn có thể gây ra tín hiệu giao dịch ngược và cần được xử lý thận trọng.
- Cần thiết lập các tham số tối ưu hóa, chẳng hạn như độ dài chu kỳ RSI, chu kỳ trung bình di chuyển.
- Cần cẩn thận khi thiết lập điểm dừng để tránh bị mắc kẹt.
Rủi ro có thể được giảm thiểu bằng các phương pháp như tối ưu hóa tham số, chiến lược dừng lỗ nghiêm ngặt và xem xét xu hướng chu kỳ lớn.
Hướng tối ưu hóa
- Tối ưu hóa các tham số RSI để tìm ra độ dài chu kỳ tối ưu.
- Kiểm tra các loại moving average khác nhau.
- Thêm chỉ số biến động như ATR, động điều chỉnh điểm dừng lỗ.
- Thêm mô-đun quản lý khối lượng giao dịch.
- Sử dụng công nghệ học máy để tối ưu hóa tham số và đánh giá chất lượng tín hiệu.
Tóm tắt
Chiến lược này tích hợp theo dõi xu hướng và tư duy giao dịch đảo ngược cực điểm, thêm phân tích nhiều khung thời gian và sử dụng tổng hợp nhiều chỉ số để tăng tỷ lệ giao dịch. Điều quan trọng là kiểm soát rủi ro, tối ưu hóa cài đặt tham số và xem xét tác động của xu hướng chu kỳ lớn đối với giao dịch.
- 1