Chiến lược theo dõi xu hướng dải Bollinger trung bình động kép
Tổng quan
Chiến lược này dựa trên đường trung bình kép của Brin để đưa ra quyết định giao dịch theo xu hướng. Nó sử dụng sự kết hợp và phân tán của Brin để đánh giá sự thay đổi xu hướng, mua gần đường ray bên dưới của Brin, bán gần đường ray trên, mua thấp và bán cao, và đi ra ngoài với lợi nhuận.
Nguyên tắc chiến lược
Chiến lược này sử dụng cả hai phiên bản Brinband đơn giản và Brinband tăng cường.
Brin đơn giản sử dụng giá đóng cửa để tính toán đường trung tâm SMA và Brin tăng cường sử dụng giá đóng cửa để tính toán đường trung tâm EMA.
Các quỹ đạo trên và dưới được tính toán thông qua chênh lệch chuẩn ± N lần của quỹ đạo trung tâm.
Chiến lược này đánh giá xu hướng dựa trên khoảng cách giữa đường ray trên và dưới của Brin và khi spread nhỏ hơn ngưỡng thiết lập, nó cho thấy đang đi vào phạm vi xu hướng và có thể giao dịch theo xu hướng.
Cụ thể, mua nhiều khi giá gần đường đi xuống, bán tháo khi gần đường đi lên. Phương thức dừng là xác định tỷ lệ dừng, và có thể chọn bật theo dõi dừng.
Lợi nhuận mục tiêu phụ thuộc vào việc chọn vị trí yên ở giữa hoặc gần đường ray trên.
Chiến lược này cũng có thể chọn bán chỉ khi đảm bảo lợi nhuận và tránh thua lỗ.
Phân tích lợi thế
Chiến lược này có những ưu điểm sau:
- Tăng hiệu quả trong việc đưa ra quyết định
Ứng dụng băng thông đơn giản và băng thông tăng cường, có thể so sánh hiệu quả của hai loại băng thông, chọn phiên bản tốt hơn, cải thiện hiệu quả ra quyết định.
- Mức độ của xu hướng dựa trên chiều rộng của đường băng thông Brin
Khi các kênh của vòng Brin bị thu hẹp, nghĩa là bước vào một xu hướng, thì tỷ lệ giao dịch theo xu hướng sẽ cao hơn.
- Phương pháp dừng lỗ linh hoạt
Sử dụng dừng phần trăm cố định để kiểm soát tổn thất đơn lẻ. Ngoài ra, có thể chọn dừng ở giữa đường ray hoặc gần đường ray trên, và bật dừng theo dõi để khóa thêm lợi nhuận.
- Cơ chế bảo vệ chống thua lỗ
Chỉ bán với điều kiện đảm bảo lợi nhuận, có thể ngăn chặn sự gia tăng lỗ.
Phân tích rủi ro
Chiến lược này cũng có những rủi ro sau:
- Rủi ro rút lui
Theo xu hướng, giao dịch tự nó có một số rủi ro rút lui, cần phải chịu đựng áp lực tâm lý của tổn thất liên tục.
- Rủi ro của động đất
Khi đường băng Bryn rộng hơn, thị trường có thể bị chấn động, và chiến lược này sẽ không hiệu quả và cần tạm dừng giao dịch để chờ xu hướng hình thành lại.
- Rủi ro bị kích hoạt
Việc dừng tỷ lệ phần trăm cố định có thể quá quyết liệt và cần được điều chỉnh thành các phương thức dừng nhẹ nhàng hơn như dừng ATR.
Hướng tối ưu hóa
Chiến lược này có thể được tối ưu hóa bằng cách:
- Tối ưu hóa tham số Brin
Có thể thử nghiệm các tham số đường trung bình khác nhau, số nhân chênh lệch chuẩn và tìm các tổ hợp tham số vòng Boolean phù hợp hơn cho các thị trường khác nhau.
- Bộ lọc kết hợp với các chỉ số khác
Các chỉ số MACD, KD và các chỉ số khác có thể được lọc dựa trên tín hiệu của Brin để giảm giao dịch trong thị trường xung đột.
- Tối ưu hóa chiến lược dừng lỗ
Có thể thử nghiệm các phương thức dừng động khác nhau hoặc tối ưu hóa điểm dừng dựa trên các chỉ số như Amplitude, ATR.
- Tối ưu hóa quản lý tài chính
Tối ưu hóa quản lý vị trí cho mỗi giao dịch và thử nghiệm các chiến lược bổ sung khác nhau.
Tóm tắt
Chiến lược này tích hợp các lợi thế của chỉ số đai Brin kép, theo dõi các giao dịch giảm và tăng trong thời gian có xu hướng, dựa trên mức độ xu hướng theo chiều rộng của kênh Brin. Đồng thời thiết lập cơ chế dừng lỗ khoa học để kiểm soát rủi ro. Chiến lược này có thể cải thiện sự ổn định hơn nữa bằng cách tối ưu hóa tham số và kết hợp với các bộ lọc của các chỉ số khác.
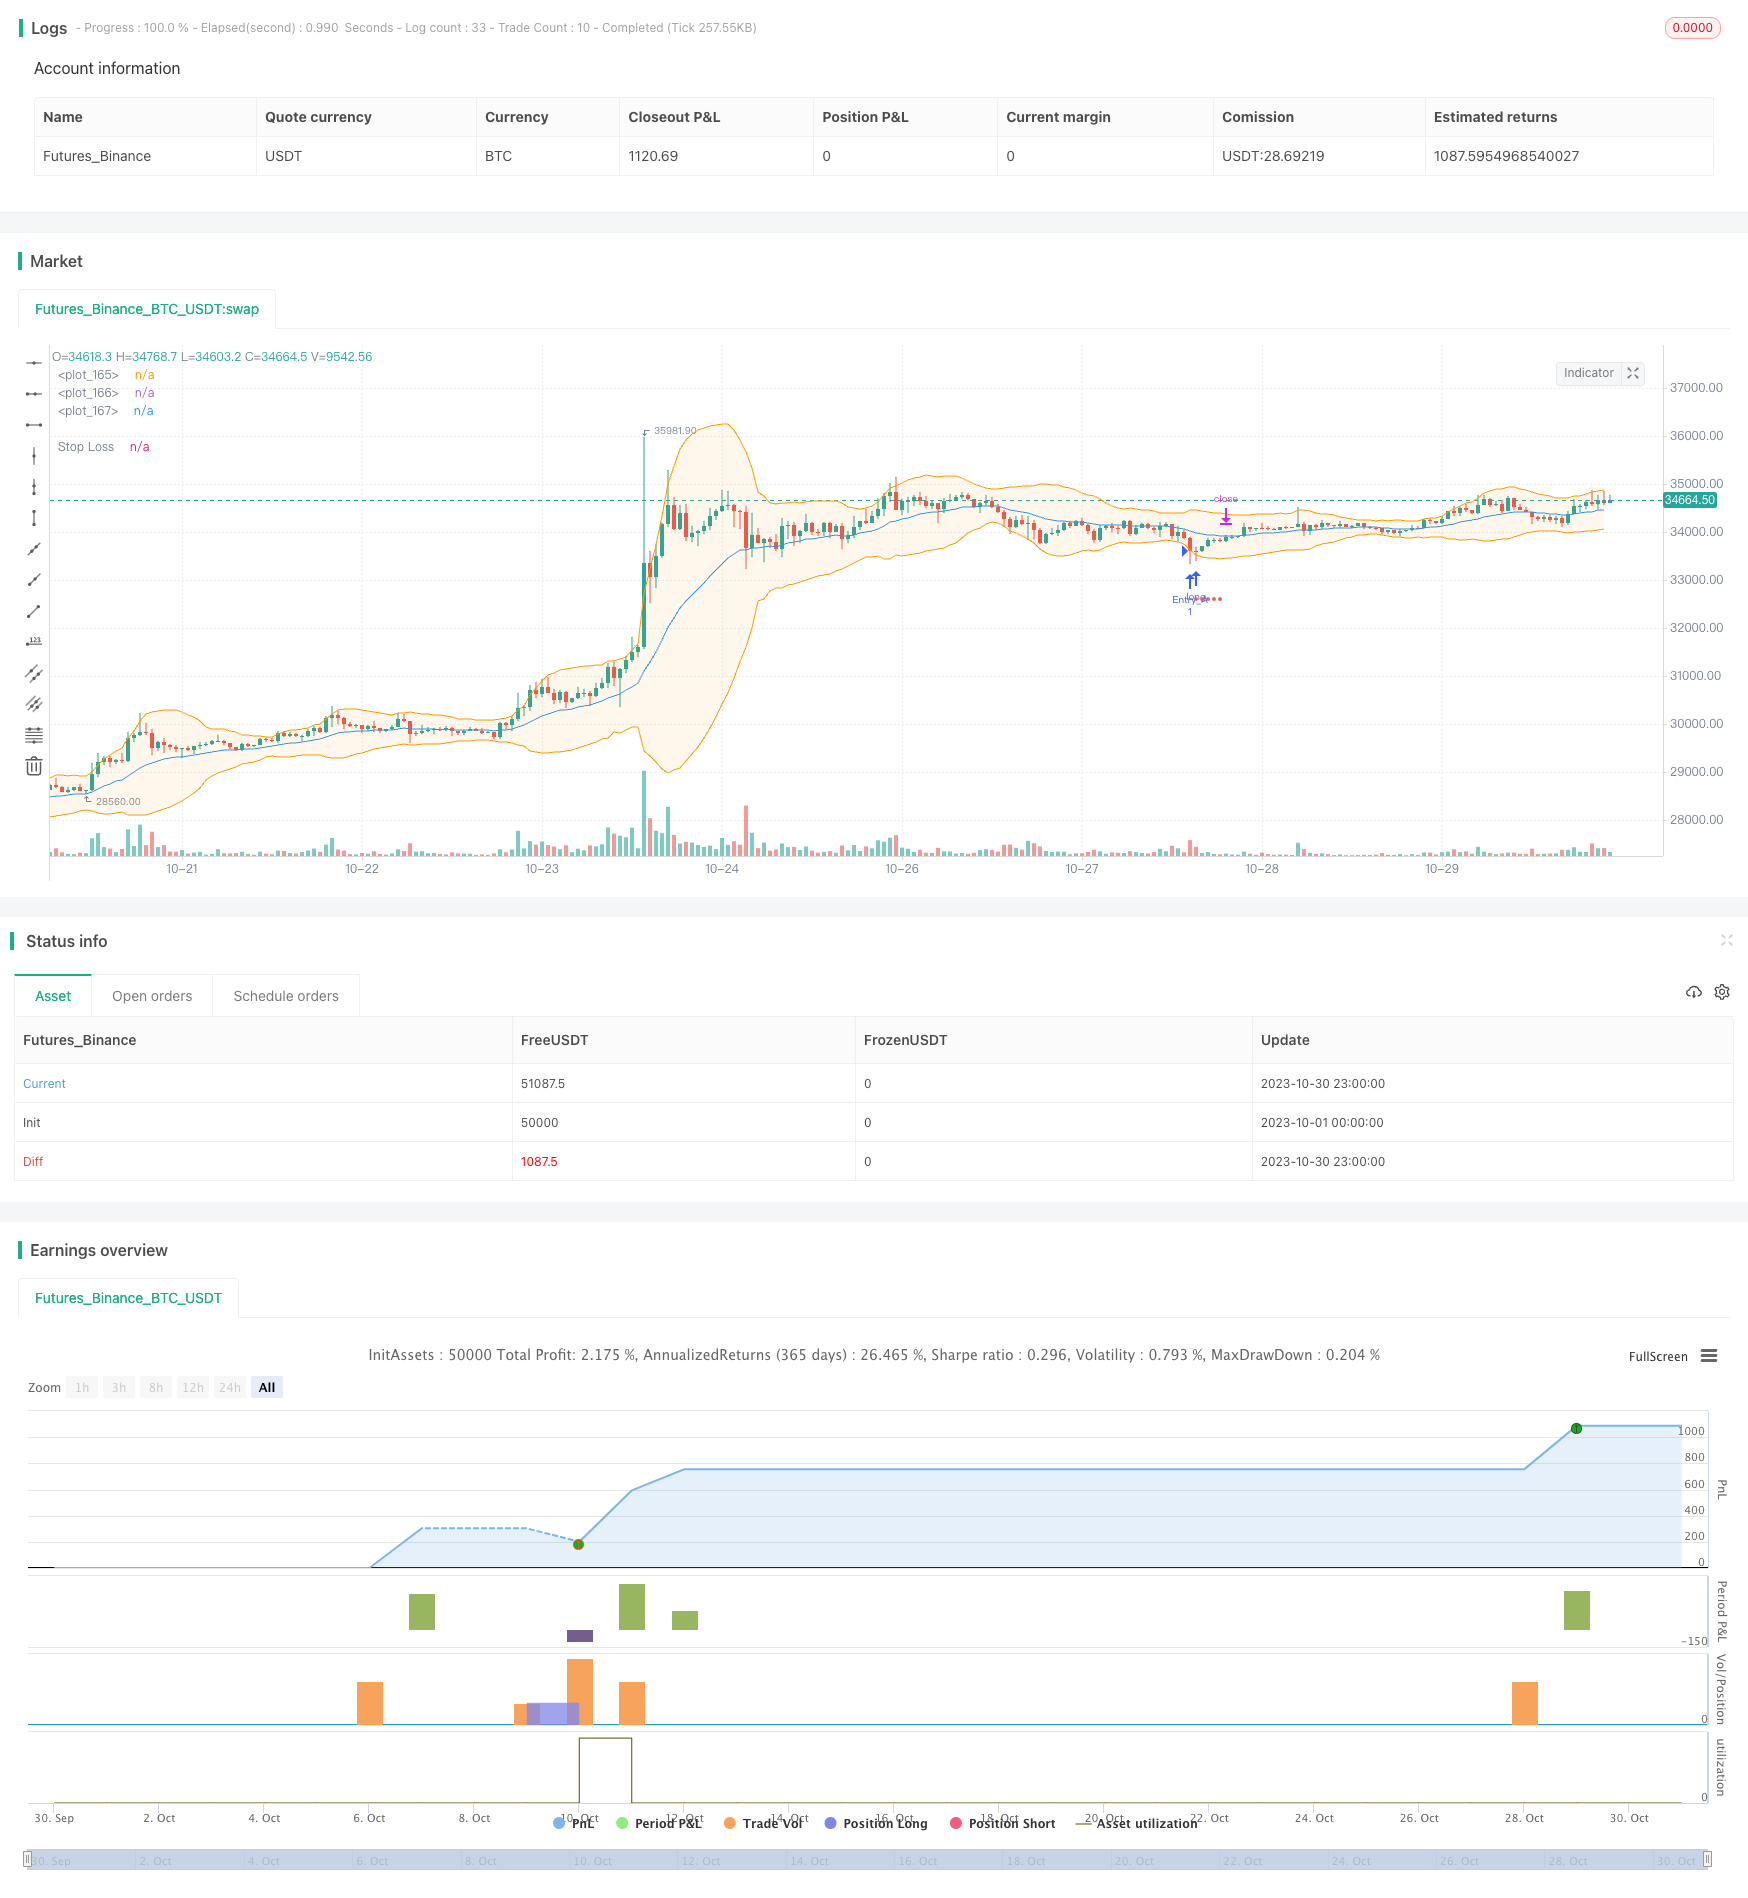
/*backtest
start: 2023-10-01 00:00:00
end: 2023-10-31 00:00:00
period: 1h
basePeriod: 15m
exchanges: [{"eid":"Futures_Binance","currency":"BTC_USDT"}]
*/

// This source code is subject to the terms of the Mozilla Public License 2.0 at https://mozilla.org/MPL/2.0/
// © JCGMarkets

//@version=4
strategy("B.Bands | Augmented | Intra-range | Long-Only", shorttitle = "BB|A|IR|L", initial_capital=5000, commission_value=0.075, slippage = 1, overlay = true)

//Technical Indicators Data
show_simp   = input(false, title="Trade on Simple Bollinger Bands ", type= input.bool, group="Select Strategy System")
show_augm   = input(true, title="Trade on Augmented Bollinger Bands", type= input.bool, group="Select Strategy System")
periods     = input(20, title="Periods for Moving Average", type =input.integer, minval = 2, step = 1, group="Technical Inputs")
std         = input(2, title="Std", type = input.float, minval=0.1 , step = 0.1, group="Technical Inputs")

// Strategy data
max_spread_bb   = input(20000.0, title="Max Spread Tolerance Beetween Bands", type=input.float, step=0.1, group="Strategy Inputs")
entry_source    = input(close, title="Entry data source", type=input.source, group="Strategy Inputs")
exit_source     = input(high, title="Exit data source", type=input.source, group="Strategy Inputs")
take_profit     = input("middle", title = "Profit to band:", options = ["middle", "opposite"], group="Strategy Inputs")
stop_loss       = input(3.00, title="Stop Loss %", type=input.float, step=0.05, group="Strategy Inputs")
trailing        = input(false, title="Activate trailing stop?", type = input.bool, group="Strategy Inputs")
stop_perc       = input(6.00, title="Trailing %", type=input.float, step=0.125, group="Strategy Inputs") * 0.01
sell_profit     = input(false, title="Only sell in profit (Stop Loss still active) ", type= input.bool, group="Strategy Inputs")


var SL = 0.0
var SLT= 0.0


//Simple BB Calculation -> adapt if needed with different std for upper-lower, sma-ema, etc
middle_sim = sma(close, periods)

//Augmented BB Calculation -> adapt if needed with different std for upper lower, etc
middle_augm  = ema(close, periods)
middle_upp = ema(high, periods)
middle_low = ema(low, periods)

//Multiplier
dev      = stdev(close, periods) * std

//Upper & Lower Bands
upper = (middle_sim + dev)
lower = (middle_sim - dev)

//Augmented Bands
upper_augm = (middle_upp + dev)
lower_augm = (middle_low - dev)

//Bands Spread
spread   = upper - lower
spread_augm   = upper_augm - lower_augm

//From date
filter_from    =   input(  true,    title="===> From", group="Date Control")
from_y         =   input(  2010,    title = "from year", group="Date Control")
from_m         =   input(     1,    title = "from month", minval =1, maxval=12, group="Date Control")
from_d         =   input(     1,    title = "from day",  minval=1, maxval=31, group="Date Control")

//To date
filter_to   =    input( true,   title="===> To", group="Date Control")
to_y        =    input( 2030,   title = "To year", group="Date Control")
to_m        =    input(    1,   title = "To month", minval =1, maxval=12, group="Date Control")
to_d        =    input(    1,  title = "To day",  minval=1, maxval=31, group="Date Control")

// Date Condition
In_date() =>  true

in_position = strategy.position_size > 0

// Trailing stop
SLT := if in_position and In_date()
    stop_inicial = entry_source * (1 - stop_perc)
    max(stop_inicial, SLT[1])
else
    0

slts = (low <= SLT) and (trailing == true)


//Essential Trade logics
entry_long = (entry_source <= lower) and (spread < max_spread_bb)
entry_long_augm = (entry_source <= lower_augm) and (spread_augm < max_spread_bb)

// Simple Bollinger Conditions

if (not in_position and show_simp and In_date())
    if entry_long
        // Trigger buy order
        position_size = round( strategy.equity / close ) // All available equity for this strategy example
        strategy.entry("Entry", strategy.long, qty = position_size )
        SL := close * (1 - (stop_loss / 100)) // You could determine wether or not implement stop loss with bool input and if condition here.


if in_position and show_simp and not sell_profit and In_date()
    //Exits if not sell in profit
    if take_profit == "middle"
        strategy.exit("Target", "Entry", limit = middle_sim, stop = SL, comment="Exit")
    if take_profit == "opposite"
        strategy.exit("Target", "Entry", limit = upper, stop = SL, comment="Exit")

if in_position and show_simp and sell_profit and In_date()
    //Exits if sell in profit
    if take_profit == "middle"
        strategy.exit("Target", "Entry", limit = (strategy.openprofit > 0 ? middle_sim: na), stop = SL, comment="Exit")
    if take_profit == "opposite"
        strategy.exit("Target", "Entry", limit = (strategy.openprofit > 0 ? upper: na), stop = SL, comment="Exit")


if in_position and show_simp and slts and In_date()
    //Trailing activation
    strategy.close("Entry", comment="SLT")

if not In_date()
    //Exit due out of date range
    strategy.close("Entry", comment="Out of date range")


// Augmented Bollinger Conditions

if (not in_position and show_augm and In_date())
    if entry_long_augm
        // Trigger buy order
        position_size = round( strategy.equity / close )
        strategy.entry("Entry_A", strategy.long, qty = position_size )
        SL := close * (1 - (stop_loss / 100) )

if in_position and show_augm and not sell_profit and In_date()
    //Exits and not sell in profit
    if take_profit == "middle"
        strategy.exit("Target", "Entry_A", limit = middle_augm, stop = SL, comment="Exit")
    if take_profit == "opposite"
        strategy.exit("Target", "Entry_A", limit = upper_augm, stop = SL, comment="Exit")


if in_position and show_augm and sell_profit and In_date()
    //Exit only in profit
    if take_profit == "middle"
        strategy.exit("Target", "Entry_A", limit = (strategy.openprofit > 0 ? middle_augm:na), stop = SL, comment="Exit")
    if take_profit == "opposite"
        strategy.exit("Target", "Entry_A", limit = (strategy.openprofit > 0 ? upper_augm: na) , stop = SL, comment="Exit")


if in_position  and show_augm and slts and In_date()
    //Trigger trailing
    strategy.close("Entry_A", comment="SLT")

if not In_date()
    //Out of date trigger
    strategy.close("Entry_A", comment= "Out of date range")


// Plotting

plot(in_position ? SL > 0 ? SL : na : na , style = plot.style_circles, color = color.red, title = "Stop Loss")
plot(in_position ? trailing ? SLT > 0 ? SLT : na : na : na , style = plot.style_circles, color = color.blue, title = "Trailing Stop" )

s = plot(show_simp ? upper : na , color = color.aqua)
plot(show_simp ? middle_sim : na , color=color.red)
i = plot(show_simp ? lower : na , color = color.aqua)
fill(s,i, color=color.new(color.aqua,90))


plot(show_augm ? middle_augm : na , color=color.blue)
s_a = plot( show_augm ? upper_augm : na, color=color.orange)
i_a = plot( show_augm ? lower_augm : na, color= color.orange)
fill(s_a,i_a, color=color.new(color.orange, 90))