Chiến lược Microphone Falling Apart và Multi Time Frame Moving Average


Ngày tạo: 2023-11-01 16:37:17 sửa đổi lần cuối: 2023-11-01 16:37:17
sao chép: 2 Số nhấp chuột: 737
1
tập trung vào
1617
Người theo dõi

Chiến lược Microphone Falling Apart và Multi Time Frame Moving Average

Tổng quan

Chiến lược này kết hợp các chỉ số MACD và đường trung bình của nhiều khung thời gian để tạo thành một chiến lược giao dịch hai chiều dài và ngắn sử dụng tổng hợp xu hướng và tín hiệu đảo ngược xu hướng. Chiến lược này có thể lấy thêm lợi nhuận trong tình huống xu hướng, đồng thời cũng có thể nắm bắt cơ hội đảo ngược.

Nguyên tắc chiến lược

  1. Sử dụng hai nhóm EMA có chu kỳ khác nhau hợp tác với bộ lọc nhiều khung thời gian, để đánh giá chiều dài: 15 phút EMA nhanh cao hơn 1 giờ EMA chậm là bộ lọc giảm giá, 15 phút EMA nhanh thấp hơn 1 giờ EMA chậm là bộ lọc giảm giá.

  2. Khi quan sát ra sự lệch của khung microphone, phán đoán có thể bị đảo ngược.

  3. Khi xem bộ lọc mở, nếu thấy thị trường bò lệch ra ((giá mới cao và MACD không sáng tạo cao), chờ MACD trên trục 0 đi, làm nhiều; khi xem bộ lọc mở, nếu thấy thị trường gấu lệch ra ((giá mới thấp và MACD không sáng tạo thấp), chờ MACD đi dưới trục 0 đi, làm trống.

  4. Phương pháp dừng là loại dừng theo dõi liên tục, được tính dựa trên phạm vi biến động giá cao nhất và thấp nhất.

  5. Khi MACD trục trục xảy ra ngang khi đi qua hướng trục số không.

Phân tích lợi thế

  1. Các cặp EMA đa khung thời gian có thể đánh giá xu hướng chu kỳ lớn, tránh giao dịch ngược.

  2. MACD có thể bắt được cơ hội đảo ngược giá, phù hợp với chiến lược đảo ngược.

  3. Động thái theo dõi dừng lỗ có thể khóa lợi nhuận và tránh thiệt hại mở rộng.

  4. Theo tính toán dừng lỗ, khoảng cách dừng có thể nhận được lợi nhuận dự kiến.

Phân tích rủi ro

  1. Nhóm EMA đồng đều làm việc như một bộ lọc, có thể xảy ra lỗi định hướng trong thời gian tính toán.

  2. MACD có thể không có lợi nhuận vì nó không có sự phục hồi đủ lớn.

  3. Khoảng cách dừng hỏng được thiết lập không đúng, có thể quá thoải mái hoặc quá chặt chẽ.

  4. Không có chỗ để quay lại, lợi nhuận bị hạn chế.

  5. Các nhà khoa học đã nghiên cứu về các nguyên nhân gây ra sự cố, và các nhà khoa học đã nghiên cứu về các nguyên nhân gây ra sự cố.

Hướng tối ưu hóa

  1. Các EMA có thể được thử nghiệm với các kết hợp các tham số khác nhau để có được sự phán đoán xu hướng chính xác hơn.

  2. Bạn có thể cố gắng điều chỉnh các tham số MACD thành một tổ hợp tham số nhạy cảm hơn.

  3. Các thiết lập tỷ lệ dừng lỗ khác nhau có thể được thử nghiệm.

  4. Các điều kiện lọc bổ sung có thể được thêm vào để tránh rơi vào phản hồi giả. Ví dụ như thêm khung thời gian cao hơn để EMA đánh giá xu hướng toàn cầu.

  5. Có thể tối ưu hóa các điều kiện xác nhận chuyển đổi ngược để đảm bảo xu hướng đảo ngược đã đủ trưởng thành.

Tóm tắt

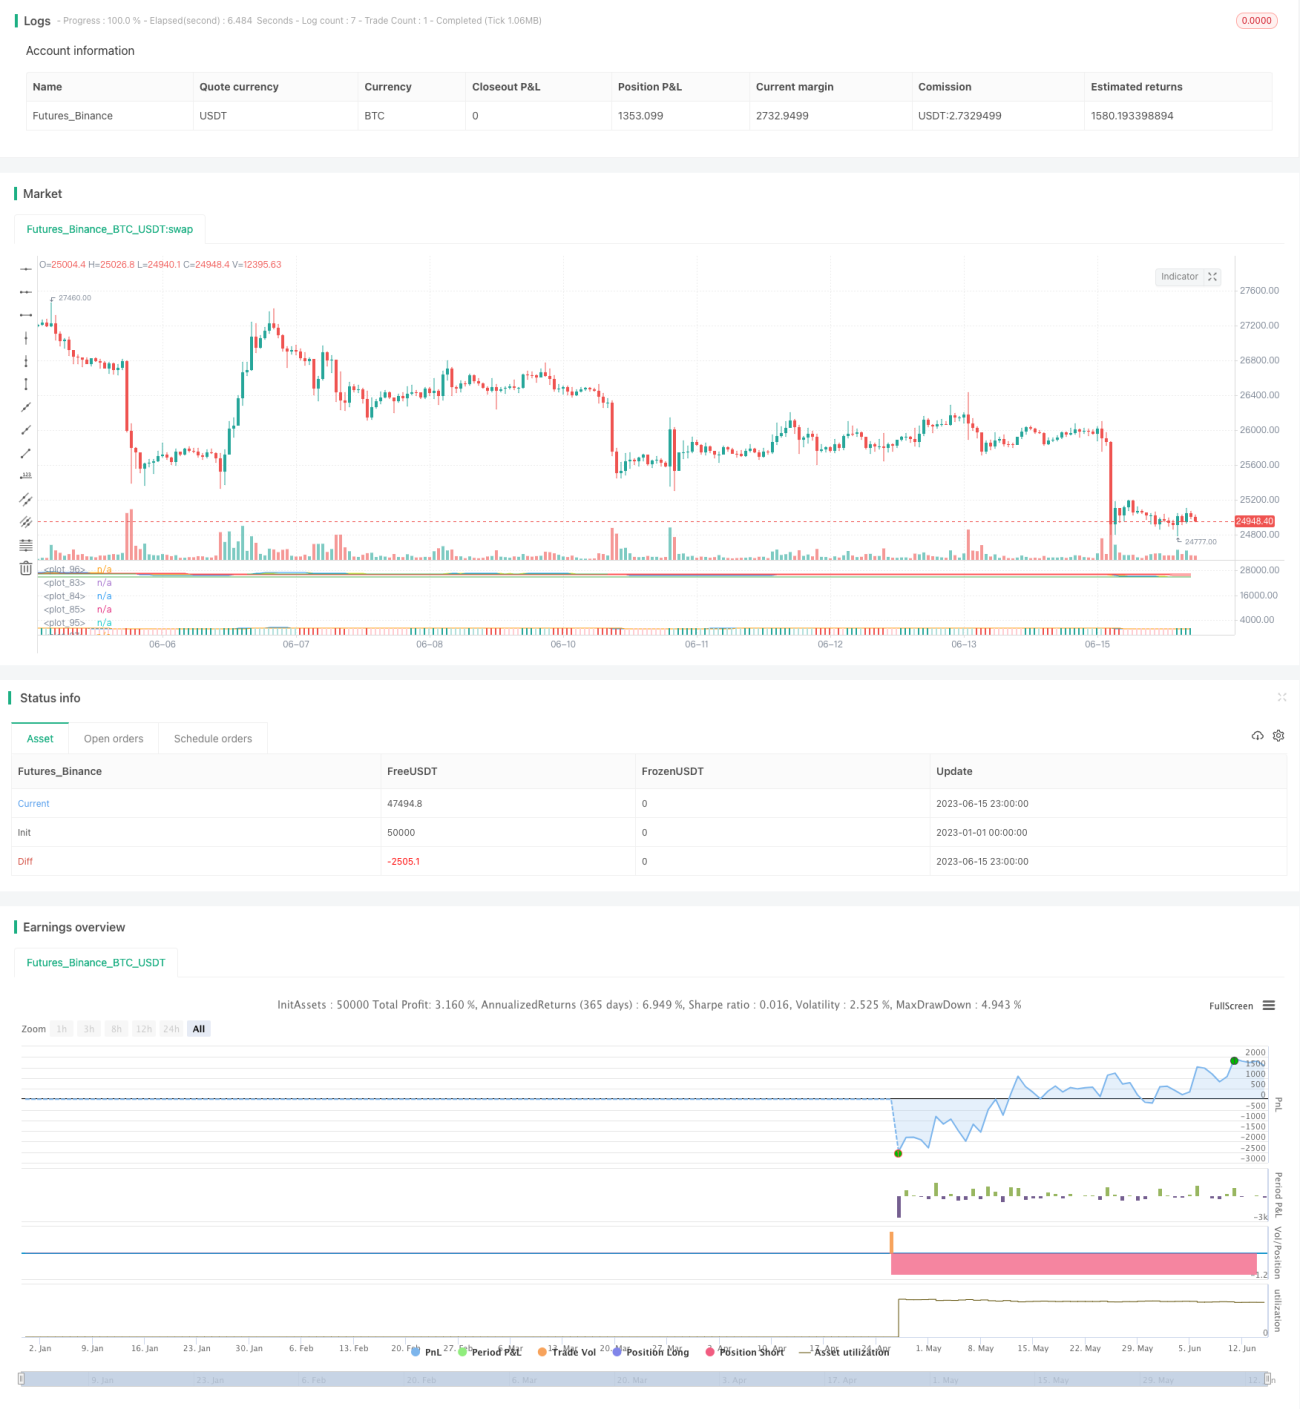
Chiến lược này tổng hợp các phương tiện như lọc xu hướng, tín hiệu đảo ngược xu hướng, quản lý dừng lỗ động, có thể làm theo trật tự, cũng có thể nắm bắt sự đảo ngược. Bằng cách điều chỉnh tham số và tối ưu hóa điều kiện lọc, có thể thích ứng với môi trường thị trường rộng hơn, thu được lợi nhuận ổn định với điều kiện kiểm soát rủi ro. Chiến lược này có một số tính phổ biến và giá trị thực tế, là đại diện điển hình của việc sử dụng kết hợp nhiều khung thời gian và chỉ số.

Mã nguồn chiến lược
/*backtest
start: 2023-01-01 00:00:00
end: 2023-06-16 00:00:00
period: 1h
basePeriod: 15m
exchanges: [{"eid":"Futures_Binance","currency":"BTC_USDT"}]
*/

// This source code is subject to the terms of the Mozilla Public License 2.0 at https://mozilla.org/MPL/2.0/
// © maxits
//@version=4

// MACD Divergence + Multi Time Frame EMA
// This Strategy uses 3 indicators: the Macd and two emas in different time frames
// The configuration of the strategy is:
// Macd standar configuration (12, 26, 9) in 1H resolution
// 10 periods ema, in 1H resolution
// 5 periods ema, in 15 minutes resolution

// We use the two emas to filter for long and short positions. 
// If 15 minutes ema is above 1H ema, we look for long positions
// If 15 minutes ema is below 1H ema, we look for short positions 

// We can use an aditional filter using a 100 days ema, so when the 15' and 1H emas are above the daily ema we take long positions
// Using this filter improves the strategy 

// We wait for Macd indicator to form a divergence between histogram and price
// If we have a bullish divergence, and 15 minutes ema is above 1H ema, we wait for macd line to cross above signal line and we open a long position
// If we have a bearish divergence, and 15 minutes ema is below 1H ema, we wait for macd line to cross below signal line and we open a short position

// We close both position after a cross in the oposite direction of macd line and signal line
// Also we can configure a Take profit parameter and a trailing stop loss


// strategy("Macd + MTF EMA",
//          overlay=true,
//          initial_capital=1000,
//          default_qty_value=20,
//          default_qty_type=strategy.percent_of_equity,
//          commission_value=0.1,
//          pyramiding=0)

// User Inputs
i_time          = input(defval = timestamp("01 Apr 2018 13:30 +0000"), title = "Start Time",  type = input.time)    // Starting  time for backtest
f_time          = input(defval = timestamp("30 Sep 2021 13:30 +0000"), title = "Finish Time", type = input.time)    // Finishing time for backtest

long_pos        = input(title="Show Long Positions",  defval=true, type=input.bool)                                 // Enable Long  Positions
short_pos       = input(title="Show Short Positions", defval=true, type=input.bool)                                 // Enable Short Positions
src             = input(close, title="Source")                                                                      // Price value to calculate indicators

emas_properties = input(title="============ EMAS Properties ============", defval=false, type=input.bool)           // Properties

mtf_15          = input(title="Fast EMA", type=input.resolution, defval="15")                                         // Resolucion para MTF EMA 15 minutes
ma_15_length    = input(5, title = "Fast EMA Period")                                                              // MTF EMA 15 minutes Length
mtf_60          = input(title="Slow EMA", type=input.resolution, defval="60")                                         // Resolucion para MTF EMA 60 minutes
ma_60_length    = input(10, title = "Slow EMA Period")                                                              // MTF EMA 60 minutes Length

e_new_filter    = input(title="Enable a Third Ema filter?", defval=true, type=input.bool) 
slowest_ema_len = input(100, title = "Fast EMA Period")
slowest_ema_res = input(title="Slowest EMA", type=input.resolution, defval="D")
macd_res        = input(title="MACD TimeFrame", type=input.resolution, defval="")                                   // MACD Time Frame

macd_properties = input(title="============ MACD Properties ============", defval="")                               // Properties

fast_len        = input(title="Fast Length", type=input.integer, defval=12)                                         // Fast MA Length
slow_len        = input(title="Sign Length", type=input.integer, defval=26)                                         // Sign MA Length
sign_len        = input(title="Sign Length", type=input.integer, defval=9) 

syst_properties = input(title="============ System Properties ============", defval="")                             // Properties

lookback        = input(title="Lookback period", type=input.integer, defval=14, minval=1)                            // Candles to lookback for swing high or low
multiplier      = input(title="Profit Multiplier based on Stop Loss", type=input.float, defval=6.0, minval=0.1)     // Profit multiplier based on stop loss
shortStopPer    = input(title="Short Stop Loss Percentage", type=input.float, defval=1.0, minval=0.0)/100           
longStopPer     = input(title="Long Stop Loss Percentage",  type=input.float, defval=2.0, minval=0.0)/100


// Indicators

[macd, signal, hist] = security(syminfo.tickerid, macd_res, macd(src, fast_len, slow_len, sign_len))
ma_15  = security(syminfo.tickerid, mtf_15, ema(src, ma_15_length))
ma_60  = security(syminfo.tickerid, mtf_60, ema(src, ma_60_length))
ma_slo = security(syminfo.tickerid, slowest_ema_res, ema(src, slowest_ema_len))

// Macd Plot

col_grow_above = #26A69A
col_grow_below = #FFCDD2
col_fall_above = #B2DFDB
col_fall_below = #EF5350

plot(macd,   color=color.new(color.blue, 0))              // Solo para visualizar que se plotea correctamente
plot(signal, color=color.new(color.orange, 0))
plot(hist,   style=plot.style_columns,
     color=(hist >= 0 ? (hist[1] < hist ? col_grow_above : col_fall_above) : 
     (hist[1] < hist ? col_grow_below : col_fall_below)))


// MTF EMA Plot
 
bullish_filter = e_new_filter ? ma_15 > ma_60 and ma_60 > ma_slo : ma_15 > ma_60 
bearish_filter = e_new_filter ? ma_15 < ma_60 and ma_60 < ma_slo : ma_15 < ma_60
    
plot(ma_15,  color=color.new(color.blue, 0))
plot(ma_60,  color=color.new(color.yellow, 0))
plot(e_new_filter ? ma_slo : na, color = ma_60 > ma_slo ? color.new(color.green, 0) : color.new(color.red, 0))

////////////////////////////////////////////// Logic For Divergence

zero_cross = false                                     
zero_cross := crossover(hist,0) or crossunder(hist,0)  //Cruce del Histograma a la linea 0
// plot(zero_cross ? 1 : na)

// MACD DIVERGENCE TOPS (Bearish Divergence) 

highest_top  = 0.0
highest_top := (zero_cross == true ? 0.0 : (hist > 0 and hist > highest_top[1] ? hist : highest_top[1]))
prior_top    = 0.0
prior_top   := (crossunder(hist,0) ? highest_top[1] : prior_top[1])  // Búsqueda del Maximo en MACD
// plot(highest_top)
// plot(prior_top)

highest_top_close  = 0.0
highest_top_close := (zero_cross == true ? 0.0 : (hist > 0 and hist > highest_top[1] ? close : highest_top_close[1]))
prior_top_close    = 0.0
prior_top_close   := (crossunder(hist,0) ? highest_top_close[1] : prior_top_close[1]) // Búsqueda del Maximo en pRECIO
// plot(highest_top_close)
// plot(prior_top_close)

top = false 
top := highest_top[1] < prior_top[1]
     and highest_top_close[1] > prior_top_close[1]
     and hist < hist[1]
     and crossunder(hist,0)                         // Bearish Divergence: top == true 


// MACD DIVERGENCE BOTTOMS (Bullish Divergence) 

lowest_bottom  = 0.0
lowest_bottom := (zero_cross == true ? 0.0 : (hist < 0 and hist < lowest_bottom[1] ? hist : lowest_bottom[1]))
prior_bottom   = 0.0
prior_bottom  := (crossover(hist,0) ? lowest_bottom[1] : prior_bottom[1])

lowest_bottom_close = 0.0
lowest_bottom_close := (zero_cross == true ? 0.0 : (hist < 0 and hist < lowest_bottom[1] ? close : lowest_bottom_close[1]))
prior_bottom_close = 0.0
prior_bottom_close := (crossover(hist,0) ? lowest_bottom_close[1] : prior_bottom_close[1])

bottom = false
bottom := lowest_bottom[1] > prior_bottom[1]
     and lowest_bottom_close[1] < prior_bottom_close[1]
     and hist > hist[1]
     and crossover(hist,0)                              // Bullish Divergence: bottom == true 


////////////////////////////////////////////// System Conditions //////////////////////////////////////////////

inTrade     = strategy.position_size != 0       // In Trade
longTrade   = strategy.position_size  > 0       // Long position
shortTrade  = strategy.position_size  < 0       // Short position
notInTrade  = strategy.position_size == 0       // No trade
entryPrice  = strategy.position_avg_price       // Position Entry Price

////////////////////////////////////////////// Long Conditions //////////////////////////////////////////////

sl = lowest(low, lookback)                  // Swing Low for Long Entry

longStopLoss    = 0.0                       // Trailing Stop Loss calculation
longStopLoss   := if (longTrade)
    astopValue  = sl * (1 - longStopPer)
    max(longStopLoss[1], astopValue)
else
    0

longTakeProf  = 0.0                         // Profit calculation based on stop loss
longTakeProf := if (longTrade)
    profitValue = entryPrice + (entryPrice - longStopLoss) * multiplier
    max(longTakeProf[1], profitValue)
else
    0
    
// Long Entry Conditions

if bottom and notInTrade and bullish_filter and long_pos
    strategy.entry(id="Go Long", long=strategy.long, comment="Long Position")

// strategy.close(id="Go Long", when=zero_cross)

if longTrade
    strategy.exit("Exit Long", "Go Long", limit = longTakeProf, stop = longStopLoss)

plot(longTrade and longStopLoss ? longStopLoss  : na, title="Long Stop Loss",  color=color.new(color.red, 0),   style=plot.style_linebr)
plot(longTrade and longTakeProf ? longTakeProf  : na, title="Long Take Prof",  color=color.new(color.green, 0), style=plot.style_linebr)

////////////////////////////////////////////// Short Conditions //////////////////////////////////////////////

sh = highest(high, lookback) // Swing High for Short Entry

shortStopLoss  = 0.0 
shortStopLoss := if (shortTrade)
    bstopValue = sh * (1 + shortStopPer)
    min(shortStopLoss[1], bstopValue)
else 
    999999
    
shortTakeProf    = 0.0    
shortTakeProf   := if (shortTrade)
    SprofitValue = entryPrice - (shortStopLoss - entryPrice) * multiplier
    min(SprofitValue, shortTakeProf[1])
else 
    999999
    
// Short Entry
if top and notInTrade and bearish_filter and short_pos
    strategy.entry(id="Go Short", long=strategy.short, comment="Short Position")

// strategy.close(id="Go Short", when=zero_cross)

if shortTrade
    strategy.exit("Exit Short", "Go Short", limit = shortTakeProf, stop = shortStopLoss)


plot(shortTrade and shortStopLoss ? shortStopLoss : na, title="Short Stop Loss", color=color.new(color.red, 0),   style=plot.style_linebr)
plot(shortTrade and shortTakeProf ? shortTakeProf : na, title="Short Take Prof", color=color.new(color.green, 0), style=plot.style_linebr)