Chiến lược lưỡng cực lợi nhuận hàng tháng

1
Follow
1779
Followers
Tổng quan
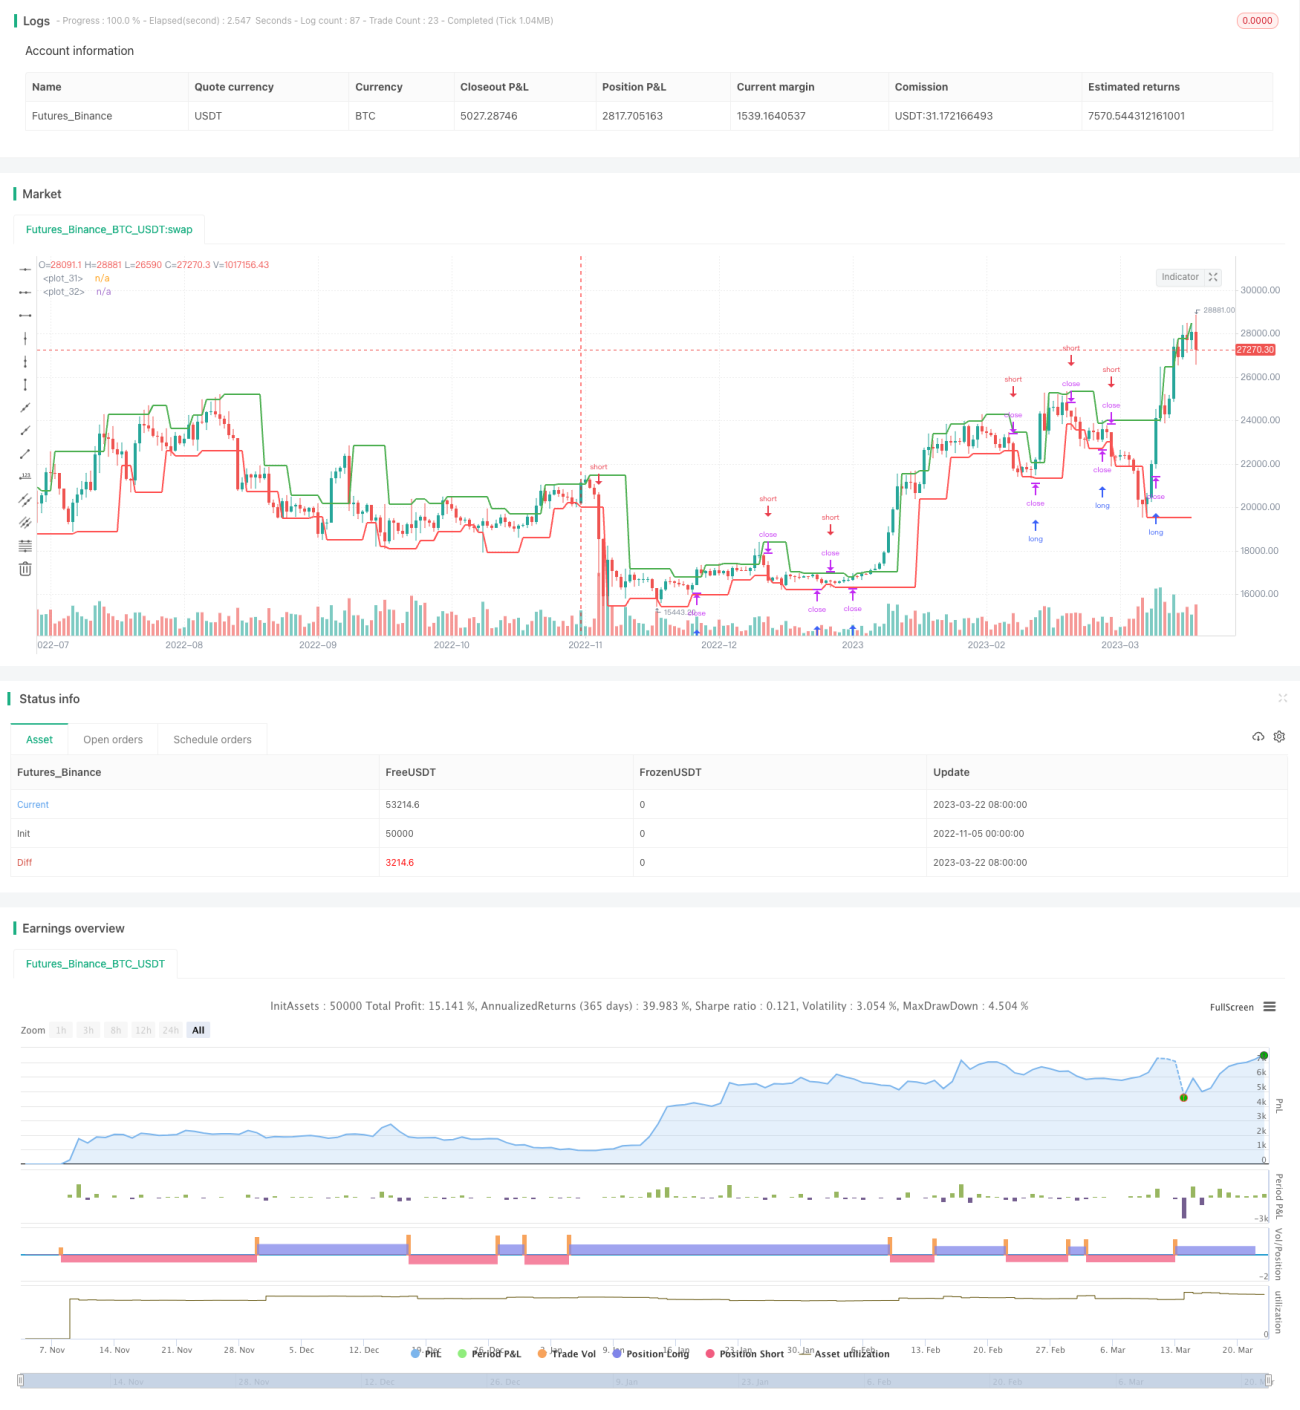
Chiến lược này sử dụng các điểm trung tâm của đường K để đánh giá xu hướng đảo ngược và sử dụng nó để báo hiệu giao dịch nhiều đầu không. Khi có lợi nhuận, chiến lược sẽ khóa các khoản thu được trong tháng đó để ngăn chặn tổn thất lớn trong giai đoạn rút lui.
Nguyên tắc chiến lược
- Sử dụng
pivothigh()Vàpivotlow()Hàm tính điểm trung tâm của đường K. Các điểm trung tâm có thể xác định xu hướng đảo ngược. - Khi giá vượt quá điểm trung tâm trên, thực hiện vị trí đầu nhiều. Khi giá giảm xuống điểm trung tâm dưới, thực hiện vị trí đầu ngắn.
- Vào đầu tháng, tính lợi nhuận của tháng trước và lưu vào mảng.
- Đầu năm, tính lãi suất của năm trước và lưu vào mảng.
- Tạo biểu đồ lợi nhuận để bạn có thể trực quan thấy lợi nhuận hàng tháng và hàng năm.
Phân tích ưu thế
- Sử dụng các điểm trung tâm để đánh giá xu hướng đảo ngược, bạn có thể lọc một số tín hiệu giao dịch ồn.
- Khóa lợi nhuận hàng tháng có thể làm giảm tác động của tháng thua lỗ, lợi nhuận hai cực.
- Bảng lợi nhuận hiển thị trực quan lợi nhuận hàng tháng, cho phép bạn nhìn thấy rõ ràng thời gian chiến lược tốt hay xấu.
Phân tích rủi ro
- Khi điểm trung tâm thay đổi, có thể gây ra lỗi mở cửa ngược. Các tham số có thể được tối ưu hóa thích hợp hoặc tăng điều kiện lọc.
- Việc bắt buộc đóng cửa vào đầu tháng sẽ làm mất cơ hội kiếm tiền trong tháng còn lại. Bạn có thể cân nhắc việc khóa chỉ một số vị trí.
- Bảng không thể hiển thị các chỉ số rủi ro như rút tối đa. Bạn có thể xem xét thêm các chỉ số khác để đo lường rủi ro chiến lược.
Định hướng tối ưu hóa
- Các điều kiện lọc có thể được thêm vào gần các điểm trung tâm để tránh các giao dịch đảo ngược không hiệu lực thường xuyên.
- Bạn có thể khóa một số vị thế, chứ không phải tất cả các vị thế bằng phẳng, giảm khả năng bị mất.
- Các chỉ số rủi ro định lượng như Tỷ lệ Sharpe và Tỷ lệ rút tối đa có thể được hiển thị trong bảng.
Kết luận
Chiến lược này sử dụng các điểm trung tâm để đánh giá xu hướng đảo ngược để giao dịch và khóa lợi nhuận vào cuối tháng để kiểm soát rủi ro rút lui một cách hiệu quả. Tuy nhiên, một số tham số và logic chiến lược vẫn có thể được tối ưu hóa hơn nữa để làm cho tín hiệu giao dịch chính xác hơn, kiểm soát rủi ro ổn định hơn.
Source
Pine
/*backtest
start: 2022-11-05 00:00:00
end: 2023-03-23 05:20:00
period: 1d
basePeriod: 1h
exchanges: [{"eid":"Futures_Binance","currency":"BTC_USDT"}]
*/

//@version=4
strategy("Monthly Returns in PineScript Strategies", overlay = true, default_qty_type = strategy.percent_of_equity, default_qty_value = 25, calc_on_every_tick = true, commission_type = strategy.commission.percent, commission_value = 0.1)

// Inputs Strategy parameters
Related strategies
Comment
All comments (0)
No data
- 1