Sử dụng Chiến lược Giao cắt Đường trung bình động kép
Tổng quan
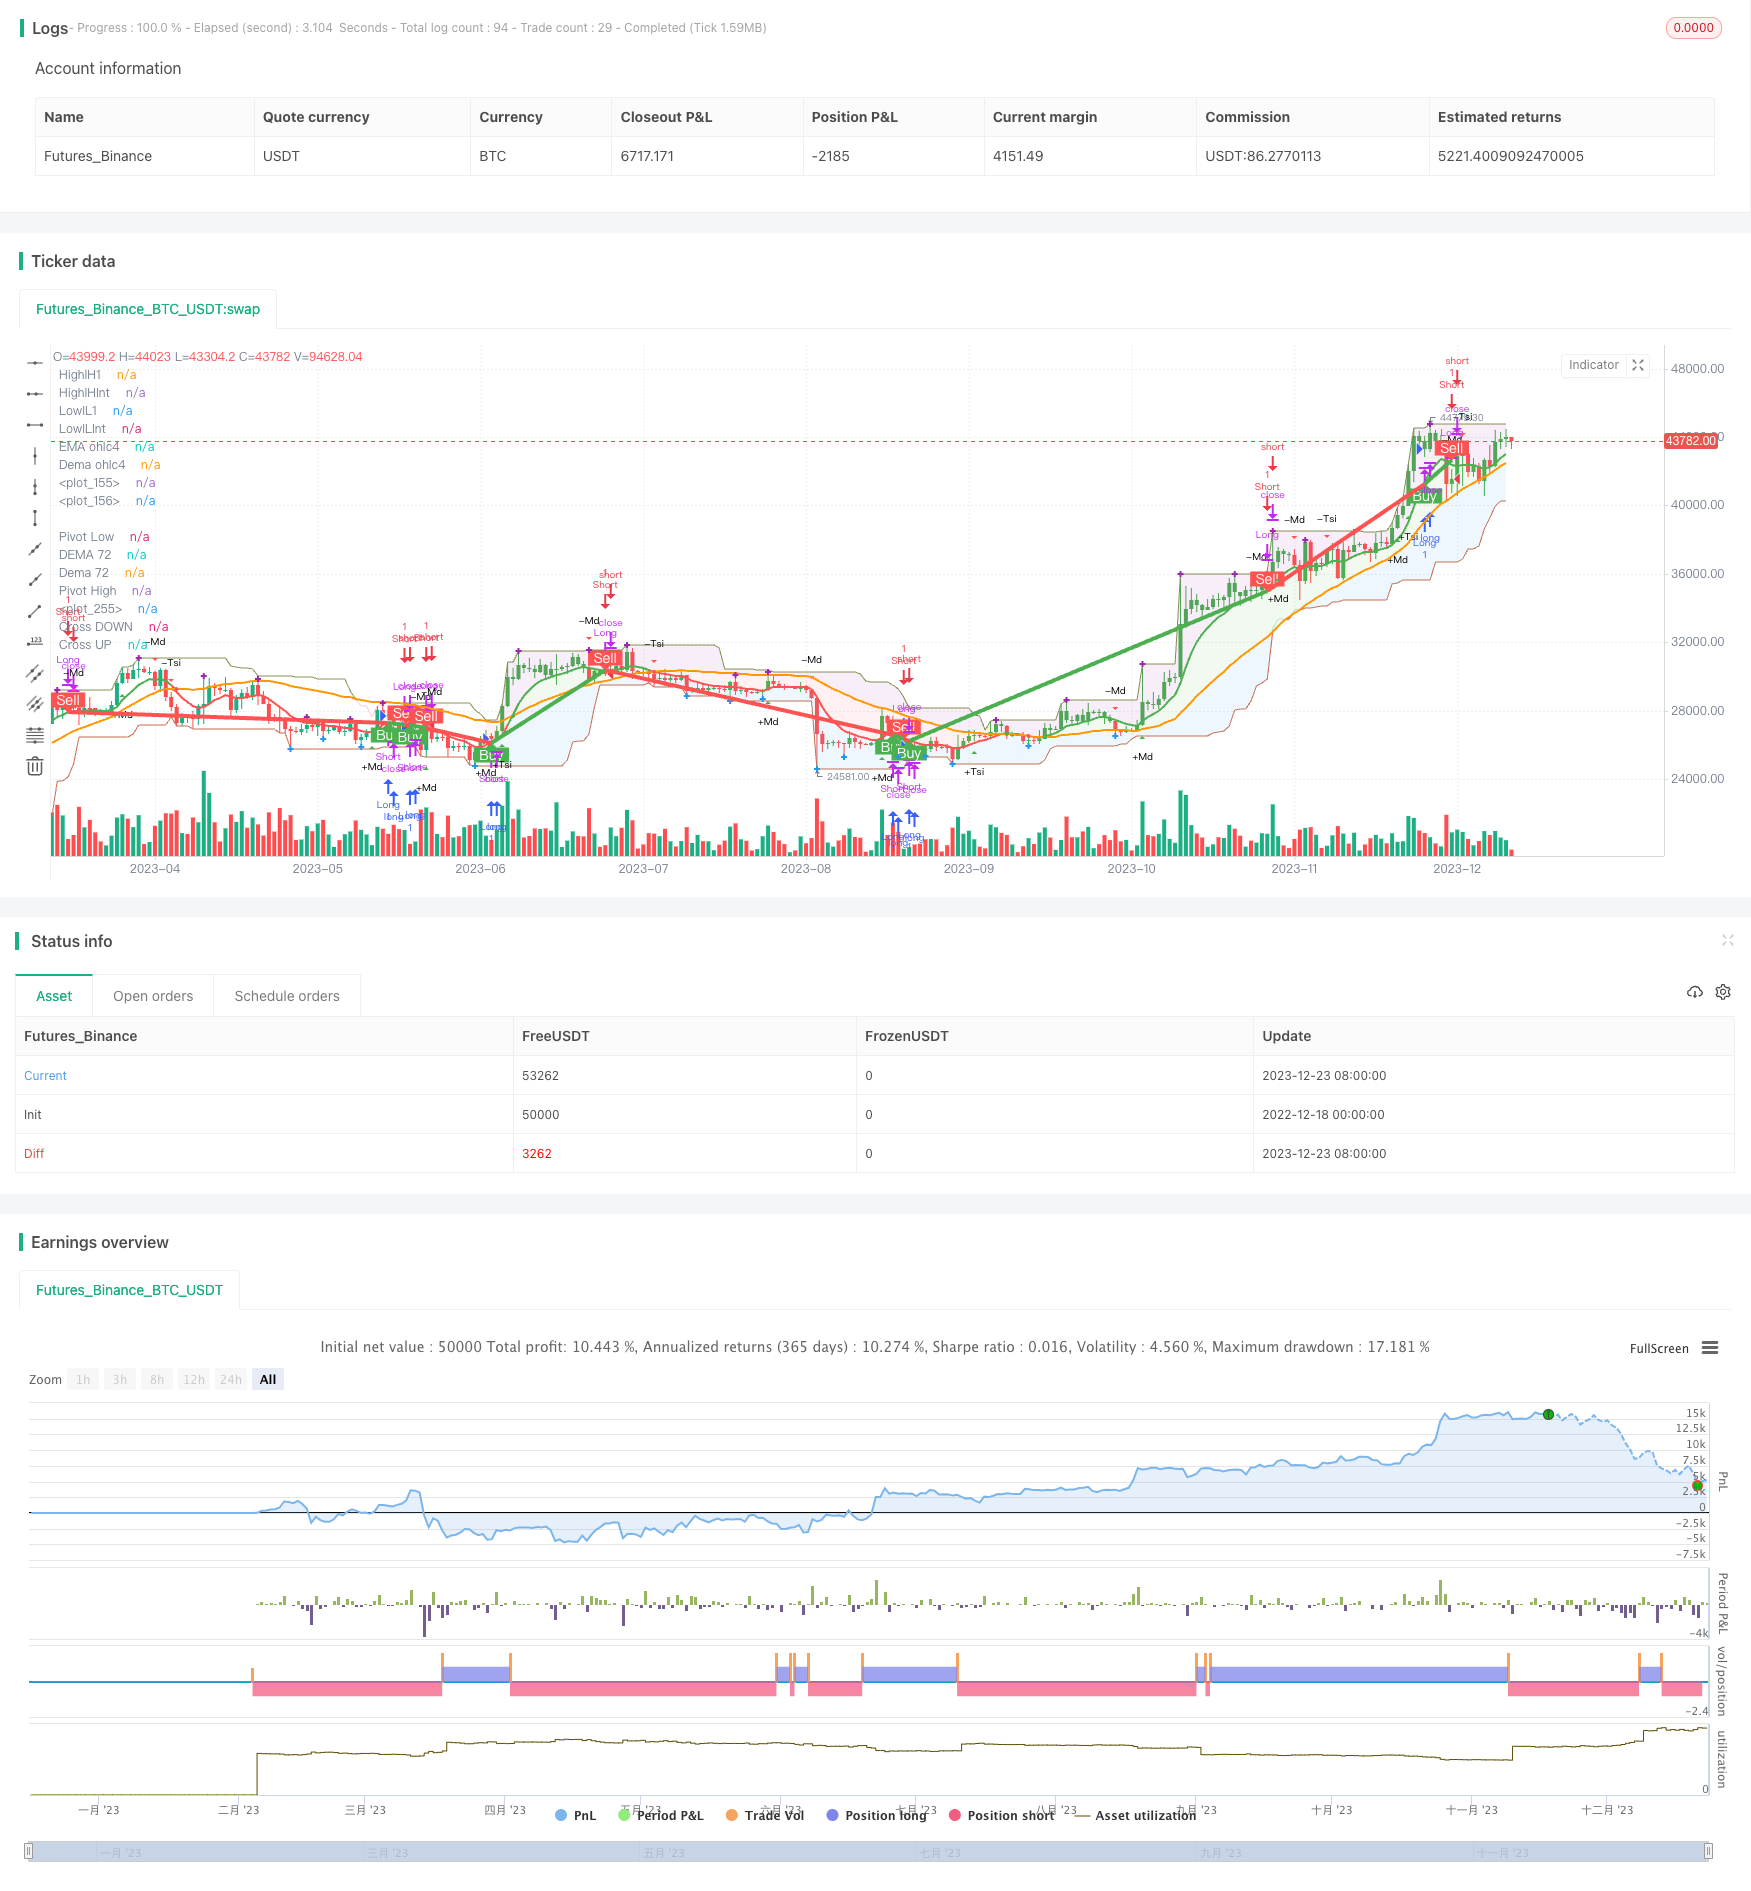
Đây là một chiến lược định lượng đơn giản sử dụng đường chéo trung bình di chuyển kép làm tín hiệu mua và bán. Nó sử dụng hai đường MA có chu kỳ khác nhau, tạo ra tín hiệu mua khi đường MA ngắn chu kỳ đi qua đường MA dài chu kỳ từ phía dưới; tạo ra tín hiệu bán khi đường MA ngắn chu kỳ đi qua đường MA dài chu kỳ từ phía trên xuống.
Nguyên tắc chiến lược
Chiến lược này được vẽ trên biểu đồ bằng cách tính toán 8 chu kỳ EMA và 72 chu kỳ EMA của giá đóng cửa. Khi giá đóng cửa trên 8 EMA, tạo ra tín hiệu mua; khi giá đóng cửa dưới 8 EMA, tạo ra tín hiệu bán.
Giả định cơ bản của chiến lược là: đường MA ngắn đại diện cho xu hướng và động lực giá gần đây, đường MA dài đại diện cho xu hướng dài. Khi đường MA ngắn đi qua đường MA dài, xu hướng ngắn hạn đang trở nên mạnh hơn, thúc đẩy giá phá vỡ đường trung bình dài, vì vậy bạn có thể mua.
Chiến lược này cũng sử dụng chỉ số William % R để xác định khu vực quá mua quá bán, chỉ số MACD để xác định hướng động lực giá để cung cấp tài liệu tham khảo cho quyết định giao dịch. Ngoài ra, chiến lược cũng có một số chỉ số phụ trợ như Dema, Pivots để giúp phân tích xu hướng.
Phân tích lợi thế
Ưu điểm lớn nhất của chiến lược giao chéo hai MA là đơn giản, dễ hiểu và dễ thực hiện. Chỉ cần dựa vào giao chéo hai MA, bạn có thể tạo tín hiệu giao dịch theo quy tắc mà không cần mô hình phức tạp và tối ưu hóa tham số.
Một lợi thế khác là chiến lược chéo MA hoạt động tốt hơn trong thị trường xu hướng. Chiến lược chéo MA có thể nắm bắt xu hướng lớn để tạo ra lợi nhuận tốt hơn khi giá cổ phiếu có xu hướng tăng hoặc giảm rõ ràng.
Phân tích rủi ro
Chiến lược giao chéo MA đôi cũng có một số rủi ro cần lưu ý. Thứ nhất, trong thị trường biến động, giao chéo đường MA thường xuyên, dễ gây ra tín hiệu sai và tổn thất theo chuỗi. Thứ hai, tín hiệu giao chéo MA thường bị chậm trễ, không thể phản ánh kịp thời tác động của sự kiện bất ngờ. Cuối cùng, các thiết lập tham số như chiều dài chu kỳ MA cần phải điều chỉnh kinh nghiệm.
Bạn có thể xác nhận tín hiệu, tối ưu hóa các tham số MA, hoặc hoạt động thị trường rõ ràng trong xu hướng để giảm rủi ro. Ngoài ra, thiết lập chặn lỗ và quản lý vị trí cũng rất quan trọng.
Hướng tối ưu hóa
Chiến lược MA đôi đơn giản này có thể được tối ưu hóa trong một số khía cạnh sau:
Thử nghiệm các kết hợp các tham số khác nhau của chu kỳ MA để tìm tham số tối ưu;
Lấy các chỉ số khác để lọc tín hiệu, ví dụ MACD, KDJ, để làm cho chiến lược ổn định hơn;
Thiết lập cơ chế thoát động theo dõi điểm dừng lỗ tốt nhất thay vì chỉ sử dụng giá trị cố định;
Sử dụng chu kỳ MA thích ứng theo tình trạng thị trường, tham số tối ưu hóa;
Kết hợp với các mô hình học máy tiên tiến và học sâu để dự đoán và tăng độ chính xác của tín hiệu.
Tóm tắt
Chiến lược này được coi là một chiến lược giao dịch chéo hai MA đơn giản, mặc dù có một số vấn đề về chậm trễ và tín hiệu giả, nhưng dễ hiểu và thực hiện. Với một số sửa đổi tối ưu hóa, nó vẫn có thể trở thành chiến lược giao dịch định lượng cơ bản và thực tế.
/*backtest
start: 2022-12-18 00:00:00
end: 2023-12-24 00:00:00
period: 1d
basePeriod: 1h
exchanges: [{"eid":"Futures_Binance","currency":"BTC_USDT"}]
*/

// This source code is subject to the terms of the Mozilla Public License 2.0 at https://mozilla.org/MPL/2.0/
// © DalmarSantos
//@version=4
//Entry and Exit points to TRADE ==> Pontos de Entrada e Saida de TRADE
//Functions in use ==> Funções em uso
//(1) DEMA - Double Exponential Moving Average 08/17/34/72 ==> Média Móvel Exponencial Dupla
//(2) ema() - Exponential Moving Averge 72/ochl4 ==> Média Móvel Exponencial
//(3) plot()
//(4) barcolor()
//(5) cross()
//(6) pivots()
//(7) William R% Md
//(8) Maximum and Minimum Value
//(9) fill()
//(10) macd() - Moving Average Convergence Divergence
//(11) tsi() - Trading Strenght Indicator==> Índice de Força Real (IFR)
//(12) Buy and Sell TRADE Points
//(13) Strategy Buy and Sell TRADE Points
strategy("[DS]Entry_Exit_TRADE.V01-Strategy", overlay=true)
//variable ==> variáveis
return = input(title="Return Candels ?", type=input.integer, defval=190) //quantity of candles to analise ==> quantidade de candles para analise
//
//****************************
//Function==> Função | (1)DEMA
//****************************
//Dema 08
e1 = ema(close,8)
e2 = ema(e1,8)
dema08 = 2 * e1 - e2
//
//Dema 17
e1 := ema(close,17)
e2 := ema(e1,17)
dema17 = 2 * e1 - e2
//
//Dema 34
e1 := ema(close,34)
e2 := ema(e1,34)
dema34 = 2 * e1 - e2
//
//Dema 72
e1 := ema(close,72)
e2 := ema(e1,72)
dema72 = 2 * e1 - e2
//
//******************************
//Function==> Função | (2) ema()
//******************************
ema72 = ema(close,72)
emaOhlc4=ema(ohlc4,8)
//
//******************************
//Function==> Função | (3)plot()
//******************************
//
////Show the avareges ==> Apresenta as médias
//plot(dema17, title="DEMA 17", color=color.new(color.lime,0), linewidth=1, style=plot.style_line, transp=0, show_last=return) // Doble Exponential Moving Avarage 17
//plot(dema34, title="DEMA 34", color=color.new(color.black,0), linewidth=1, style=plot.style_line, transp=0, show_last=return) // Doble Exponential Moving Avarage 34

plot(dema72, title="DEMA 72", color=color.orange, linewidth=2, style=plot.style_line, transp=0, show_last=return) // Doble Exponential Moving Avarage 72
plot(emaOhlc4, title="EMA ohlc4", color=emaOhlc4>dema72 ? color.new(color.green,0) : color.new(color.red,0), linewidth=2, style=plot.style_line, transp=0, show_last=return) // Doble Exponential Moving Avarage 72
//
//***********************************
//Function==> Função | (4) barcolor()
//***********************************
//Show color TRADE bar if emaOhlc4>dema72 green (Buy) if not red (Red) ==> Mostra a cor da barra de TRADE se emaOhlc4>dema72 verde (Compra) se não vermelha (Venda)
barcolor(close>dema34 and close>dema72 or close>close[1]  ? color.new(color.green,0) : color.new(color.red,0), show_last=return)
//
//********************************
//Function==> Função | (5) cross()
//********************************
// Show the intersections crossing average on the graph ==> Apresenta no gráfico o local dos cruzamentos das médias
//UP ==> para CIMA
plot(crossover(emaOhlc4,dema72) ? dema72 : na, title="Cross UP", color=color.green, transp=0, style=plot.style_circles, linewidth=5, show_last=return)
//DOWM ==> para BAIXO
plot(crossunder(emaOhlc4,dema72) ? dema72 : na, title="Cross DOWN", color=color.red, transp=50, style=plot.style_circles, linewidth=5, show_last=return)
//
//********************************
//Function==> Função | (6) pivot()
//Reference: Pine Script Manual
//********************************
_Pivots	= input(title = "══════ Pivots ══════", type = input.bool, defval = false)
leftBars = input(4)
rightBars=input(4)
pivotHigh = pivothigh(leftBars, rightBars) //pivot de alta
plot(pivotHigh>ema72[rightBars] ? pivotHigh : na, title="Pivot High", style=plot.style_cross, linewidth=3, color= color.purple, transp=50, offset=-rightBars, show_last=return)
pivotLow = pivotlow(leftBars, rightBars) //pivot de baixa
plot(pivotLow<ema72[rightBars] ? pivotLow : na, title="Pivot Low", style=plot.style_cross, linewidth=3, color= color.blue, transp=50, offset=-rightBars, show_last=return)
//
//***************************************
//Function==> Função | (7) WILLIAM R% MOD
//Reference: Pine Script Manual
//***************************************
// Getting inputs
_WilliamR	= input(title = "══════ William R% Mod ══════", type = input.bool, defval = false)
SOB_William = input(title="OverBought Area", type=input.integer, defval=-7) //OverBought area ==> Area de SobreCompra
SOS_William = input(title="OverSold Area", type=input.integer, defval=-93) //OverSold area ==> Area de SobreVenda
length_William = input(17, minval=1) //interval ==> intervalo
highestHigh_William = highest(length_William) //maximum value ==> valor máximo
highestLow_William = lowest(length_William) //minumum value ==> valor mínimo
R_William = (highestHigh_William - close) / (highestHigh_William - highestLow_William) * -100
//Show the position ==> mostra a posição
//plotshape(R_William > SOS_William ? na : high, text="+R%", title="+r(+)%R Up", location=location.belowbar, color=color.green, transp=30, style=shape.triangleup, size=size.tiny, show_last=return)
//plotshape(R_William < SOB_William ? na : low, text="-R%", title="(-)%R DN", location=location.abovebar, color=color.red, transp=30, style=shape.triangledown, size=size.tiny, show_last=return)
//
// Show label with William %R value ==> Mostra a etiqueta com o valor do William %R
// The color label red is when the value arrive on OverBought Area and green on OverSold Area, be careful with these areas ==> O rótulo de cor vermelha é quando o valor chega na área de SobreCompra e verde na área de SobreVenda, cuidado com estas áreas
//
corTest=color.white
colorText = color.white
estilo = label.style_label_upper_left
textW=""
if R_William>SOB_William
    corTest := color.new(color.red,0) //vermelho escuro
    estilo := label.style_label_lower_left
    textW:="OB"

if R_William>-30 and R_William<=SOB_William
    corTest := #f5948e //vermelho intermediário
    estilo := label.style_label_lower_left

if R_William>-50 and R_William<=-30
    corTest := #f5d5d3 //vermelho claro
    colorText := color.black

if R_William>-70 and R_William<=-50
    corTest := #e7f5d3 //verde claro
    colorText := color.black

if R_William>=SOS_William and R_William<=-70
    corTest := color.lime //verde intermediario
    estilo := label.style_label_upper_left
    colorText := color.black

if R_William<SOS_William
    corTest := color.new(color.green,0) // verde escuro
    estilo := label.style_label_upper_left
    textW:="OS"
// Make a label at the high of the current bar
myLabel = label.new(x=bar_index, y=close, style= estilo, color=corTest, text=tostring(R_William,"#.#")+"% "+textW, textcolor=colorText, size=size.normal)
// Get the label text
labelText = label.get_text(id=myLabel)
// Then set the label's text to a new string that
// includes its current text
label.set_text(id=myLabel, text=labelText)
label.delete(myLabel[1])
//
//**************************************************
//Function==> Função | (8) MAXIMUM AND MINIMUM VALUE
//Reference: Pine Script Manual
//**************************************************
//Maximum High and Minimum Low close position ==> Posição Máxima e Minima de fechamento
ExtremoHigh=high+(highestHigh_William-high)
ExtremoLow=low-(low-highestLow_William)
plot(ExtremoHigh, color=color.new(color.red,70), style=plot.style_line, linewidth=1, show_last=return)
plot(ExtremoLow, color=color.new(color.green,70), style=plot.style_line, linewidth=1, show_last=return)
//Show the Extreme High and Low close position ==> Mostra a extrema posicao alta e baixa do fechamento
lH1 = 0.0
lHInt = close
lL1 = close
lLInt = close
Vr_LinhaH=0.0
Vr_LinhaL=0.0
Vr_LinhaC=0.0
if emaOhlc4<dema72
    Vr_LinhaH := high+(highestHigh_William-high)
    lH1 := Vr_LinhaH>dema72 ?  Vr_LinhaH : dema72
    lHInt:=emaOhlc4<dema72 ? dema72 : emaOhlc4
    lLInt := lHInt==emaOhlc4 ? dema72 : emaOhlc4
    Vr_LinhaL:= low-(low-highestLow_William)
    lL1 := Vr_LinhaL>lLInt ?  lLInt : Vr_LinhaL

if emaOhlc4>dema72
    Vr_LinhaH := high+(highestHigh_William-high)
    lH1 := Vr_LinhaH>dema72 ?  Vr_LinhaH : dema72
    lHInt:=dema72>emaOhlc4 ? dema72 : emaOhlc4
    lLInt := lHInt==dema72 ? emaOhlc4 : dema72
    Vr_LinhaL:= low-(low-highestLow_William)
    lL1 := Vr_LinhaL>lLInt ?  lLInt : Vr_LinhaL
//
//*******************************
//Function==> Função | (9) fill()
//Reference: Pine Script Manual
//*******************************
//Show TRADE area in red (Sell) and green (Buy) ==> Mostra a área de trade em vermelho (Venda) e verde (Compra)
Line1 = plot(emaOhlc4, title="Dema ohlc4", color=color.new(color.white,100), linewidth=1, transp=0, show_last=return)
Line2 = plot(dema72,  title="Dema 72", color=color.new(color.white,100), linewidth=1,transp=0, show_last=return)
fill(Line1, Line2, color=emaOhlc4>dema72 ? color.new(color.green,90) : color.new(color.red,90), transp=70, show_last=return)

//High area ==> Area de alta
HighlH1 = plot(lH1, title="HighlH1", color=color.green, linewidth=1, transp=90, show_last=return, style=plot.style_linebr)
HighlHInt = plot(lHInt, title="HighlHInt", color=color.green, linewidth=1, transp=100, show_last=return, style=plot.style_linebr)
fill(HighlH1, HighlHInt, color=color.new(color.purple,90),  transp=0, show_last=return)

//Low area ==> Area de baixa
LowlL1 = plot(lL1, title="LowlL1", color=color.red, linewidth=1, transp=90, show_last=return, style=plot.style_linebr)
LowlLInt = plot(lLInt, title="LowlLInt", color=color.red, linewidth=1, transp=100, show_last=return, style=plot.style_linebr)
fill(LowlL1, LowlLInt, color=color.new(color.blue,90),  transp=0, show_last=return)
//
//***************************************************************************
//Function==> Função | (10) macd() - Moving Average Convergence Divergence
//Reference: Pine Script Manual - adapted TradingView version - Dalmar Santos
//***************************************************************************
// Getting inputs
_Macd	= input(title = "═════ Macd ══════════", type = input.bool, defval = false)
fast_length_Macd = input(title="Fast Length", type=input.integer, defval=12)
slow_length_Macd = input(title="Slow Length", type=input.integer, defval=26)
src_Macd = input(title="Source", type=input.source, defval=close)
signal_length_Macd = input(title="Signal Smoothing", type=input.integer, minval = 1, maxval = 50, defval = 9)
// Calculating
fast_ma_Macd = ema(src_Macd, fast_length_Macd)
slow_ma_Macd = ema(src_Macd, slow_length_Macd)
macd_Macd = fast_ma_Macd - slow_ma_Macd
signal_Macd = ema(macd_Macd, signal_length_Macd)
hist_Macd = macd_Macd - signal_Macd
//cross Macd
MacdUp = crossover(macd_Macd,signal_Macd) ? 1 : 0
MacdDown = crossunder (macd_Macd,signal_Macd) ? 1 : 0
plotshape(MacdUp, text="+Md", title="(+)MACD UP", location=location.belowbar, color=color.green, transp=30, style=shape.triangleup, size=size.tiny, show_last=return)
plotshape(MacdDown, text="-Md", title="(-)MACD DN", location=location.abovebar, color=color.red, transp=30, style=shape.triangledown, size=size.tiny, show_last=return)
//
//*****************************************************************************************
//Function==> Função | (11) tsi() - Trading Strenght Indicator ==> Indice de Força do Trading
//Reference: Pine Script Manual - adapted TradingView version - Dalmar Santos
//*****************************************************************************************
_Tsi	= input(title = "═════ Tsi ══════════", type = input.bool, defval = false)
long_tsi = input(title="Long Length", type=input.integer, defval=72)
short_tsi = input(title="Short Length", type=input.integer, defval=17)
signal_tsi = input(title="Signal Length", type=input.integer, defval=17)
price_tsi = close
double_smooth(src_tsi, long_tsi, short_tsi) =>
	fist_smooth_tsi = ema(src_tsi, long_tsi)
	ema(fist_smooth_tsi, short_tsi)
pc_tsi = change(price_tsi)
double_smoothed_pc_tsi = double_smooth(pc_tsi, long_tsi, short_tsi)
double_smoothed_abs_pc_tsi = double_smooth(abs(pc_tsi), long_tsi, short_tsi)
tsi_value_tsi = 100 * (double_smoothed_pc_tsi / double_smoothed_abs_pc_tsi)
//TSI signal ==> Signal do TSI
TsiUp = crossover(tsi_value_tsi,ema(tsi_value_tsi, signal_tsi)) ? 1 : 0
TsiDown = crossunder(tsi_value_tsi,ema(tsi_value_tsi, signal_tsi)) ? 1 : 0
//Show the Position ==> Mostra a posicao
plotshape(TsiUp==1 ? low : na, text="+Tsi", title="(+)TSI Up", location=location.belowbar, color=color.green, transp=30, style=shape.triangleup, size=size.tiny, show_last=return)
plotshape(TsiDown==1 ? high : na, text="-Tsi", title="(-)TSI DN", location=location.abovebar, color=color.red, transp=30, style=shape.triangledown, size=size.tiny, show_last=return)
//
//***************************************************************************
//Function==> Função | (12) Buy and Sell TRADE Points
//Reference: Pine Script Manual - adapted TradingView version - Dalmar Santos
//***************************************************************************
//Cross Point ==> pontos de cruzamento
crossUP=crossover(emaOhlc4,dema34)
crossDN=crossunder(emaOhlc4,dema34)
//Show de Buy and Sell points ==> mostra pontos de compra e venda
tradeColor=crossUP ? color.red : crossDN ? color.green : na
//line buy or sell ==> linha de compra ou venda
plot(crossUP ? dema34 : crossDN ? dema34: na, color=tradeColor, style=plot.style_line, linewidth=4, editable=false, show_last=return)
//Buy point ==> pontos de compra
plotshape(crossUP ? dema34 : na, style=shape.labelup, location=location.absolute, text="Buy", transp=0, textcolor = color.white, color=color.green, editable=false, show_last=return)
//Sell points ==> pontos de venda
plotshape(crossDN ? dema34: na, style=shape.labeldown, location=location.absolute, text="Sell", transp=0, textcolor = color.white, color=color.red, editable=false, show_last=return)
//
//************************************************************
//Function==> Função | (13) Strategy Buy and Sell TRADE Points
//Reference: Pine Script Manual - Dalmar Santos
//************************************************************
//Start backtest year, month, day, hour, minute, second ==> Inicio do backtest ano, mês, dia, hora, minuto, segundo
start = timestamp(2021,01,01,1,00,00)
//*****************
//BUY ==> COMPRA
//*****************
if time>= start
    if crossUP
        strategy.close("Short", comment="Close Sell")
        strategy.entry("Long", strategy.long, 1, comment="Open Buy")

//*****************
//SELL ==> Venda
//*****************
    if crossDN
        strategy.close("Long", comment="Close Buy")
        strategy.entry("Short", strategy.short, 1, comment="Open Sell")