Chiến lược hiệu suất lợi nhuận hàng tháng
Tổng quan
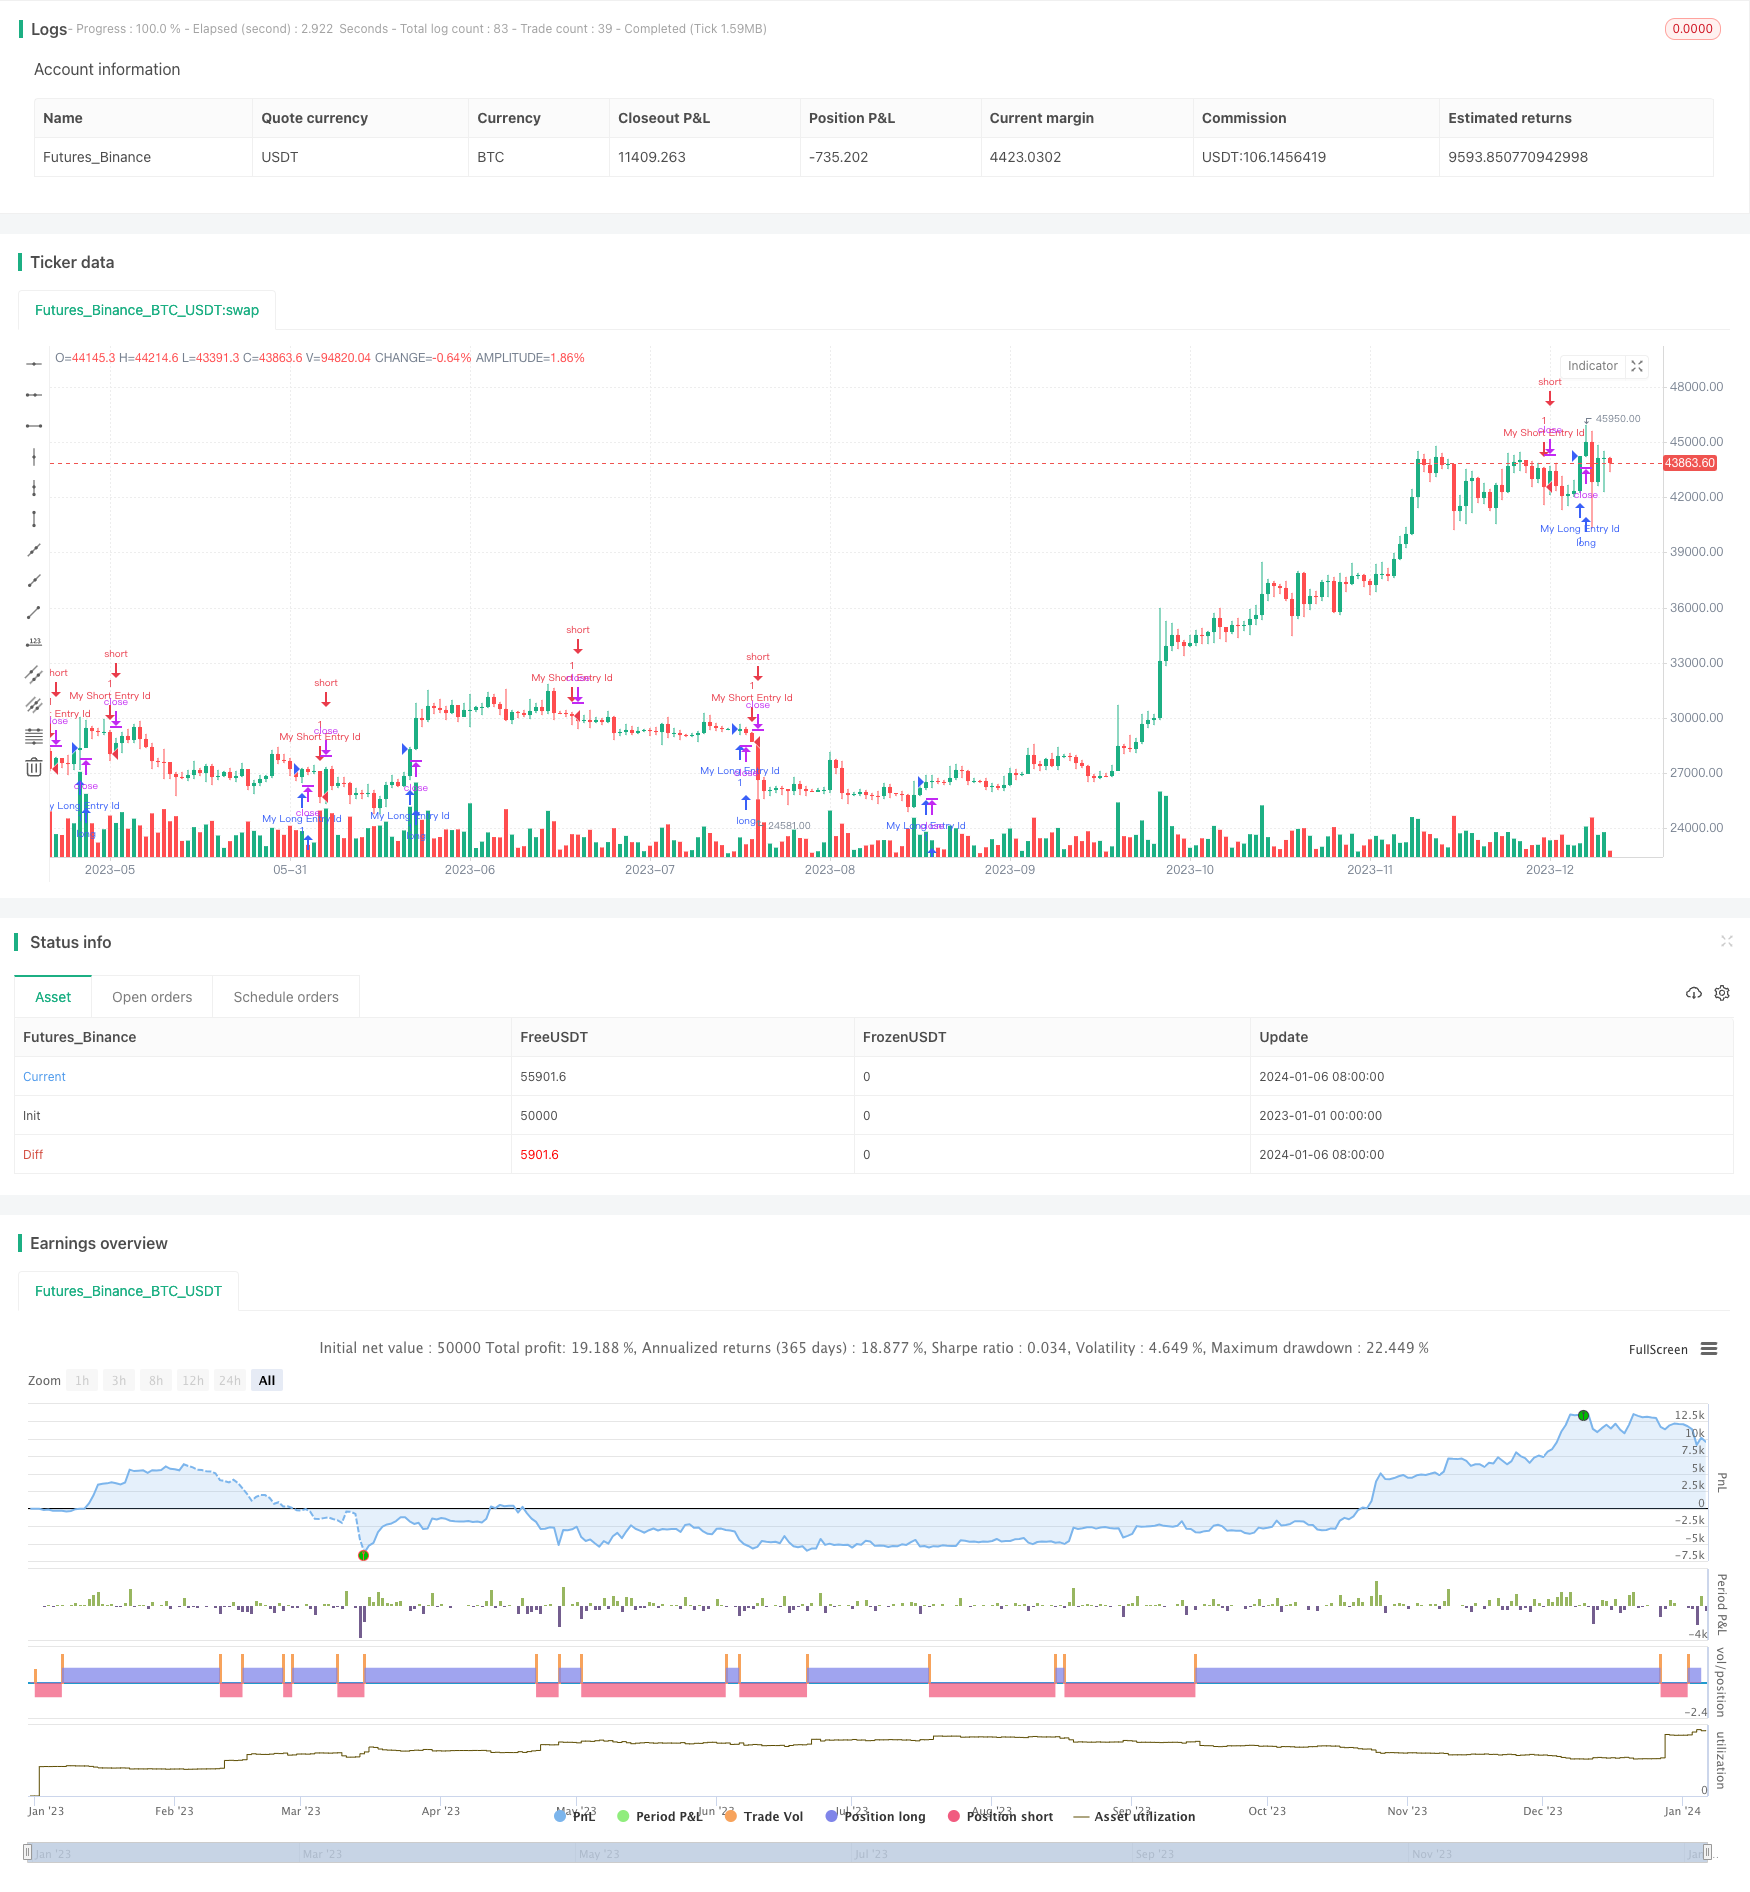
Chức năng chính của chiến lược này là theo dõi và hiển thị hiệu suất lợi nhuận hàng tháng theo thời gian thực. Nó cập nhật chi tiết lợi nhuận và lỗ hổng hàng tháng theo thời gian thực trong một bảng.
Nguyên tắc
Chiến lược này theo dõi hiệu suất thu nhập hàng tháng thông qua các bước sau:
- Định nghĩa biến số ghi lại liệu có giao dịch ngang hàng trong tháng này hay không.
- Xác định số tiền thu nhập và lỗ hổng cụ thể trong mỗi tháng được ghi lại bởi các biến.
- Xác định thời gian ghi biến tương ứng với tháng.
- Khi có vị thế yên trong tháng, ghi lại lợi nhuận và lỗ trong tháng và tháng vào mảng tương ứng.
- Hiển thị tiêu đề tháng ở vị trí được chỉ định trên bảng.
- Mảng thu nhập và lỗ hổng qua tháng, hiển thị giá trị thu nhập và lỗ hổng trong bảng cho tháng tương ứng.
- Cùng với đó là thông tin về năm tương ứng.
- Tổng hợp lợi nhuận và lỗ hổng hàng năm
- Sử dụng màu sắc để phân biệt lợi nhuận và thua lỗ.
Đây là những bước cơ bản và nguyên tắc hoạt động của chiến lược này.
Phân tích lợi thế
Chiến lược theo dõi lợi nhuận/lãi suất hàng tháng có một số ưu điểm:
- Thông tin này được cập nhật trực tiếp và có thể được xem bất cứ lúc nào để biết thêm thông tin lợi nhuận và lỗ hàng tháng.
- Một cách đơn giản, sử dụng biểu đồ để hiển thị trực quan lợi nhuận và lỗ hổng hàng tháng.
- Hình ảnh này có thể được nhìn thấy rõ ràng trong các chi tiết của mỗi tháng.
- So sánh trực quan, sử dụng màu sắc có thể so sánh trực quan hơn lợi nhuận hàng tháng.
- Tổng thống thống kê, cùng với tổng kết lợi nhuận và lỗ hàng năm.
- Bạn có thể tùy chỉnh vị trí, kích thước và cách hiển thị các biểu mẫu.
Phân tích rủi ro
Chiến lược này cũng có một số rủi ro:
- Lịch lý tính toán phức tạp, dễ bị lỗi dẫn đến dữ liệu không chính xác.
- Màn hình hiển thị quá thường xuyên, có thể ảnh hưởng đến hiệu suất.
- Dữ liệu tập hợp có hiệu quả lưu trữ thấp.
- Thời gian và tháng chuyển đổi có thể bị tính sai.
Bạn có thể làm giảm nguy cơ bằng cách:
- Có một số tính toán khác cũng được sử dụng trong các chương trình này.
- Tối ưu hóa tần số cập nhật biểu mẫu để ngăn chặn việc cập nhật quá mức.
- Thay đổi cấu trúc dữ liệu hiệu quả hơn để lưu trữ dữ liệu.
- Việc xử lý các trường hợp ngoại lệ trong việc chuyển đổi thời gian và tháng.
Tối ưu hóa chiến lược
Chiến lược này có thể được tối ưu hóa theo các khía cạnh sau:
- Sử dụng cấu trúc dữ liệu hiệu quả hơn, chẳng hạn như từ điển lưu trữ dữ liệu hàng tháng.
- Tính toán lãi suất tăng hàng năm.
- Tăng giá và các chỉ số khác.
- Hiển thị hình ảnh đường cong lợi nhuận.
- Hỗ trợ tùy chỉnh bắt đầu và kết thúc khoảng thời gian thống kê
- Hỗ trợ xuất dữ liệu sang tệp CSV.
Những cải tiến này giúp cho chiến lược có thể hoạt động tốt hơn, mạnh mẽ hơn và trải nghiệm sử dụng tốt hơn.
Tóm tắt
Chiến lược này sử dụng các mảng và bảng để thực hiện chức năng cốt lõi của việc theo dõi và hiển thị hiệu suất thu nhập hàng tháng trong thời gian thực. Nó đơn giản, hiệu quả và dễ sử dụng.
/*backtest
start: 2023-01-01 00:00:00
end: 2024-01-07 00:00:00
period: 1d
basePeriod: 1h
exchanges: [{"eid":"Futures_Binance","currency":"BTC_USDT"}]
*/

// This source code is subject to the terms of the Mozilla Public License 2.0 at https://mozilla.org/MPL/2.0/
// © MAURYA_ALGO_TRADER

//@version=5
strategy("Monthly Performance", overlay=true)

period = input(20, "Length")

longCondition =   close > high[20]  //ta.crossover(ta.sma(close, 14), ta.sma(close, 28))
if (longCondition)
    strategy.entry("My Long Entry Id", strategy.long)

shortCondition = close < low[20]  //ta.crossunder(ta.sma(close, 14), ta.sma(close, 28))
if (shortCondition)
    strategy.entry("My Short Entry Id", strategy.short)


// Copy below code to end of the desired strategy script
///////////////////////////////////////////////////////////////////////////////////////////////////////////////////////
//                                 monthly pnl performance  by Dr. Maurya @MAURYA_ALGO_TRADER                        //
///////////////////////////////////////////////////////////////////////////////////////////////////////////////////////
show_performance = input.bool(true, 'Show Monthly Monthly Performance ?', group='Monthly Performance')

dash_loc_mp = input("Bottom Right","Location"  ,options=["Top Right","Bottom Right","Top Left","Bottom Left", "Middle Right","Bottom Center"]  ,group='Monthly Performance', inline = "performance")

text_size_mp = input('Small',"Size"  ,options=["Tiny","Small","Normal","Large"]  ,group='Monthly Performance', inline = "performance")

var table_position_mp = dash_loc_mp == 'Top Left' ? position.top_left :
  dash_loc_mp == 'Bottom Left' ? position.bottom_left :
  dash_loc_mp == 'Middle Right' ? position.middle_right :
  dash_loc_mp == 'Bottom Center' ? position.bottom_center :
  dash_loc_mp == 'Top Right' ? position.top_right : position.bottom_right

var table_text_size_mp = text_size_mp == 'Tiny' ? size.tiny :
  text_size_mp == 'Small' ? size.small :
  text_size_mp == 'Normal' ? size.normal : size.large

/////////////////
text_c = color.white

/////////////////////////////////////////////

// var bool new_month = na
new_month = ta.change(month) //> 0 ? true : false
newest_month = new_month and strategy.closedtrades >= 1
strategy.initial_capital = 50000
// profit
only_profit = strategy.netprofit
initial_balance = strategy.initial_capital

// month number
var int month_number = na
month_number := (ta.valuewhen(newest_month, month(time), 0)) //and month(time) > 1 ? (ta.valuewhen(newest_month, month(time), 0) - 1) :  12 //1 to 12

//month_year
var int month_time = na
month_time := ta.valuewhen(newest_month, time, 0) - 2419200000


var int m_counter = 0
if newest_month
    m_counter += 1


// current month values
var bool new_year = na
new_year := ta.change(year)
curr_m_pnl = only_profit - nz(ta.valuewhen(newest_month, only_profit, 0), 0)
curr_m_number = newest_month ? ta.valuewhen(newest_month, month(time), 0) : month(time)
curr_y_pnl = (only_profit - nz(ta.valuewhen(new_year, only_profit, 0),0))


var float [] net_profit_array = array.new_float()
var int [] month_array = array.new_int()
var int [] month_time_array = array.new_int()


if newest_month
    array.push(net_profit_array, only_profit)
    array.push(month_array, month_number)
    array.push(month_time_array, month_time)


var float [] y_pnl_array = array.new_float()
var int [] y_number_array = array.new_int()
var int [] y_time_array = array.new_int()

newest_year = ta.change(year) and strategy.closedtrades >= 1
get_yearly_pnl = nz(ta.valuewhen(newest_year, strategy.netprofit, 0) - nz(ta.valuewhen(newest_year, strategy.netprofit, 1), 0), 0)
get_m_year = ta.valuewhen(newest_year, year(time), 1)
get_y_time = ta.valuewhen(newest_year, time, 0)

if newest_year
    array.push(y_pnl_array, get_yearly_pnl)
    array.push(y_number_array, get_m_year)
    array.push(y_time_array, get_y_time)
var float monthly_profit = na
var int column_month_number = na
var int row_month_time = na


var testTable = table.new(position = table_position_mp, columns = 14, rows = 40, bgcolor = color.rgb(7, 226, 242, 38), border_color = color.white, border_width = 1)
if barstate.islastconfirmedhistory and show_performance
    table.cell(table_id = testTable, column = 0, row = 0, text = "YEAR", text_color = text_c, text_size=table_text_size_mp)
    table.cell(table_id = testTable, column = 1, row = 0, text = "JAN", text_color = text_c, text_size=table_text_size_mp)
    table.cell(table_id = testTable, column = 2, row = 0, text = "FEB", text_color = text_c, text_size=table_text_size_mp)
    table.cell(table_id = testTable, column = 3, row = 0, text = "MAR", text_color = text_c, text_size=table_text_size_mp)
    table.cell(table_id = testTable, column = 4, row = 0, text = "APR", text_color = text_c, text_size=table_text_size_mp)
    table.cell(table_id = testTable, column = 5, row = 0, text = "MAY", text_color = text_c, text_size=table_text_size_mp)
    table.cell(table_id = testTable, column = 6, row = 0, text = "JUN", text_color = text_c, text_size=table_text_size_mp)
    table.cell(table_id = testTable, column = 7, row = 0, text = "JUL", text_color = text_c, text_size=table_text_size_mp)
    table.cell(table_id = testTable, column = 8, row = 0, text = "AUG", text_color = text_c, text_size=table_text_size_mp)
    table.cell(table_id = testTable, column = 9, row = 0, text = "SEP", text_color = text_c, text_size=table_text_size_mp)
    table.cell(table_id = testTable, column = 10, row = 0, text = "OCT", text_color = text_c, text_size=table_text_size_mp)
    table.cell(table_id = testTable, column = 11, row = 0, text = "NOV", text_color = text_c, text_size=table_text_size_mp)
    table.cell(table_id = testTable, column = 12, row = 0, text = "DEC", text_color = text_c, text_size=table_text_size_mp)
    table.cell(table_id = testTable, column = 13, row = 0, text = "YEAR P/L", text_color = text_c, text_size=table_text_size_mp)

    for i = 0 to (array.size(y_number_array) == 0 ? na : array.size(y_number_array) - 1)
        row_y = year(array.get(y_time_array, i)) - year(array.get(y_time_array, 0)) + 1
        table.cell(table_id = testTable, column = 13, row = row_y, text = str.tostring(array.get(y_pnl_array , i), "##.##") + '\n' + '(' + str.tostring(array.get(y_pnl_array , i)*100/initial_balance, "##.##") + ' %)', bgcolor = array.get(y_pnl_array , i) > 0 ? color.green : array.get(y_pnl_array , i) < 0 ? color.red : color.gray, text_color = color.rgb(0, 0, 0), text_size=table_text_size_mp)
    curr_row_y = array.size(month_time_array) == 0 ? 1 : (year(array.get(month_time_array, array.size(month_time_array) - 1))) - (year(array.get(month_time_array, 0))) + 1
    table.cell(table_id = testTable, column = 13, row = curr_row_y, text = str.tostring(curr_y_pnl, "##.##") + '\n' + '(' + str.tostring(curr_y_pnl*100/initial_balance, "##.##") + ' %)', bgcolor = curr_y_pnl > 0 ? color.green : curr_y_pnl < 0 ? color.red : color.gray, text_color = color.rgb(0, 0, 0), text_size=table_text_size_mp)


    for i = 0 to (array.size(net_profit_array) == 0 ? na : array.size(net_profit_array) - 1)
        monthly_profit := i > 0 ? ( array.get(net_profit_array, i) - array.get(net_profit_array, i - 1) ) : array.get(net_profit_array, i)
        column_month_number := month(array.get(month_time_array, i))
        row_month_time :=((year(array.get(month_time_array, i))) - year(array.get(month_time_array, 0)) ) + 1
        table.cell(table_id = testTable, column = column_month_number, row = row_month_time, text = str.tostring(monthly_profit, "##.##") + '\n' + '(' + str.tostring(monthly_profit*100/initial_balance, "##.##") + ' %)', bgcolor = monthly_profit > 0 ? color.green : monthly_profit < 0 ? color.red : color.gray, text_color = text_c, text_size=table_text_size_mp)
        table.cell(table_id = testTable, column = 0, row =row_month_time, text = str.tostring(year(array.get(month_time_array, i)), "##.##"), text_color = text_c, text_size=table_text_size_mp)

    curr_row_m = array.size(month_time_array) == 0 ? 1 : (year(array.get(month_time_array, array.size(month_time_array) - 1))) - (year(array.get(month_time_array, 0))) + 1
    table.cell(table_id = testTable, column = curr_m_number, row = curr_row_m, text = str.tostring(curr_m_pnl, "##.##") + '\n' + '(' + str.tostring(curr_m_pnl*100/initial_balance, "##.##") + ' %)', bgcolor = curr_m_pnl > 0 ? color.green : curr_m_pnl < 0 ? color.red : color.gray, text_color = text_c, text_size=table_text_size_mp)
    table.cell(table_id = testTable, column = 0, row =curr_row_m, text = str.tostring(year(time), "##.##"), text_color = text_c, text_size=table_text_size_mp)

//============================================================================================================================================================================