Chiến lược giao dịch tách biệt dài và ngắn của chỉ báo RSI


Ngày tạo: 2024-02-26 13:49:25 sửa đổi lần cuối: 2024-02-26 13:49:25
sao chép: 0 Số nhấp chuột: 680
1
tập trung vào
1617
Người theo dõi

Chiến lược giao dịch tách biệt dài và ngắn của chỉ báo RSI

Tổng quan

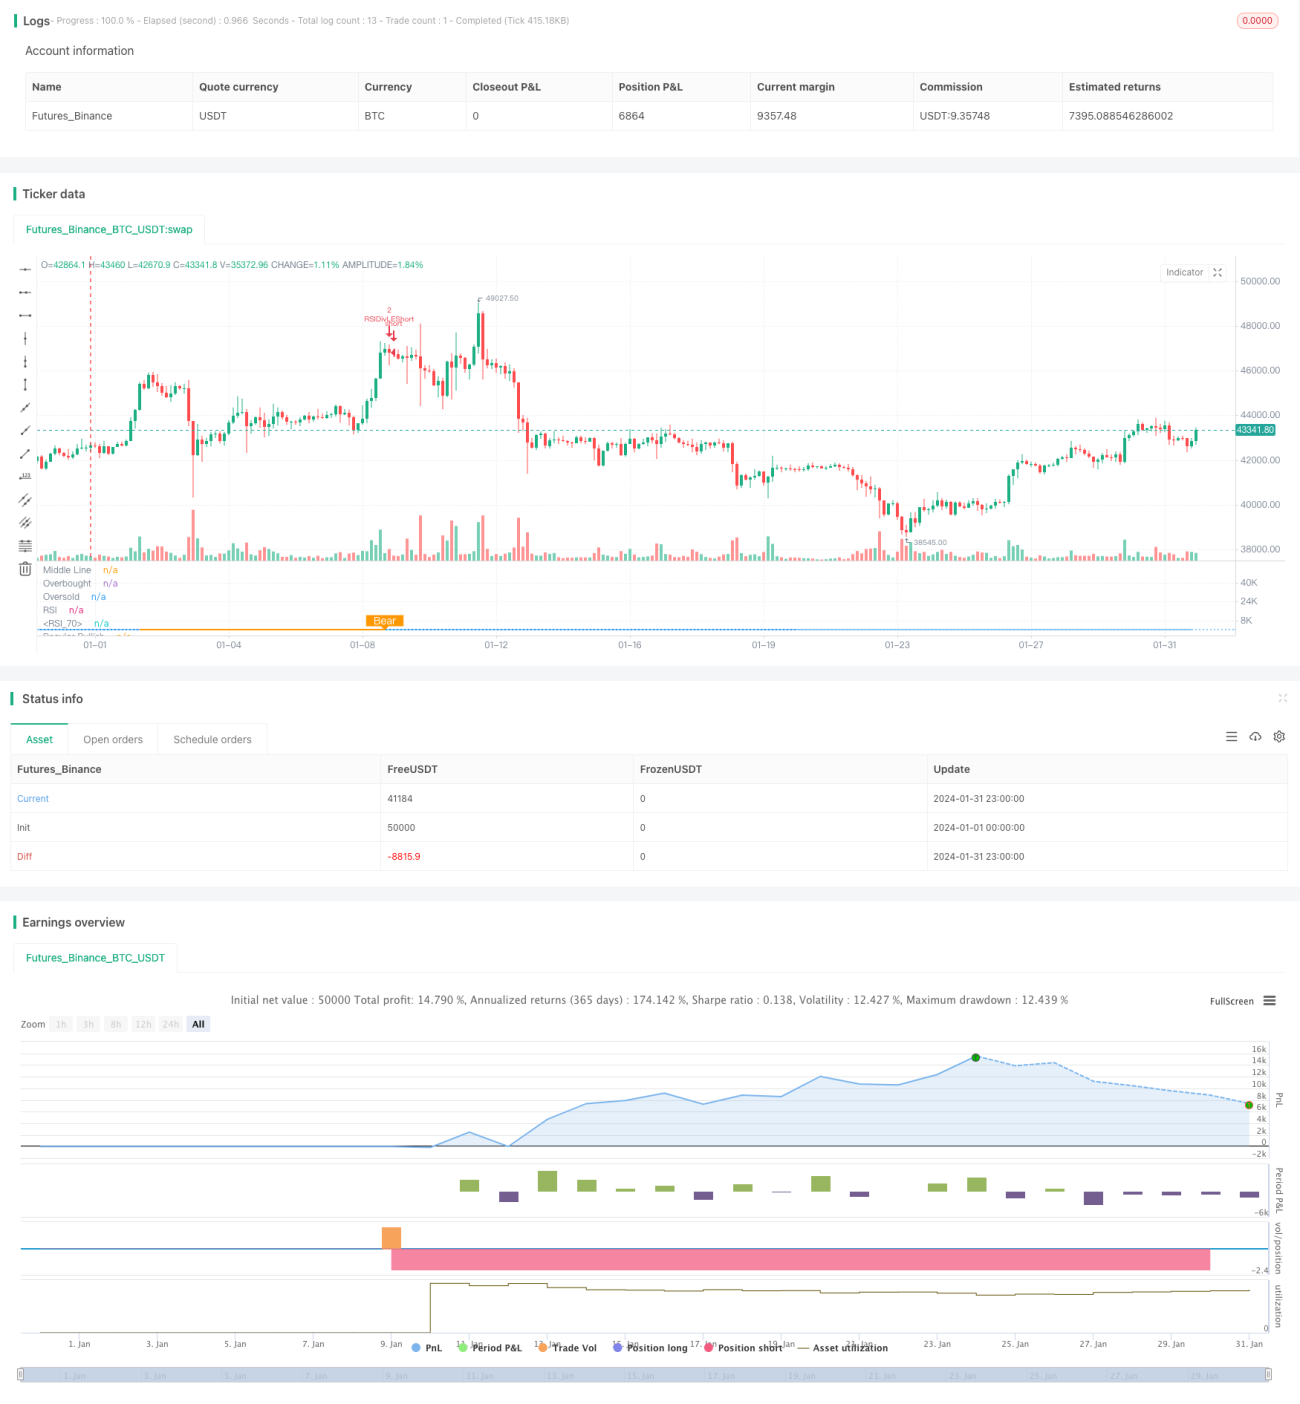
Chiến lược này sử dụng chỉ số RSI để xác định hiện tượng phân chia nhiều lỗ hổng và đưa ra quyết định giao dịch. Ý tưởng cốt lõi của nó là khi giá có mức thấp mới nhưng chỉ số RSI có mức cao mới, tạo ra tín hiệu phân chia nhiều lỗ hổng, cho thấy đáy đã được hình thành, làm nhiều; khi giá có mức cao mới nhưng chỉ số RSI có mức thấp mới, tạo ra tín hiệu phân chia lỗ hổng, cho thấy đỉnh đã được hình thành, làm trống.

Nguyên tắc chiến lược

Chiến lược này chủ yếu sử dụng chỉ số RSI để xác định sự phân tách đa khoảng giữa giá và RSI, cụ thể là:

  1. Sử dụng tham số chỉ số RSI là 13, nguồn dữ liệu là giá đóng cửa
  2. Phạm vi quay ngược trái 14 ngày và quay ngược phải 2 ngày được xác định cho phân tách đa đầu
  3. Phạm vi quay ngược trái 47 ngày và quay ngược phải 1 ngày được định nghĩa là tách không đầu
  4. Khi giá đạt mức thấp hơn, nhưng chỉ số RSI đạt mức thấp hơn, đáp ứng điều kiện phân tách đa đầu, tạo ra tín hiệu đa đầu
  5. Khi giá đạt mức cao hơn nhưng chỉ số RSI đạt mức cao hơn, điều kiện tách đầu trống được đáp ứng, tạo ra tín hiệu giao dịch ngắn

Bằng cách xác định sự phân tách đa khoảng giữa giá và chỉ số RSI, bạn có thể bắt được các điểm biến đổi trong xu hướng giá trước và đưa ra quyết định giao dịch.

Lợi thế chiến lược

Chiến lược này có những lợi thế chính như sau:

  1. Xác định sự phân tách đa khoảng giữa giá và chỉ số RSI, có thể đoán trước điểm biến của xu hướng giá, nắm bắt cơ hội giao dịch
  2. Vì sử dụng phân tích chỉ số, nó không bị ảnh hưởng bởi cảm xúc chủ quan
  3. Sử dụng xác định phân cách trong khoảng thời gian quay trở lại cố định để tránh tham khảo thường xuyên
  4. Kết hợp với các điều kiện bổ sung như RSI, có thể làm giảm khả năng giao dịch sai

Rủi ro và giải pháp

Chiến lược này cũng có một số rủi ro:

  1. RSI có thể có một khoảng cách thời gian, điều này có thể dẫn đến nguy cơ dừng bị kích hoạt. Giải pháp là nới lỏng mức dừng một cách thích hợp, cho giá đủ thời gian để xác nhận tín hiệu tách ra.

  2. Sự phân tách kéo dài cũng làm tăng nguy cơ. Giải pháp là kết hợp các chỉ số RSI đường ngày hoặc đường tròn dài hơn với các điều kiện lọc.

  3. Sự tách biệt quá nhỏ cũng không thể xác nhận sự đảo ngược xu hướng, cần mở rộng khoảng quay trở lại một cách thích hợp để tìm kiếm sự tách biệt RSI rõ ràng hơn.

Hướng tối ưu hóa chiến lược

Chiến lược này cũng có thể được tối ưu hóa theo các hướng sau:

  1. Tối ưu hóa các tham số RSI, tìm kiếm sự kết hợp tham số tốt nhất

  2. Thử các chỉ số kỹ thuật khác như MACD, KD để xác định sự phân tách đa không gian

  3. Thêm các điều kiện lọc phù hợp trong thời kỳ chấn động để tránh các giao dịch sai trong thời gian chấn động

  4. Kết hợp các chỉ số RSI với nhiều chu kỳ thời gian để tìm các tín hiệu kết hợp tốt nhất

Tóm tắt

Chiến lược giao dịch phân chia đa không gian RSI bằng cách xác định sự phân chia đa không gian giữa chỉ số RSI và giá, đánh giá điểm biến đổi của biến động giá, dựa trên đó thiết lập tín hiệu giao dịch. Chiến lược này đơn giản và thực tế, có thể làm tăng thêm tỷ lệ lợi nhuận bằng cách tối ưu hóa cài đặt tham số và tăng điều kiện lọc.

Mã nguồn chiến lược
/*backtest
start: 2024-01-01 00:00:00
end: 2024-01-31 23:59:59
period: 3h
basePeriod: 15m
exchanges: [{"eid":"Futures_Binance","currency":"BTC_USDT"}]
*/

// This source code is subject to the terms of the Mozilla Public License 2.0 at https://mozilla.org/MPL/2.0/
// © Nextep

//@version=4
strategy(title="RSI top&bottom destroy ", overlay=false, pyramiding=4, default_qty_value=2, default_qty_type=strategy.fixed, initial_capital=10000, currency=currency.USD)


// INPUT Settings --------------------------------------------------------------------------------------------------------------------------------------------------
len = input(title="RSI Period", minval=1, defval=13)
src = input(title="RSI Source", defval=close)


// defining the lookback range for shorts
lbRshort = input(title="Short Lookback Right", defval=1)
lbLshort = input(title="Short Lookback Left", defval=47)

// defining the lookback range for longs
lbRlong = input(title="Long Lookback Right", defval=2)
lbLlong = input(title="Long Lookback Left", defval=14)


rangeUpper = input(title="Max of Lookback Range", defval=400)
rangeLower = input(title="Min of Lookback Range", defval=1)

// take profit levels
takeProfitLongRSILevel = input(title="Take Profit at RSI Level", minval=0, defval=75)
takeProfitShortRSILevel = input(title="Take Profit for Short at RSI Level", minval=0, defval=25)


// Stop loss settings
longStopLossType = input("PERC", title="Long Stop Loss Type", options=['ATR','PERC', 'FIB', 'NONE'])
shortStopLossType = input("PERC", title="Short Stop Loss Type", options=['ATR','PERC', 'FIB', 'NONE'])
longStopLossValue = input(title="Long Stop Loss Value", defval=14, minval=0)
shortStopLossValue = input(title="Short Stop Loss Value", defval=5, minval=-10)


// PLOTTING THE CHARTS --------------------------------------------------------------------------------------------------------------------------------------------------
// Plotting the Divergence
plotBull = input(title="Plot Bullish", defval=true)
plotBear = input(title="Plot Bearish", defval=true)
bearColor = color.orange
bullColor = color.green
textColor = color.white
noneColor = color.new(color.white, 100)

// Adding the RSI oscillator
osc = rsi(src, len)
ma_len = 14 // Length for the moving average
rsi_ma = sma(osc, ma_len) // Calculate the moving average of RSI
plot(osc, title="RSI", linewidth=1, color=color.purple)
plot(rsi_ma, color=color.blue, title="RSI MA") // Plot the RSI MA

// Adding the lines of the RSI oscillator
plot(osc, title="RSI", linewidth=1, color=color.purple)
hline(50, title="Middle Line", linestyle=hline.style_dotted)
obLevel = hline(75, title="Overbought", linestyle=hline.style_dotted)
osLevel = hline(25, title="Oversold", linestyle=hline.style_dotted)
fill(obLevel, osLevel, title="Background", color=color.purple, transp=80)


atrLength = input(14, title="ATR Length (for Trailing stop loss)")
atrMultiplier = input(3.5, title="ATR Multiplier (for Trailing stop loss)")


// RSI PIVOTS --------------------------------------------------------------------------------------------------------------------------------------------------
// Define a condition for RSI pivot low
isFirstPivotLowlong = not na(pivotlow(osc, lbLlong, lbRlong))
// Define a condition for RSI pivot high
isFirstPivotHighlong = not na(pivothigh(osc, lbLlong, lbRlong))
// Define a condition for the first RSI value
firstPivotRSIValuelong = isFirstPivotLowlong ? osc[lbRlong] : na
// Define a condition for the second RSI value
secondPivotRSIValuelong = isFirstPivotLowlong ? valuewhen(isFirstPivotLowlong, osc[lbRlong], 1) : na


// Define a condition for RSI pivot low
isFirstPivotLowshort = not na(pivotlow(osc, lbLshort, lbRshort))
// Define a condition for RSI pivot high
isFirstPivotHighshort = not na(pivothigh(osc, lbLshort, lbRshort))
// Define a condition for the first RSI value
firstPivotRSIValueshort = isFirstPivotLowshort ? osc[lbRshort] : na
// Define a condition for the second RSI value
secondPivotRSIValueshort = isFirstPivotLowshort ? valuewhen(isFirstPivotLowshort, osc[lbRshort], 1) : na

_inRange(cond) =>
    bars = barssince(cond == true)
    rangeLower <= bars and bars <= rangeUpper


// ADDITIONAL ENTRY CRITERIA --------------------------------------------------------------------------------------------------------------------------------------------------
// RSI crosses RSI MA up by more than 2 points and subsequently down
rsiUpCross = crossover(osc, rsi_ma + 1)
rsiDownCross = crossunder(osc, rsi_ma - 1)

// Calculate the daily RSI
rsiDaily = security(syminfo.ticker, "D", rsi(src, 14))


// BULLISH CONDITIONS --------------------------------------------------------------------------------------------------------------------------------------------------

// LOWER LOW PRICE & HIGHER LOW OSC

// Price: Lower Low
priceLL = na(isFirstPivotLowlong[1]) ? false : (low[lbRlong] < valuewhen(isFirstPivotLowlong, low[lbRlong], 1))
// Osc: Higher Low
oscHL = na(isFirstPivotLowlong[1]) ? false : (osc[lbRlong] > valuewhen(isFirstPivotLowlong, osc[lbRlong], 1) and _inRange(isFirstPivotLowlong[1]))


// BULLISH PLOT
bullCond = plotBull and priceLL and oscHL and isFirstPivotLowlong
plot(
     isFirstPivotLowlong ? osc[lbRlong] : na,
     offset=-lbRlong,
     title="Regular Bullish",
     linewidth=2,
     color=(bullCond ? bullColor : noneColor),
     transp=0
     )

plotshape(
     bullCond ? osc[lbRlong] : na,
     offset=-lbRlong,
     title="Regular Bullish Label",
     text=" Bull ",
     style=shape.labelup,
     location=location.absolute,
     color=bullColor,
     textcolor=textColor,
     transp=0
     )


// BEARISH CONDITIONS --------------------------------------------------------------------------------------------------------------------------------------------------

// HIGHER HIGH PRICE & LOWER LOW OSC
// Osc: Lower High
oscLH = na(isFirstPivotHighshort[1]) ? false : (osc[lbRshort] < valuewhen(isFirstPivotHighshort, osc[lbRshort], 1) and _inRange(isFirstPivotHighshort[1]))
// Price: Higher High
priceHH = na(isFirstPivotHighshort[1]) ? false : (high[lbRshort] > valuewhen(isFirstPivotHighshort, high[lbRshort], 1))


// BEARISH PLOT
bearCond = plotBear and priceHH and oscLH and isFirstPivotHighshort

plot(
     isFirstPivotHighshort ? osc[lbRshort] : na,
     offset=-lbRshort,
     title="Regular Bearish",
     linewidth=2,
     color=(bearCond ? bearColor : noneColor),
     transp=0
     )

plotshape(
     bearCond ? osc[lbRshort] : na,
     offset=-lbRshort,
     title="Regular Bearish Label",
     text=" Bear ",
     style=shape.labeldown,
     location=location.absolute,
     color=bearColor,
     textcolor=textColor,
     transp=0
     )


// ENTRY CONDITIONS --------------------------------------------------------------------------------------------------------------------------------------------------

longCondition = false
shortCondition = false

// Entry Conditions
longCondition := bullCond
shortCondition := bearCond

// Conditions to prevent entering trades based on daily RSI
longCondition := longCondition and rsiDaily >= 23
shortCondition := shortCondition and rsiDaily <= 80


// STOPLOSS CONDITIONS --------------------------------------------------------------------------------------------------------------------------------------------------
// Stoploss Conditions
long_sl_val = 
      longStopLossType == "ATR" ? longStopLossValue * atr(atrLength) 
      : longStopLossType == "PERC" ? close * longStopLossValue / 100 : 0.00
long_trailing_sl = 0.0
long_trailing_sl := strategy.position_size >= 1 ? max(low - long_sl_val, nz(long_trailing_sl[1])) : na

// Calculate Trailing Stop Loss for Short Entries
short_sl_val = 
      shortStopLossType == "ATR" ? 1 - shortStopLossValue * atr(atrLength) 
      : shortStopLossType == "PERC" ? close * (shortStopLossValue / 100) : 0.00 //PERC = shortstoplossvalue = -21300 * 5 / 100 = -1065
short_trailing_sl = 0.0
short_trailing_sl := strategy.position_size <= -1 ? max(high + short_sl_val, nz(short_trailing_sl[1])) : na


// RSI STOP CONDITION
 
rsiStopShort = (strategy.position_avg_price != 0.0 and close <= strategy.position_avg_price * 0.90) or (strategy.position_avg_price != 0.0 and rsi(src, 14) >= 75)
 
rsiStopLong = (strategy.position_avg_price != 0.0 and close >= strategy.position_avg_price * 1.10) or (strategy.position_avg_price != 0.0 and rsi(src, 14) <= 25)


// LONG CONDITIONS --------------------------------------------------------------------------------------------------------------------------------------------------
strategy.entry(id="RSIDivLELong", long=true, when=longCondition)

strategy.entry(id="RSIDivLEShort", long=false, when=shortCondition)


// Close Conditions
shortCloseCondition = bullCond // or cross(osc, takeProfitShortRSILevel)
strategy.close(id="RSIDivLEShort", comment="Close All="+tostring(-close + strategy.position_avg_price, "####.##"), when=abs(strategy.position_size) <= -1 and shortStopLossType == "NONE" and shortCloseCondition )
strategy.close(id="RSIDivLEShort", comment="TSL="+tostring(-close + strategy.position_avg_price, "####.##"), when=abs(strategy.position_size) >= -1 and ((shortStopLossType == "PERC" or shortStopLossType == "ATR") and cross(short_trailing_sl,high))) // or rsiStopShort)// or rsiStopShort)


longCloseCondition = bearCond
strategy.close(id="RSIDivLELong", comment="Close All="+tostring(close - strategy.position_avg_price, "####.##"), when=abs(strategy.position_size) >= 1 and longStopLossType == "NONE" and longCloseCondition)
strategy.close(id="RSIDivLELong", comment="TSL="+tostring(close - strategy.position_avg_price, "####.##"), when=abs(strategy.position_size) >= 1 and ((longStopLossType == "PERC" or longStopLossType == "ATR") and cross(long_trailing_sl,low)))  //or rsiStopLong