এমএসিডি + এসএএমএ ২০০ কৌশল
লেখক:চাওঝাং, তারিখ: ২০২২-০৫-০৭ ১৭ঃ১৩ঃ৩২ট্যাগঃএমএসিডি
এখানে ক্লাসিক্যাল এমএসিডি (মোভিং মিডিয়ার কনভার্জেন্স ডিভার্জেন্স ইন্ডিকেটর) এবং ক্লাসিক্যাল স্লো মুভিং মিডিয়ার এসএমএ-র সংমিশ্রণ রয়েছে।
এই কৌশলটি দীর্ঘ হয় যদি এমএসিডি হিস্টোগ্রাম এবং এমএসিডি গতি উভয়ই শূন্যের উপরে থাকে এবং দ্রুত এমএসিডি চলমান গড়টি ধীর এমএসিডি চলমান গড়ের উপরে থাকে। অতিরিক্ত দীর্ঘ ফিল্টার হিসাবে সাম্প্রতিক মূল্যটি এসএমএ 200 এর উপরে থাকতে হবে। যদি বিপরীত যুক্তি সত্য হয় তবে কৌশলটি সংক্ষিপ্ত হয়। সবচেয়ে খারাপ ক্ষেত্রে 50% ফিল্টারের সর্বাধিক অন্তঃদিবস ইক্যুইটি ক্ষতি হয়।
আমার ফ্রি স্ট্র্যাটেজি দিয়ে আরও ৯৯৯ ডলার সাশ্রয় করুন।
এই কৌশলটি বিটকয়েনের দৈনিক চার্টে ব্যাকটেস্টে কাজ করে, পাশাপাশি এসএন্ডপি ৫০০ এবং ডাউ জোন্স ইন্ডাস্ট্রিয়াল এভারেজ দৈনিক চার্টে । এসপিএক্স ৫০০ সিএফডি দৈনিকের বর্তমান পারফরম্যান্স ৩০ নভেম্বর, ২০১৫ তারিখে শতকরা মুনাফাঃ ৬৮% ১৯৭০ সাল থেকে লাভের ফ্যাক্টর ৬.৪ । ডাব্লুআইআই সূচক দৈনিকের বর্তমান পারফরম্যান্স ৩০ নভেম্বর, ২০১৫ তারিখে শতকরা মুনাফাঃ ৫১% ১৯১৫ সাল থেকে লাভের ফ্যাক্টর ১০.৮ ।
সমস্ত ট্রেডিংয়ে উচ্চ ঝুঁকি জড়িত; অতীতের কর্মক্ষমতা ভবিষ্যতের ফলাফলের নির্দেশক নয়। অনুমান বা সিমুলেটেড কর্মক্ষমতা ফলাফলের কিছু অন্তর্নিহিত সীমাবদ্ধতা রয়েছে। প্রকৃত কর্মক্ষমতা রেকর্ডের বিপরীতে, সিমুলেটেড ফলাফলগুলি প্রকৃত ট্রেডিংয়ের প্রতিনিধিত্ব করে না। এছাড়াও, যেহেতু ট্রেডগুলি প্রকৃতপক্ষে কার্যকর করা হয়নি, ফলাফলগুলি নির্দিষ্ট বাজার কারণগুলির প্রভাবের জন্য কম-বা অতিরিক্ত ক্ষতিপূরণ দিতে পারে, যদি থাকে তবে, যেমন তরলতার অভাব। সাধারণভাবে সিমুলেটেড ট্রেডিং প্রোগ্রামগুলিও এই সত্যের সাপেক্ষে যে তারা পিছনের দৃষ্টিভঙ্গির সুবিধার সাথে ডিজাইন করা হয়েছে। কোনও প্রতিনিধিত্ব করা হচ্ছে না যে কোনও অ্যাকাউন্ট প্রদর্শিতগুলির মতো লাভ বা ক্ষতি অর্জন করবে বা সম্ভবত অর্জন করবে।
ব্যাকটেস্ট
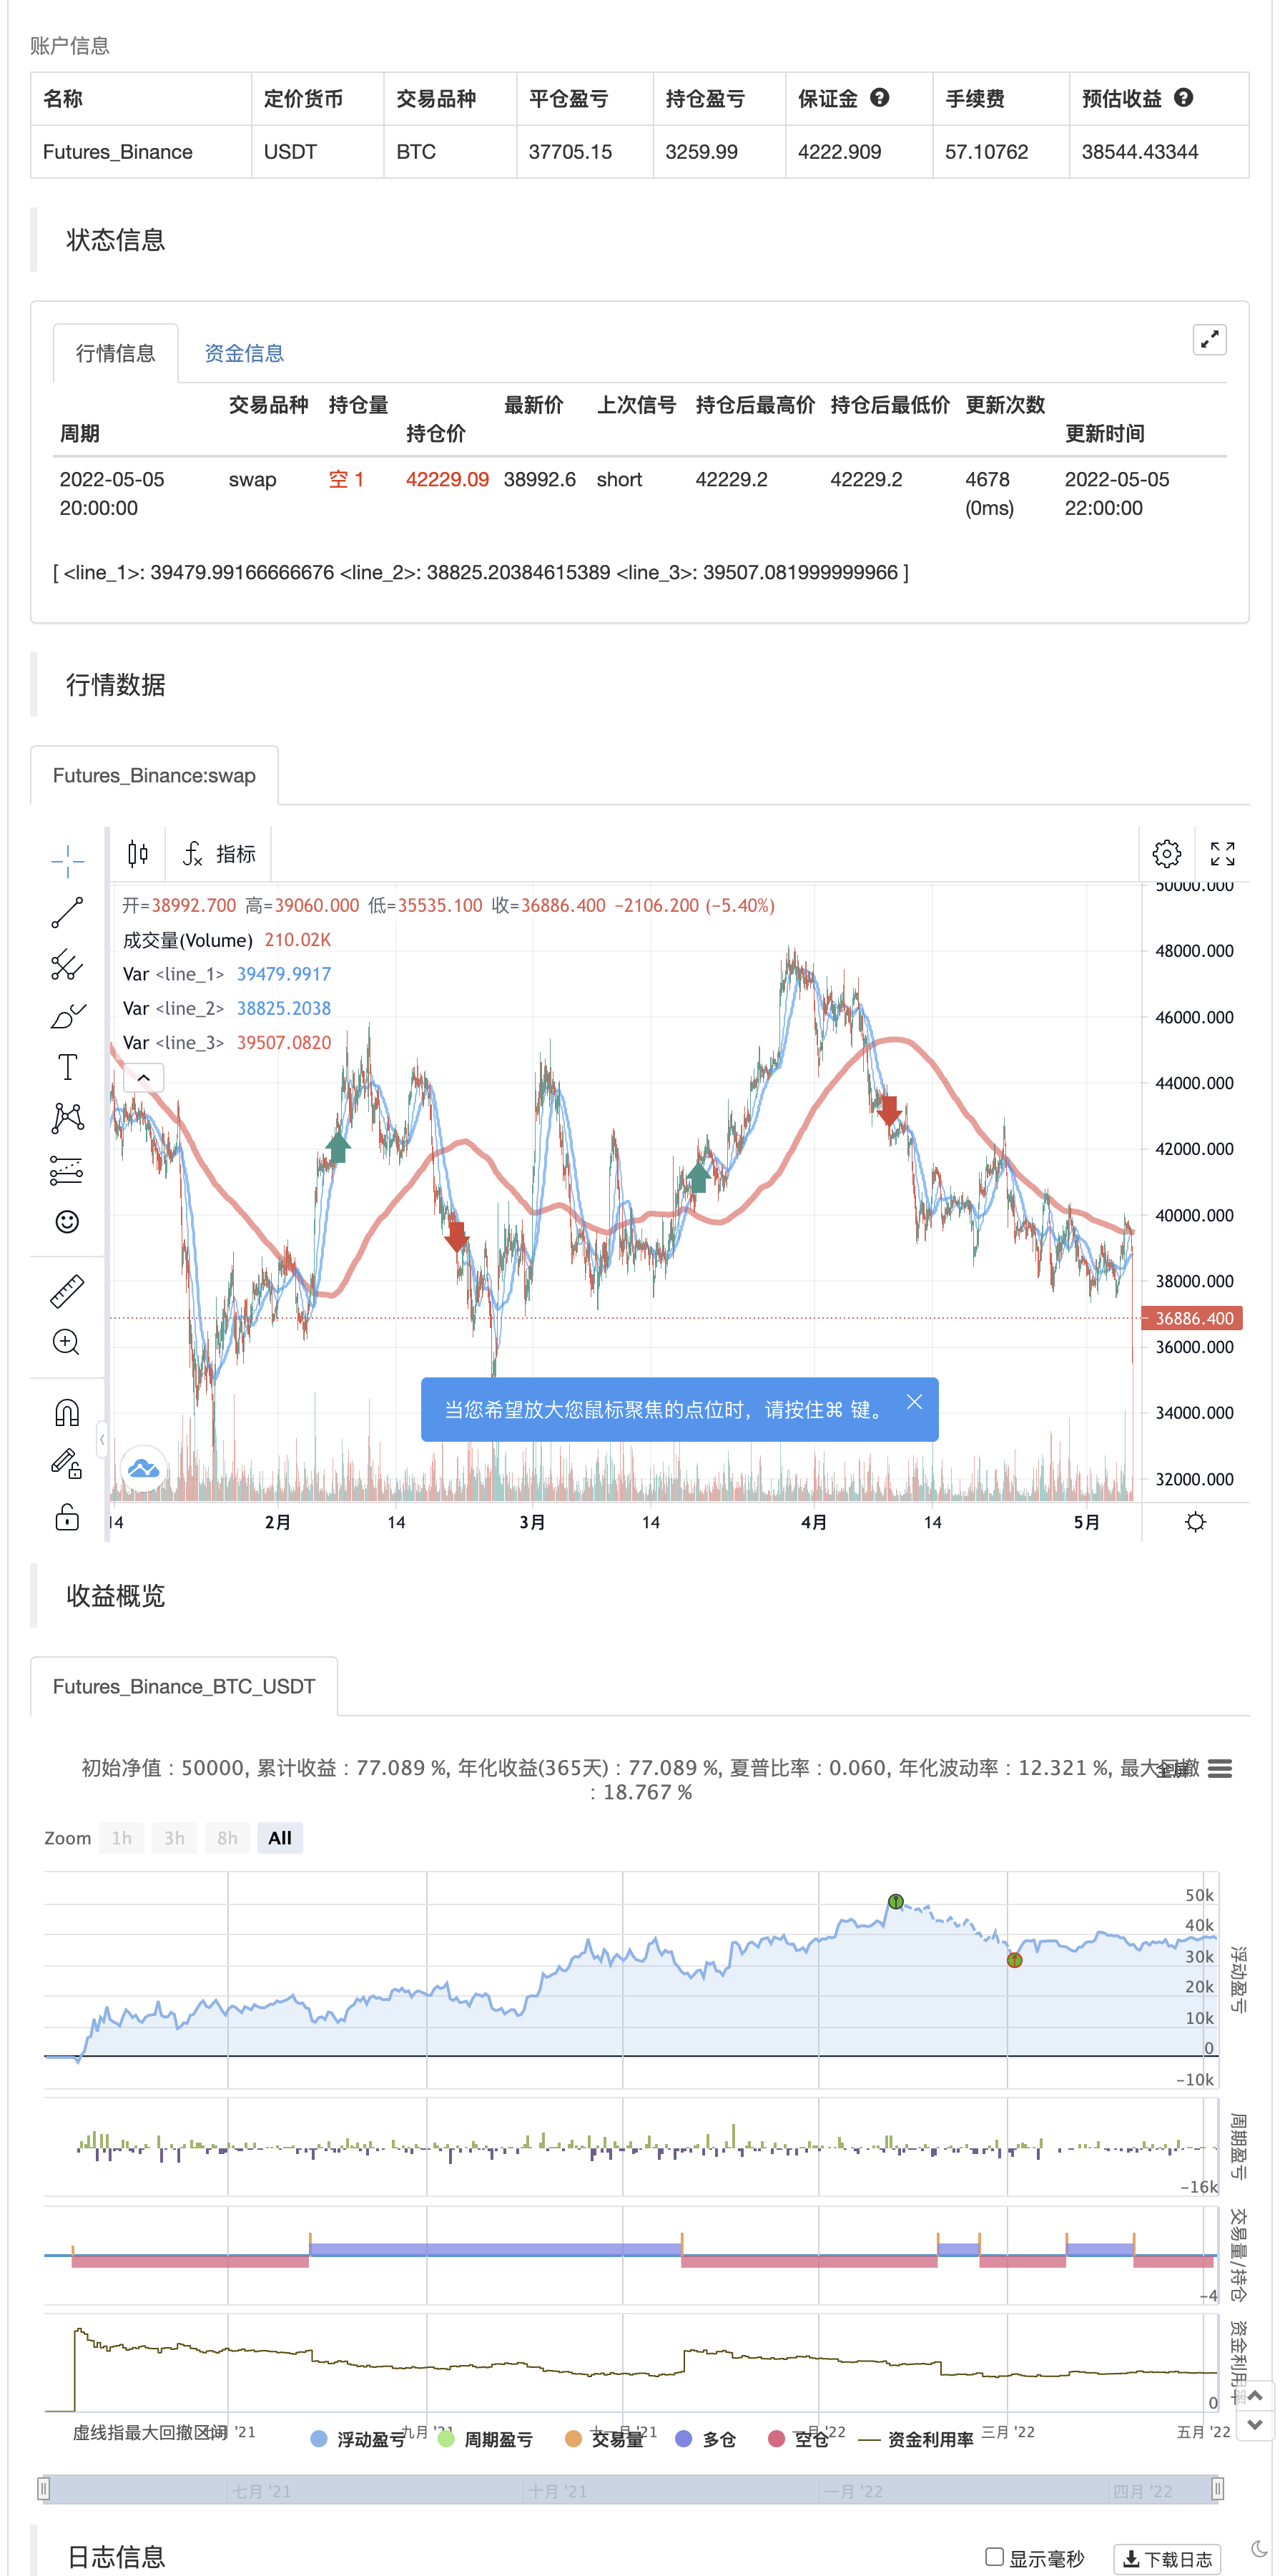
/*backtest
start: 2021-05-06 00:00:00
end: 2022-05-05 23:59:00
period: 2h
basePeriod: 15m
exchanges: [{"eid":"Futures_Binance","currency":"BTC_USDT"}]
*/

//@version=2
strategy("MACD + SMA 200 Strategy (by ChartArt)", shorttitle="CA_-_MACD_SMA_strategy", overlay=true)

// ChartArt's MACD + SMA 200 Strategy
//
// Version 1.0
// Idea by ChartArt on November 30, 2015.
//
// Here is a combination of the MACD with the
// slow moving average SMA 200 as a strategy.
//
// This strategy goes long if the MACD histogram
// and the MACD momentum are both above zero and
// the fast MACD moving average is above the
// slow MACD moving average. As additional long filter
// the recent price has to be above the SMA 200.
// If the inverse logic is true, the strategy
// goes short. For the worst case there is a
// max intraday equity loss of 50% filter.


// Input
source = input(close)
fastLength = input(12, minval=1, title="MACD fast moving average")
slowLength=input(26,minval=1, title="MACD slow moving average")
signalLength=input(9,minval=1, title="MACD signal line moving average")
veryslowLength=input(200,minval=1, title="Very slow moving average")
switch1=input(true, title="Enable Bar Color?")
switch2=input(true, title="Enable Moving Averages?")
switch3=input(true, title="Enable Background Color?")

// Calculation
fastMA = ta.sma(source, fastLength)
slowMA = ta.sma(source, slowLength)
veryslowMA = ta.sma(source, veryslowLength)
macd = fastMA - slowMA
signal = ta.sma(macd, signalLength)
hist = macd - signal

// Colors
MAtrendcolor = change(veryslowMA) > 0 ? color.green : color.red
trendcolor = fastMA > slowMA and change(veryslowMA) > 0 and close > slowMA ? color.green : fastMA < slowMA and change(veryslowMA) < 0 and close < slowMA ? color.red : color.blue
bartrendcolor = close > fastMA and close > slowMA and close > veryslowMA and change(slowMA) > 0 ? color.green : close < fastMA and close < slowMA and close < veryslowMA and change(slowMA) < 0 ? color.red : color.blue
backgroundcolor = slowMA > veryslowMA and crossover(hist, 0) and macd > 0 and fastMA > slowMA and close[slowLength] > veryslowMA ? color.green : slowMA < veryslowMA and crossunder(hist, 0) and macd < 0 and fastMA < slowMA and close[slowLength] < veryslowMA ? color.red : na
//bgcolor(switch3?backgroundcolor:na,transp=80)
//barcolor(switch1?bartrendcolor:na)

// Output
F=plot(switch2?fastMA:na,color=trendcolor)
S=plot(switch2?slowMA:na,color=trendcolor,linewidth=2)
V=plot(switch2?veryslowMA:na,color=MAtrendcolor,linewidth=4)
//fill(F,V,color=gray)

// Strategy
buyprice = low
sellprice = high
cancelLong = slowMA < veryslowMA
cancelShort = slowMA > veryslowMA


if crossover(hist, 0) and macd > 0 and fastMA > slowMA and close[slowLength] > veryslowMA
    strategy.entry("MACDLE", strategy.long, stop=buyprice, comment="Bullish")

else if crossunder(hist, 0) and macd < 0 and fastMA < slowMA and close[slowLength] < veryslowMA
    strategy.entry("MACDSE", strategy.short, stop=sellprice, comment="Bearish")

//maxIdLossPcnt = input(50, "Max Intraday Loss(%)", type=float)
//strategy.risk.max_intraday_loss(maxIdLossPcnt, strategy.percent_of_equity)

//plot(strategy.equity, title="equity", color=red, linewidth=2, style=areabr)
- এমএসিডি আরএসআই ইচিমোকু দীর্ঘ কৌশল অনুসরণ করে গতির প্রবণতা
- পরপর MACD গোল্ডেন এবং ডেথ ক্রস উপর ভিত্তি করে ট্রেডিং কৌশল
- RSI/MACD/ATR এর সাথে EMA ক্রসওভার কৌশল উন্নত
- এমএসিডি এবং আরএসআই সংযুক্ত দীর্ঘমেয়াদী ট্রেডিং কৌশল
- একাধিক সূচক সংমিশ্রণ কৌশল (CCI, DMI, MACD, ADX)
- কৌশল অনুসরণ করে মাল্টি-ইন্ডিকেটর ট্রেন্ড
- সিসিআই, ডিএমআই এবং এমএসিডি হাইব্রিড লং শর্ট স্ট্র্যাটেজি
- ইলিয়ট ওয়েভ থিওরি 4-9 ইমপলস ওয়েভ স্বয়ংক্রিয় সনাক্তকরণ ট্রেডিং কৌশল
- এমএসিডি গোল্ডেন ক্রস এবং ডেথ ক্রস কৌশল
- ম্যাকডি-ভি এবং ফিবোনাচি মাল্টি-টাইমফ্রেম ডায়নামিক টেক লাভ কৌশল
- এমএসিডি বিবি ব্রেকআউট কৌশল
- পাইন ভাষার সংস্করণ
- 3EMA + Boullinger + PIVOT
- মাল্টি-গ্রেন দ্বারা বেগেট
- মিল মেশিন
- K এর বিপরীত সূচক I
- গলিত মোমবাতি
- এমএ সম্রাট ইনসিলিকনোট
- ডেমার্ক রিভার্স পয়েন্টস
- সুইং হাইস/লস এবং ক্যান্ডেল প্যাটার্নস
- টিএমএ ওভারলে
- সিএম স্লিং শট সিস্টেম
- বোলিংজার + আরএসআই, ডাবল স্ট্র্যাটেজি v1.1
- বোলিংজার ব্যান্ড কৌশল
- অপ্টিমাইজড ট্রেন্ড ট্র্যাকার
- পাইনস্ক্রিপ্ট কৌশলগুলিতে মাসিক রিটার্ন
- v4 এর জন্য ADX এবং DI
- ম্যাকডি কাস্টম ইন্ডিকেটর-একাধিক সময় ফ্রেম+সমস্ত উপলব্ধ অপশন!
- সূচকঃ WaveTrend Oscillator
- স্প্রেজ ইমপুটাম ইন্ডিকেটর
- আলফা ট্রেন্ড