MACD + SMA 200-Strategie
Schriftsteller:ChaoZhang, Datum: 2022-05-07 17:13:32Tags:MACD
Hierbei handelt es sich um eine Kombination des klassischen MACD (Median Moving Convergence Divergence Indicator) mit dem klassischen Slow Moving Average SMA mit Periode 200 zusammen als Strategie.
Diese Strategie geht lang, wenn das MACD-Histogramm und das MACD-Impuls sowohl über Null liegen als auch der schnelle MACD- gleitende Durchschnitt über dem langsamen MACD-gleitenden Durchschnitt liegt. Als zusätzlicher langer Filter muss der aktuelle Preis über dem SMA 200 liegen. Wenn die umgekehrte Logik zutrifft, geht die Strategie kurz. Im schlimmsten Fall gibt es einen maximalen Intraday-Equity-Verlust von 50% Filter.
Sparen Sie noch 999 Dollar mit meiner kostenlosen Strategie.
Diese Strategie funktioniert im Backtest auf dem Tagesdiagramm von Bitcoin sowie auf den Tagesdiagrammen des S&P 500 und des Dow Jones Industrial Average. Die aktuelle Performance zum 30. November 2015 auf dem SPX500 CFD-Tag ist prozentuale Gewinnspanne: 68% seit 1970 mit einem Gewinnfaktor von 6.4. Die aktuelle Performance zum 30. November 2015 auf dem DOWI-Index ist prozentuale Gewinnspanne: 51% seit 1915 mit einem Gewinnfaktor von 10.8.
Alle Trades beinhalten ein hohes Risiko; vergangene Performance ist nicht unbedingt ein Hinweis auf zukünftige Ergebnisse. Hypothetische oder simulierte Performance-Ergebnisse haben bestimmte inhärente Einschränkungen. Im Gegensatz zu einem tatsächlichen Performance-Record repräsentieren simulierte Ergebnisse nicht den tatsächlichen Handel. Da die Trades nicht tatsächlich ausgeführt wurden, können die Ergebnisse unter- oder überkompensiert sein für die Auswirkungen bestimmter Marktfaktoren, wie etwa Mangel an Liquidität. Simulierte Trading-Programme sind im Allgemeinen auch der Tatsache unterworfen, dass sie mit dem Vorteil des Rückblicks konzipiert wurden.
Zurückprüfung
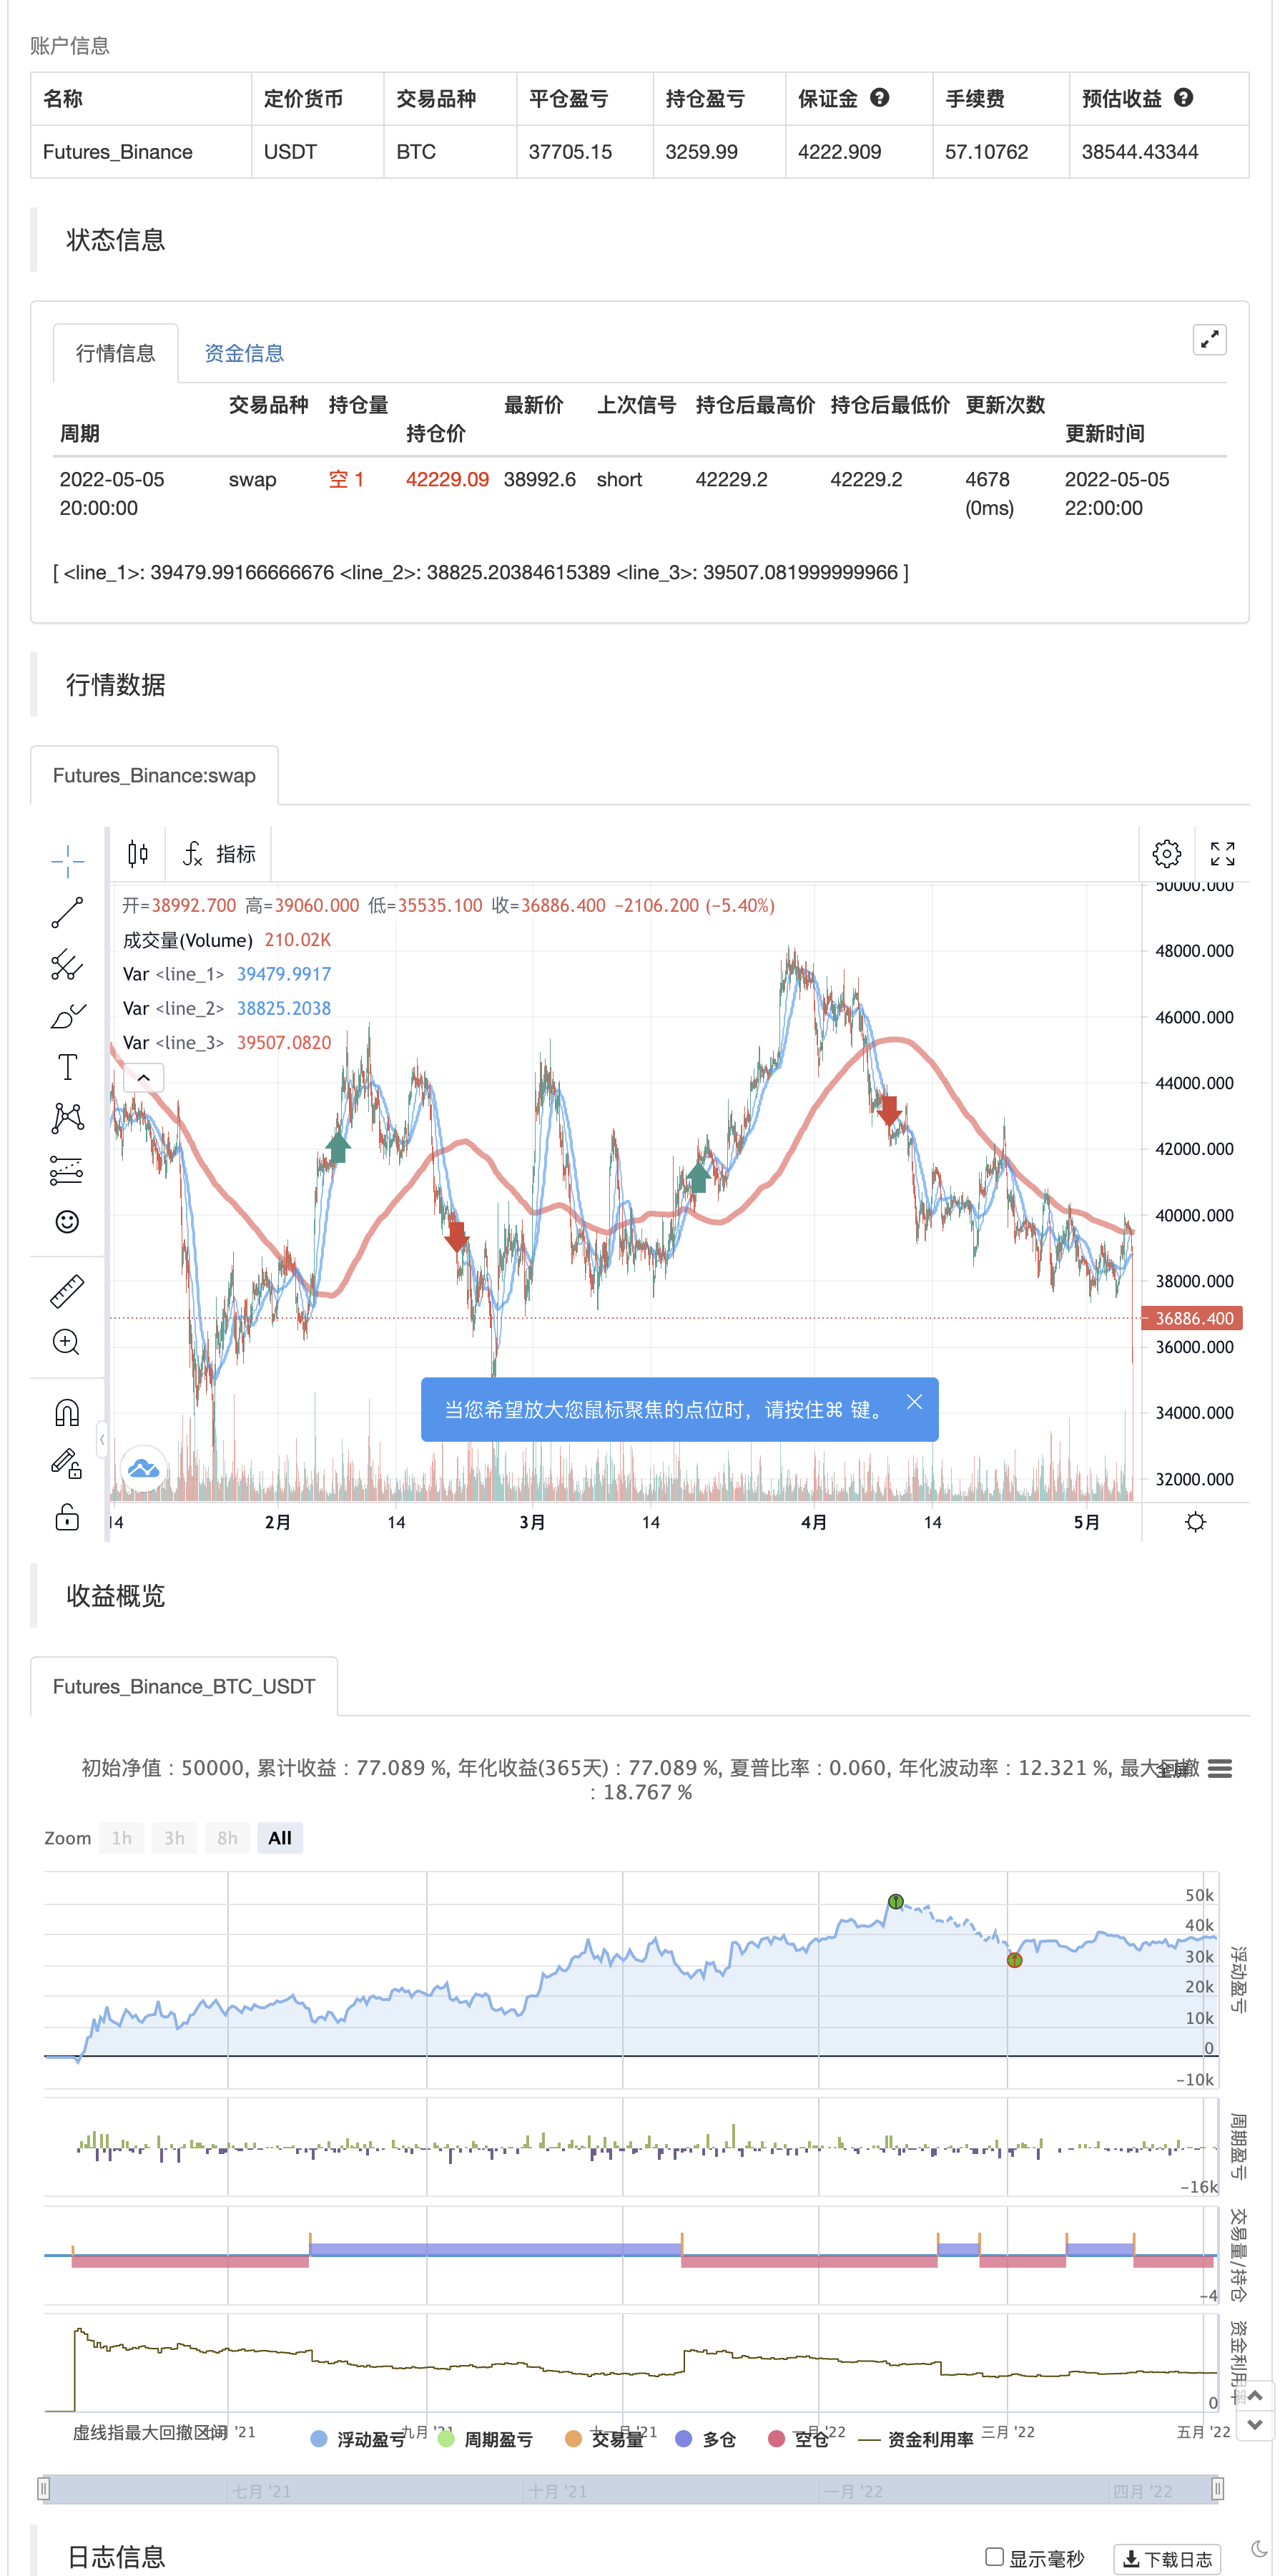
/*backtest
start: 2021-05-06 00:00:00
end: 2022-05-05 23:59:00
period: 2h
basePeriod: 15m
exchanges: [{"eid":"Futures_Binance","currency":"BTC_USDT"}]
*/

//@version=2
strategy("MACD + SMA 200 Strategy (by ChartArt)", shorttitle="CA_-_MACD_SMA_strategy", overlay=true)

// ChartArt's MACD + SMA 200 Strategy
//
// Version 1.0
// Idea by ChartArt on November 30, 2015.
//
// Here is a combination of the MACD with the
// slow moving average SMA 200 as a strategy.
//
// This strategy goes long if the MACD histogram
// and the MACD momentum are both above zero and
// the fast MACD moving average is above the
// slow MACD moving average. As additional long filter
// the recent price has to be above the SMA 200.
// If the inverse logic is true, the strategy
// goes short. For the worst case there is a
// max intraday equity loss of 50% filter.


// Input
source = input(close)
fastLength = input(12, minval=1, title="MACD fast moving average")
slowLength=input(26,minval=1, title="MACD slow moving average")
signalLength=input(9,minval=1, title="MACD signal line moving average")
veryslowLength=input(200,minval=1, title="Very slow moving average")
switch1=input(true, title="Enable Bar Color?")
switch2=input(true, title="Enable Moving Averages?")
switch3=input(true, title="Enable Background Color?")

// Calculation
fastMA = ta.sma(source, fastLength)
slowMA = ta.sma(source, slowLength)
veryslowMA = ta.sma(source, veryslowLength)
macd = fastMA - slowMA
signal = ta.sma(macd, signalLength)
hist = macd - signal

// Colors
MAtrendcolor = change(veryslowMA) > 0 ? color.green : color.red
trendcolor = fastMA > slowMA and change(veryslowMA) > 0 and close > slowMA ? color.green : fastMA < slowMA and change(veryslowMA) < 0 and close < slowMA ? color.red : color.blue
bartrendcolor = close > fastMA and close > slowMA and close > veryslowMA and change(slowMA) > 0 ? color.green : close < fastMA and close < slowMA and close < veryslowMA and change(slowMA) < 0 ? color.red : color.blue
backgroundcolor = slowMA > veryslowMA and crossover(hist, 0) and macd > 0 and fastMA > slowMA and close[slowLength] > veryslowMA ? color.green : slowMA < veryslowMA and crossunder(hist, 0) and macd < 0 and fastMA < slowMA and close[slowLength] < veryslowMA ? color.red : na
//bgcolor(switch3?backgroundcolor:na,transp=80)
//barcolor(switch1?bartrendcolor:na)

// Output
F=plot(switch2?fastMA:na,color=trendcolor)
S=plot(switch2?slowMA:na,color=trendcolor,linewidth=2)
V=plot(switch2?veryslowMA:na,color=MAtrendcolor,linewidth=4)
//fill(F,V,color=gray)

// Strategy
buyprice = low
sellprice = high
cancelLong = slowMA < veryslowMA
cancelShort = slowMA > veryslowMA


if crossover(hist, 0) and macd > 0 and fastMA > slowMA and close[slowLength] > veryslowMA
    strategy.entry("MACDLE", strategy.long, stop=buyprice, comment="Bullish")

else if crossunder(hist, 0) and macd < 0 and fastMA < slowMA and close[slowLength] < veryslowMA
    strategy.entry("MACDSE", strategy.short, stop=sellprice, comment="Bearish")

//maxIdLossPcnt = input(50, "Max Intraday Loss(%)", type=float)
//strategy.risk.max_intraday_loss(maxIdLossPcnt, strategy.percent_of_equity)

//plot(strategy.equity, title="equity", color=red, linewidth=2, style=areabr)
- MACD RSI Ichimoku Momentum Trend nach langfristiger Strategie
- Handelsstrategie auf der Grundlage von aufeinanderfolgenden MACD-Gold- und Todeskreuzungen
- Erweiterte EMA-Crossover-Strategie mit RSI/MACD/ATR
- Kombination von MACD und RSI für die langfristige Handelsstrategie
- Strategie zur Kombination von mehreren Indikatoren (CCI, DMI, MACD, ADX)
- Mehrindikatortrend nach Strategie
- Die Kommission stellt fest, dass die in den Erwägungsgründen 1 und 2 genannten Risikopositionen nicht berücksichtigt werden dürfen.
- Elliott-Wellen-Theorie 4-9 Impulswellen automatische Detektion Handelsstrategie
- MACD Goldene Kreuz- und Todekreuzstrategie
- MACD-V und Fibonacci Multi-Timeframe Dynamic Take Profit-Strategie
- MACD BB Breakout-Strategie
- Das ist eine sehr einfache Strategie für die Schwankungsrate.
- 3EMA + Boullinger + PIVOT
- Baguette nach Mehrkorn
- - Die Maschine.
- K-Umkehrindikator I
- Schwelende Kerzen
- MA Kaiser insilliconot
- Demark-Umkehrpunkte
- Swing Highs/Lows und Kerzenmuster
- TMA-Überlagerung
- CM-Schleudersystem
- Bollinger + RSI, Doppelstrategie v1.1
- Bollinger-Band-Strategie
- Optimierter Trend-Tracker
- Monatliche Renditen in PineScript-Strategien
- ADX und DI für v4
- MacD-Anpassungsindicator - mehrfacher Zeitrahmen + alle verfügbaren Optionen!
- Indikator: WaveTrend-Oszillator
- Indikator für die Druckdynamik
- Alpha-Trend