Williams %R - Glättet
Schriftsteller:ChaoZhang, Datum: 2022-05-09 12:04:48Tags:WMAEMA
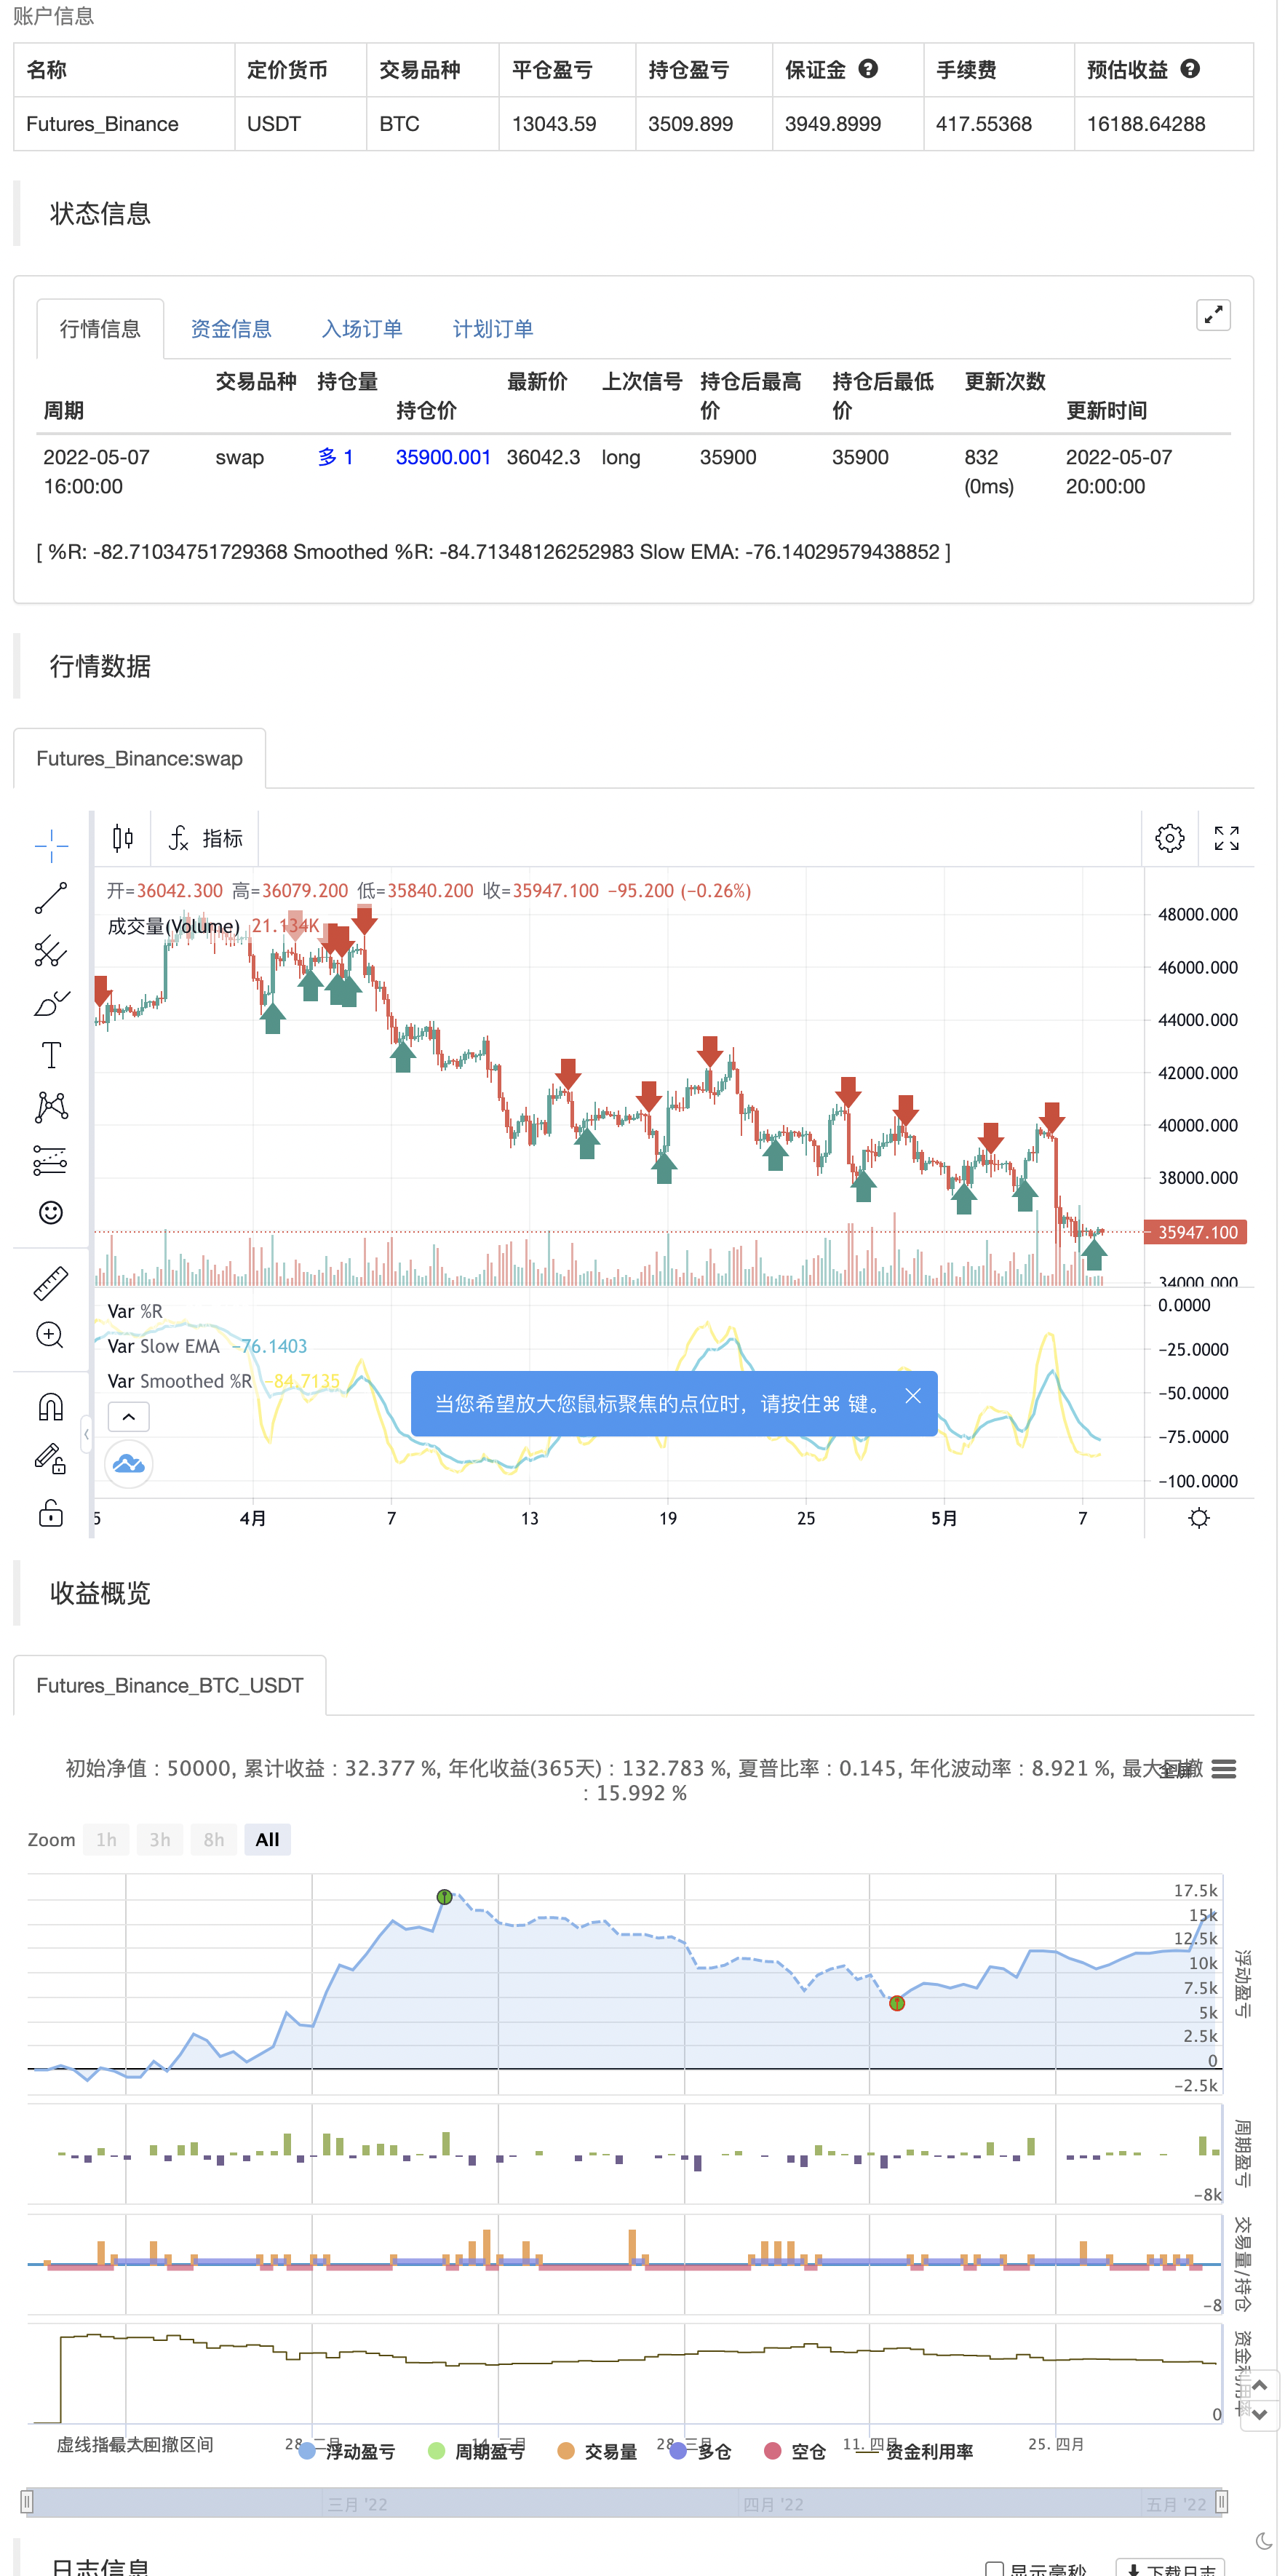
Aus der Beschreibung von TradingView: Der Williams %R (%R) ist ein momentumbasierter Oszillator, der in der technischen Analyse verwendet wird, um vor allem überkaufte und überverkaufte Bedingungen zu identifizieren. Der %R basiert auf einem Vergleich zwischen dem aktuellen Schließen und dem höchsten Höchststand für einen vom Benutzer definierten Rückblickzeitraum. %R oszilliert zwischen 0 und -100 (beachten Sie die negativen Werte), wobei Messwerte näher an Null liegen, was mehr überkaufte Bedingungen anzeigt, und Messwerte näher an -100, die überverkaufte Bedingungen anzeigen.
Was ist so Besonderes? Dieser Indikator fügt zwei zusätzliche EMA-Linien zum ursprünglichen Williams %R-Indikator hinzu. Dieser Indikator umfaßt:
- EMA-Kreuzungen können dazu beitragen, bestätigte Trendänderungen anzuzeigen.
- Standardfarben sind blau und orange
Es gibt Warnungen für bullische/bärenische Kreuzungen und Umkehrungen.
Genießen Sie~~!
Zurückprüfung
/*backtest
start: 2022-02-08 00:00:00
end: 2022-05-08 00:00:00
period: 4h
basePeriod: 15m
exchanges: [{"eid":"Futures_Binance","currency":"BTC_USDT"}]
*/

// This source code is subject to the terms of the Mozilla Public License 2.0 at https://mozilla.org/MPL/2.0/
// © platsn

//@version=5
indicator(title='Williams %R - Smoothed', shorttitle='The Smooth Willy')

// Williams %R
length = input.int(defval=34, minval=1)
upper = ta.highest(length)
lower = ta.lowest(length)

output = 100 * (close - upper) / (upper - lower)

fast_period = input(defval=5, title='Smoothed %R Length')
slow_period = input(defval=13, title='Slow EMA Length')

fast_ema = ta.wma(output,fast_period)
slow_ema = ta.ema(output,slow_period)

// Plot
//h1 = hline(-20, title='Upper Band')
//h2 = hline(-80, title='Lower Band')
//fill(h1, h2, title='Background', transp=90)

plot(output, title='%R', color=color.new(color.white, 80), linewidth=1)
plot(fast_ema, title='Smoothed %R', color=color.new(color.yellow, 0), linewidth=2)
plot(slow_ema, title='Slow EMA', color=color.new(color.aqua, 0), linewidth=2)

bullX = ta.crossover(fast_ema, slow_ema)
bearX = ta.crossunder(fast_ema, slow_ema)
bullreverse = fast_ema[2] > fast_ema[1] and fast_ema > fast_ema[1] and fast_ema < -30
bearreverse = fast_ema[2] < fast_ema[1] and fast_ema < fast_ema[1] and fast_ema > -70

plotX = input.bool(true, "Show EMA Crossovers")
plotRev = input.bool(true, "Show trend reversals")

//plotshape(plotX and bearX ,"Cross down", color=color.red, style=shape.triangledown, location = location.top, size =size.tiny, offset=-1)
//plotshape(plotX and bullX ,"Cross up", color=color.green, style=shape.triangleup, location = location.bottom, size =size.tiny, offset=-1)
//plotshape(plotRev and bearreverse ,"Bear reversal", color=color.orange, style=shape.triangledown, location = location.top, size =size.tiny, offset=-1)
//plotshape(plotRev and bullreverse ,"Bull reversal", color=color.blue, style=shape.triangleup, location = location.bottom, size =size.tiny, offset=-1)

//alertcondition(bearX,"Bearish Crossover", "Bearish cross on William %R")
//alertcondition(bullX,"Bullish Crossover", "Bullish cross on William %R")
//alertcondition(bearreverse,"Bearish Reversal", "Bearish Reversal on William %R")
//alertcondition(bullreverse,"Billish Reversal", "Bullish Reversal on William %R")

if plotRev and bullreverse
    strategy.entry("Enter Long", strategy.long)
else if plotRev and bearreverse
    strategy.entry("Enter Short", strategy.short)
- Low Scanner Strategie Krypto
- Quantitative Handelsstrategie auf der Grundlage gleitender Durchschnitte und Bollinger-Bänder
- RedK Volumen-Beschleunigte Richtungsenergie-Verhältnis
- HALFTREND + HEMA + SMA (Falschsignal-Strategie)
- Swing Hull/rsi/EMA-Strategie
- Beweglicher Durchschnittsquerschnitt, mehrjährig (MTF)
- BESTE Verschlucken + Ausbruchstrategie
- RedK Dual VADER mit Energiestangen
- RedK-Momentumsbalken
- Regenbogen-Oszillator
- Der Wert des Wertpapiers ist der Wert des Wertpapiers, der für den Wertpapiermarkt verwendet wird.
- Chande Kroll Stopp
- CCI + EMA mit RSI-Kreuzstrategie
- EMA-Bänder + leledc + Bollinger-Bänder Trend-Catching-Strategie
- RSI MTF Ob+Os
- MACD-Willystrategie
- RSI - Kauf-Verkaufssignale
- Heikin-Aschi-Trend
- HA Marktverzerrung
- Ichimoku Wolken glatter Oszillator
- QQE MOD + SSL Hybrid + Waddah Attar Explosion
- Kauf/Verkauf von Strat
- Triple Supertrend mit EMA und ADX
- Tom DeMark Sequentielle Wärmekarte
- jma + dwma für Mehrkornprodukte
- MACD-Wert
- Z-Score mit Signalen
- Das ist eine sehr einfache Strategie für die Schwankungsrate.
- 3EMA + Boullinger + PIVOT
- Baguette nach Mehrkorn