MTF-RSI und STOCH-Strategie
Schriftsteller:ChaoZhang, Datum: 2022-05-10 10:41:43 UhrTags:SMA
Diese gemeinsame Nutzung ist ein Indikator, bei dem Sie den Durchschnitt verschiedener Zeitrahmen sehen können.
Der RSI ist die blaue Linie Die gelbe Linie ist die Aktie.
Sie können den Zeitrahmen in den Parametern verwalten.
Die Strategie besteht darin, eine Position einzunehmen, wenn die beiden Linien überkauft oder überverkauft werden und zu schließen, wenn der Aktien- und RSI-Wert in die Mitte geht.
Zurückprüfung
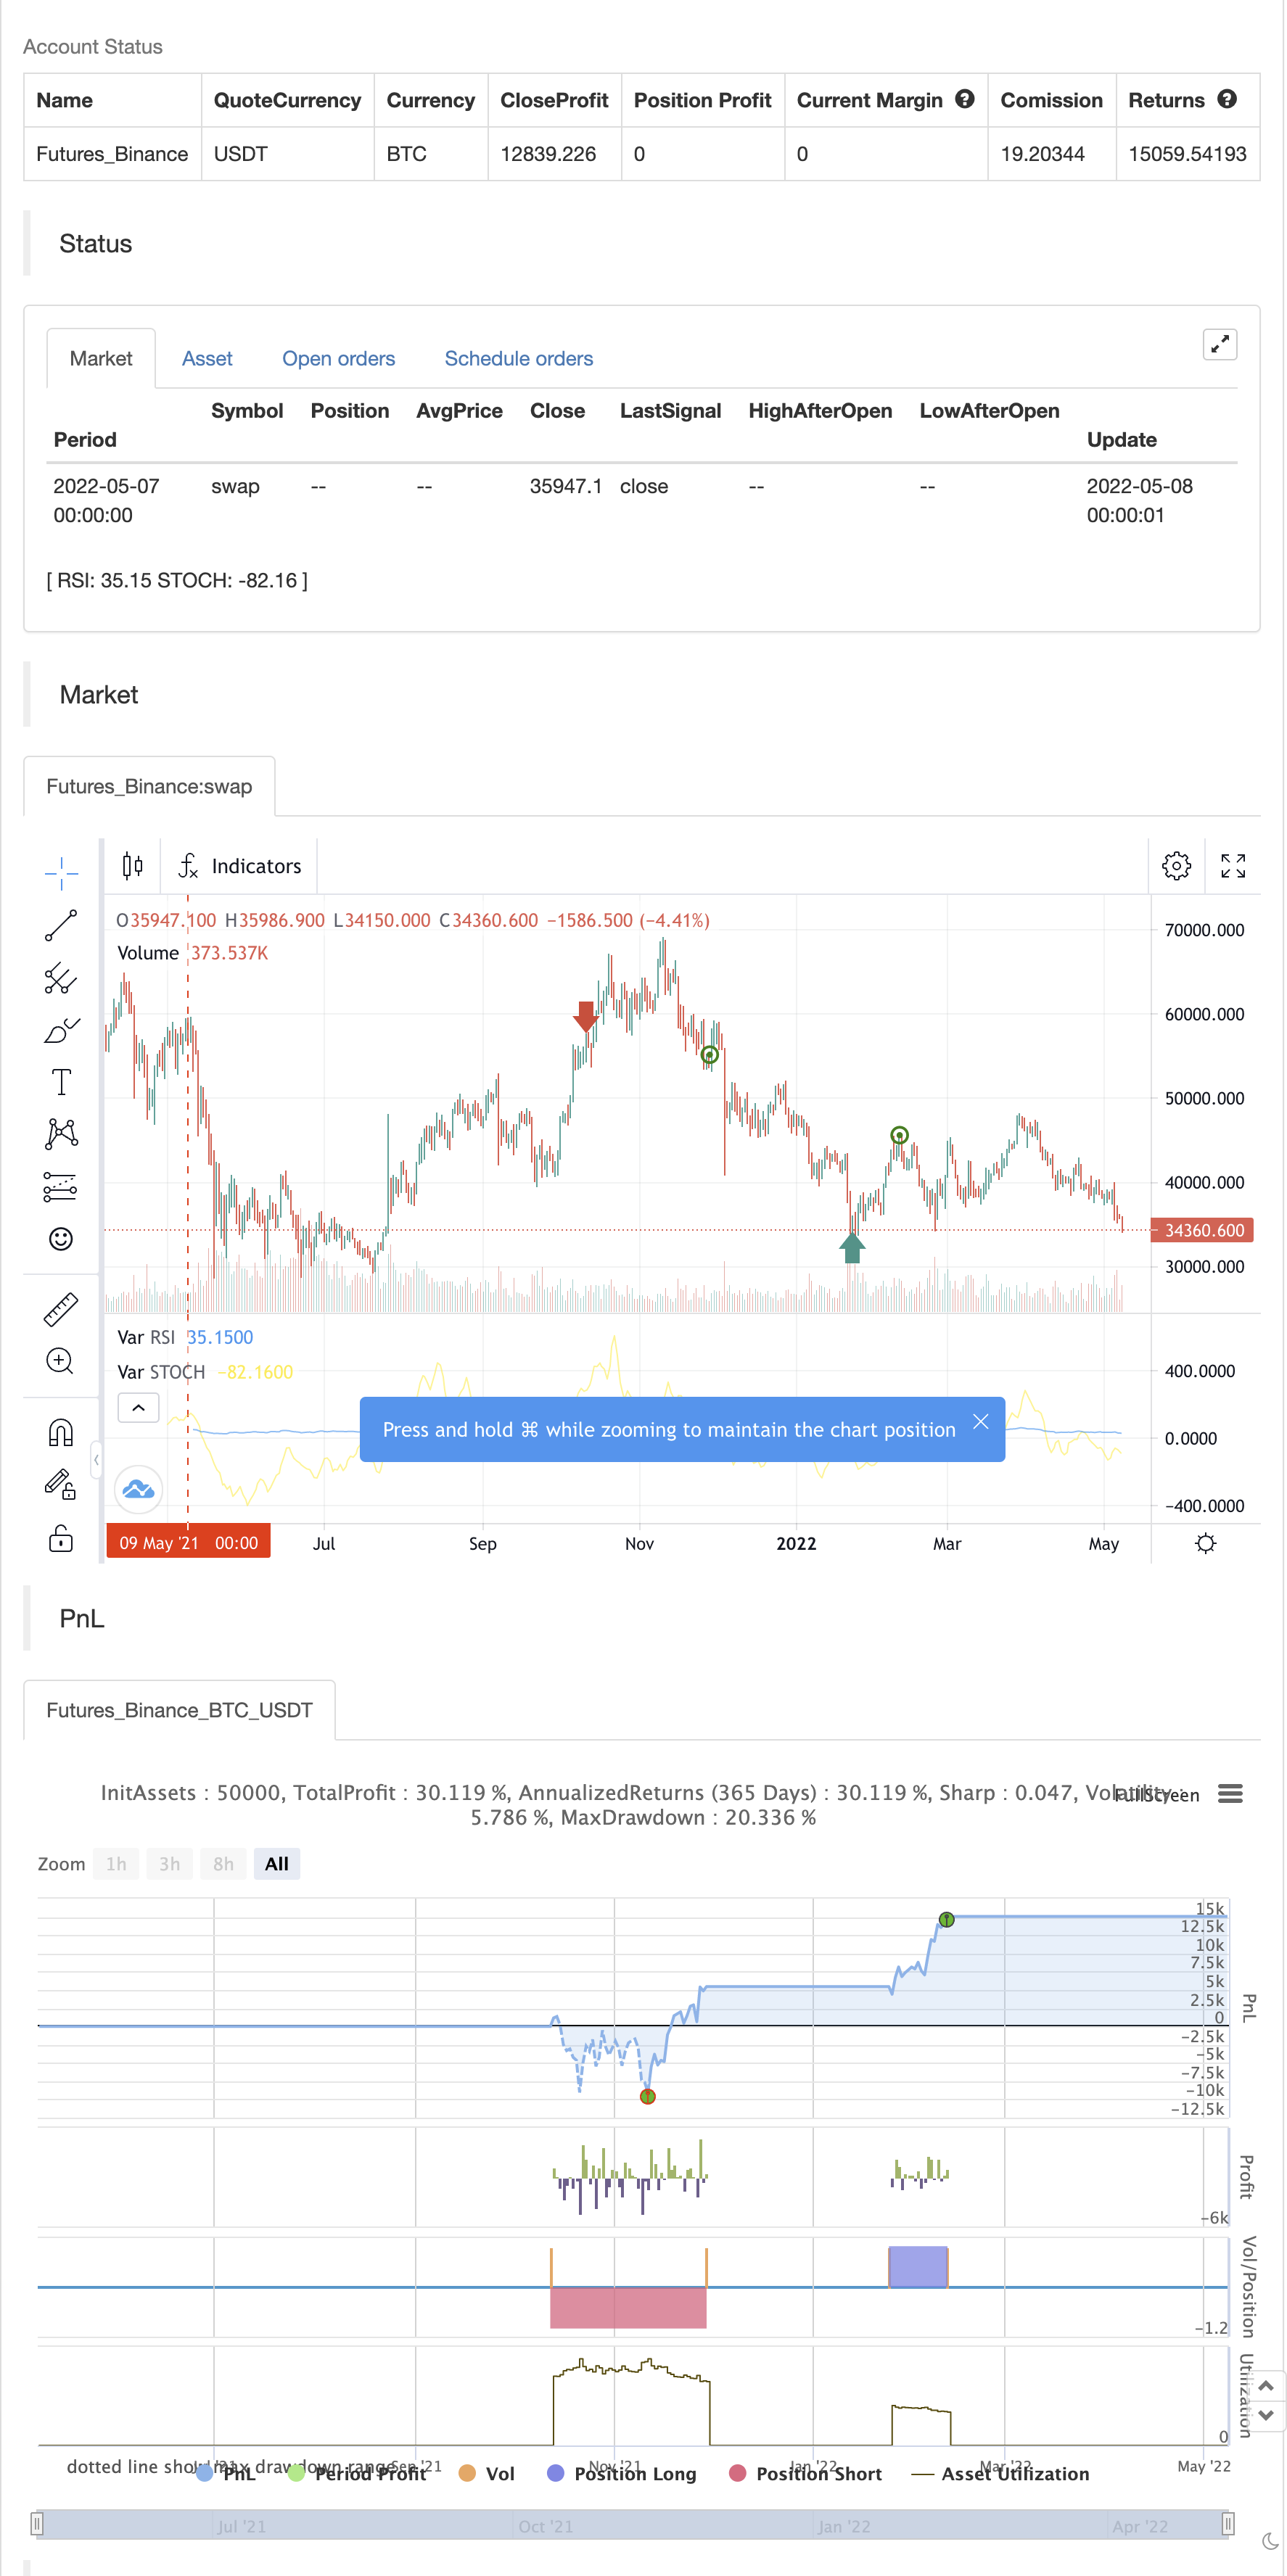
/*backtest
start: 2021-05-09 00:00:00
end: 2022-05-08 23:59:00
period: 1d
basePeriod: 1h
exchanges: [{"eid":"Futures_Binance","currency":"BTC_USDT"}]
*/

////////////////////////////////////////// MTF Stochastic & RSI Strategy ©️ bykzis /////////////////////////////////////////
//

// *** Inspired by "Binance CHOP Dashboard" from @Cazimiro and "RSI MTF Table" from @mobester16 *** and LOT OF COPY of Indicator-Jones MTF Scanner
//
////////////////////////////////////////////////////////////////////////////////////////////////////////////////////////////

//@version=5
//strategy('MTF RSI & STOCH Strategy', overlay=false,initial_capital=100, currency=currency.USD, commission_value=0.01, commission_type=strategy.commission.percent)


// Pair list
var string GRP1       = '══════════    General    ══════════'
overbought = input.int(80, 'Overbought Level', minval=1, group=GRP1)
oversold = input.int(20, 'Oversold Level', minval=1, group=GRP1)


/// Timeframes
var string GRP2       = '══════════   Timeframes   ══════════'
timeframe1 = input.timeframe(title="Timeframe 1", defval="W", group=GRP2)
timeframe2 = input.timeframe(title="Timeframe 2", defval="D", group=GRP2)
timeframe3 = input.timeframe(title="Timeframe 3", defval="240", group=GRP2)
timeframe4 = input.timeframe(title="Timeframe 4", defval="60", group=GRP2)

// RSI settings
var string GRP3       = '══════════   RSI settings   ══════════'
rsiLength = input.int(14, minval=1, title='RSI length', group=GRP3)
rsiSource = input(close, 'RSI Source', group=GRP3)
rsioverbought = input.int(70, 'RSI Overbought Level', minval=1, group=GRP3)
rsioversold = input.int(30, 'RSI Oversold Level', minval=1, group=GRP3)


/// Get RSI values of each timeframe /////////////////////////////////////////////////////
rsi = ta.rsi(rsiSource, rsiLength)
callRSI(id,timeframe) =>
    rsiValue = request.security(id, str.tostring(timeframe), rsi, gaps=barmerge.gaps_off)
    rsiValue

RSI_TF1 = callRSI(syminfo.tickerid, timeframe1)
RSI_TF2 = callRSI(syminfo.tickerid, timeframe2)
RSI_TF3 = callRSI(syminfo.tickerid, timeframe3)
RSI_TF4 = callRSI(syminfo.tickerid, timeframe4)


/////// Calculate Averages /////////////////////////////////////////////////////////////////
calcAVG(valueTF1, valueTF2, valueTF3, valueTF4) =>
    math.round((valueTF1 + valueTF2 + valueTF3 + valueTF4) / 4, 2)

AVG=calcAVG(RSI_TF1, RSI_TF2, RSI_TF3, RSI_TF4)


// Stochastic settings
var string GRP4       = '══════════   Stochastic settings   ══════════'
periodK = input.int(14, '%K length', minval=1, group=GRP4)
smoothK = input.int(3, 'Smooth K', minval=1, group=GRP4)
stochSource = input(close, 'Stochastic Source', group=GRP4)
stochoverbought = input.int(70, 'Stochastic Overbought Level', minval=1, group=GRP4)
stochoversold = input.int(30, 'Stochastic Oversold Level', minval=1, group=GRP4)


/// Get Stochastic values of each timeframe ////////////////////////////////////////////////
stoch = ta.sma(ta.stoch(stochSource, high, low, periodK), smoothK)
getStochastic(id,timeframe) =>
    stochValue = request.security(id, str.tostring(timeframe), stoch, gaps=barmerge.gaps_off)
    stochValue

Stoch_TF1 = getStochastic(syminfo.tickerid, timeframe1)
Stoch_TF2 = getStochastic(syminfo.tickerid, timeframe2)
Stoch_TF3 = getStochastic(syminfo.tickerid, timeframe3)
Stoch_TF4 = getStochastic(syminfo.tickerid, timeframe4)


AVG_STOCH=calcAVG(Stoch_TF1, Stoch_TF2, Stoch_TF3, Stoch_TF4)


plot(AVG, color = color.blue, title='RSI')
plot(AVG_STOCH, color = color.yellow,title='STOCH')
hline(rsioverbought,color=color.red)
hline(rsioversold, color=color.lime)
hline(50, color=color.white)

//============ signal Generator ==================================//

if AVG <= rsioversold and AVG_STOCH <=stochoversold
    strategy.entry('Buy_Long', strategy.long)


strategy.close("Buy_Long",when=(AVG_STOCH >=70 and AVG >=50 and close >=strategy.position_avg_price),comment="Long_OK")

if AVG >=rsioverbought and AVG_STOCH >=stochoverbought
    strategy.entry('Buy_Short', strategy.short)


strategy.close("Buy_Short",when=(AVG_STOCH <=30 and AVG <=50 and close <=strategy.position_avg_price),comment="Short_OK")


///////////////////////////////////////////////////////////////////////////////////////////
Verwandt
- Kurz-Mittel-Langfristiger dreifacher gleitender Durchschnitt nach Strategie
- Dynamische Gewinn- und Stop-Loss-Handelsstrategie auf Basis von drei aufeinanderfolgenden bearish Kerzen und gleitenden Durchschnitten
- MOST- und Doppel gleitender Durchschnitts-Crossover-Strategie
- Bollinger Bands Stochastischer Oszillator-Strategie
- Strategie für den Eintritt in den Kreuzverkehr mit doppelten gleitenden Durchschnitten
- Strategie für die Verlagerung des gleitenden Durchschnitts
- Bollinger-Band-Breakout-Strategie
- Bollinger-Bänder Standardabweichungs-Breakout-Strategie
- Bollinger-Bänder Doppelstandardabweichung Filterung 5-minütige quantitative Handelsstrategie
- Multi-Zeitrahmen Bitcoin, Binance Coin und Ethereum Pullback Trading Strategie
- MA99 Touch und dynamische Stop-Loss-Strategie
Mehr
- Kleine Fraktalen (+ Transparenz)
- BB-RSI-ADX-Eingangspunkte
- Hull-4ema
- Winkel Angriff Linie Anzeige folgen
- KijunSen Linie mit Kreuz
- AMACD - Divergenz aller gleitenden Durchschnittskonvergenzen
- MA HYBRID von RAJ
- Diamanttrend
- Nik Stoch
- Stoch supertrd ATR 200mA
- EMA + AROON + ASH
- Momentum 2.0
- EHMA-Bereichsstrategie
- Beweglicher durchschnittlicher Kauf-Verkauf
- Midas Mk. II - Der ultimative Krypto-Swing
- TMA-Legacy
- TV-Hoch-Niedrig-Strategien
- Beste TradingView-Strategie
- Der Wert des Wertpapiers ist der Wert des Wertpapiers, der für den Wertpapiermarkt verwendet wird.
- Chande Kroll Stopp