Zurückprüfung - Indikator
Schriftsteller:ChaoZhang, Datum: 2022-05-17 13:59:05 UhrTags:EMA
Für alle Interessierten, Hier ist ein Beispiel, wie man Backtesting Ergebnisse in einen Indikator zu setzen. Dies berechnet die gleichen Werte, wie Sie in der Zusammenfassung Bildschirm des integrierten Strategie backtester finden. Dies wird die gleiche Ergebnisgröße wie der Standard-Backtester, dh 5 Minuten Chart greift etwa 1 Monat Daten, 1 Minute Chart greift 1 Woche Daten, usw. verwenden... Ich habe versucht, dies so in sich geschlossen wie möglich zu halten, so dass ich die meisten der Code für die Ergebnisse in den unteren Teil des Indikators. Die Ergebnisse stoppen bei der letzten abgeschlossenen Handelssignal dh ein Kauf hat einen Verkauf zu ihm. Dies ist der gleiche Indikator, den ich früher mit dem PCT Trailing StopLoss gepostet, so dass Sie diesen Code auch hier sehen. Wie in meinem vorherigen Beitrag gesagt, ist der Indikator nur ein einfaches Crossover EMA, um es etwas nützlich zu geben und ich würde nicht empfehlen, diesen Indikator auf eigene Faust zu verwenden, aber wenn Sie eine Kopie des Indikators haben
Zusätzliche Anmerkungen:
- Die Ergebnisse liegen innerhalb einer akzeptablen Fehlermarge aufgrund der Tatsache, dass der Indikator basierend darauf berechnen muss, wann das Kauf- und Verkaufssignal stattfindet, im Gegensatz zu dem Zeitpunkt, an dem tatsächliche Trades wie im Strategie-Backtester stattfinden.
- Ich habe versucht, einen Weg zu finden, um die Anzahl der Kaufsignale zu verwenden, d.h. mir die Ergebnisse der letzten 100 Trades zu zeigen, aber konnte die Logik nicht sortieren. Ich bin offen für Vorschläge. Denken Sie auch daran, dass ich kein Programmierer bin, also wenn Sie irgendwelche Ideen auf dieser Front haben, erklären Sie es mir bitte, als wäre ich ein 5-jähriges Kind und geben Sie Codebeispiele, wenn möglich :)
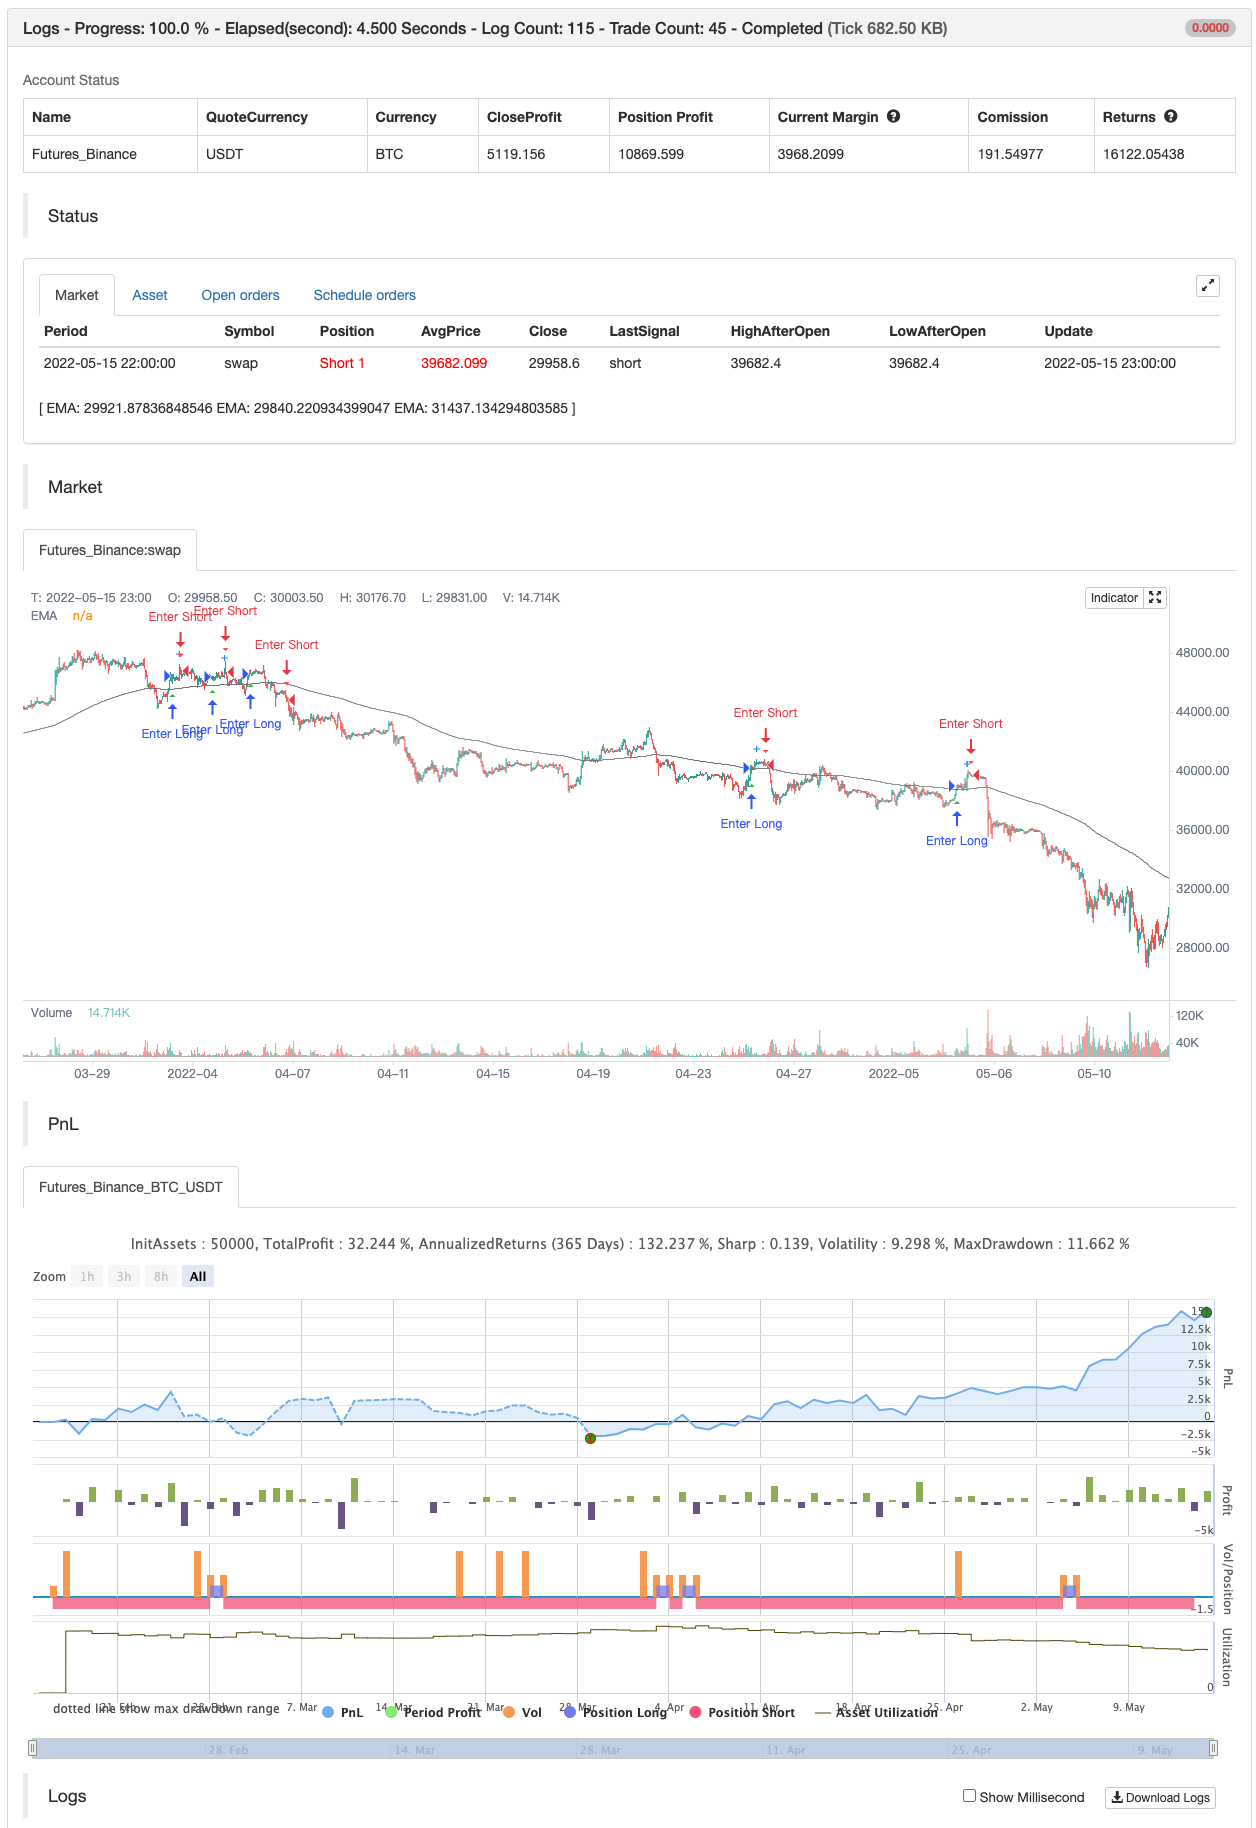
- Ich habe die Ergebnisse der Strategie in die Screenshots aufgenommen, damit Sie sehen können, wo die Ergebnisse stehen. Zusätzliche Anmerkung: Dies ist keine finanzielle Beratung.
Zurückprüfung
/*backtest
start: 2022-02-16 00:00:00
end: 2022-05-16 00:00:00
period: 1h
basePeriod: 15m
exchanges: [{"eid":"Futures_Binance","currency":"BTC_USDT"}]
*/

// This source code is subject to the terms of the Mozilla Public License 2.0 at https://mozilla.org/MPL/2.0/
// © Thumpyr
//@version=5

/////////////////////////////////////////////////////////////////////////////////////////////
// Comment out Strategy Line and remove // from Indicator line to turn into Indicator  //////
// Do same for alertConidction at bottom                                               //////
/////////////////////////////////////////////////////////////////////////////////////////////
//strategy("Backtesting-Strategy", shorttitle="Backtesting- Strategy", overlay=true, margin_long=100, margin_short=100, default_qty_type=strategy.percent_of_equity,default_qty_value=90, commission_type=strategy.commission.percent, commission_value=.075)
indicator(title="Backtesting- Indicator", shorttitle="Backtesting - Indicator", overlay=true)//


openBalance  =input.float(3000, minval=0, title="Opening Balance:", group="Back Test")
pctAllocated =input.float(.9, minval=0, title="Allocated % (90% = .9):", group="Back Test")
commission   =input.float(.075, minval=0, title="Commission%", group="Back Test")


sellLow=input.float(.035, minval=0, title="Stop Loss Loss: 1% = .01", group="Sell Settings")
trailStopArm=input.float(.0065, minval=0, title="Trailing Stop Arm: 1%=.01", group="Sell Settings")
trailStopPct=input.float(.003, minval=0, title="Trailing Stop Trigger: 1%=.01 ", group="Sell Settings")

/////////////////////////////////////////////////
//               Indicators                    //
/////////////////////////////////////////////////
ema1Len = input.int(14, minval=1, title=" ema 1 Length", group="Trend Line Settings")
ema1Src = input(close, title="ema 1 Source", group="Trend Line Settings")
ema1 = ta.ema(ema1Src, ema1Len)
plot(ema1, title="EMA", color=color.blue)

ema2Len = input.int(22, minval=1, title=" ema 2 Length", group="Trend Line Settings")
ema2Src = input(close, title="ema 2 Source", group="Trend Line Settings")
ema2 = ta.ema(ema2Src, ema2Len)
plot(ema2, title="EMA", color=color.orange)

ema3Len = input.int(200, minval=1, title=" ema 3 Length", group="Trend Line Settings")
ema3Src = input(close, title="ema 2 Source", group="Trend Line Settings")
ema3 = ta.ema(ema3Src, ema3Len)
plot(ema3, title="EMA", color=color.gray)


/////////////////////////////
////   Buy Conditions    ////
/////////////////////////////

alertBuy = ta.crossover(ema1,ema2) and close>ema3

////////////////////////////////////////////////////////////////////
////   Filter redundant Buy Signals if Sell has not happened    ////
////////////////////////////////////////////////////////////////////
var lastsignal = 0
showAlertBuy   = 0
if(alertBuy and lastsignal != 1)
    showAlertBuy           := 1
    lastsignal             := 1
buyAlert= showAlertBuy     > 0

var buyActive = 0
if  buyAlert
    buyActive :=1

//////////////////////////////////////////////////////////////////
////          Track Conditions at buy Signal                  ////
//////////////////////////////////////////////////////////////////

alertBuyValue = ta.valuewhen(buyAlert, close,0)
alertSellValueLow = alertBuyValue - (alertBuyValue*sellLow)

////////////////////////////////////////////////////////////
/////            Trailing Stop                         /////
////////////////////////////////////////////////////////////
var TSLActive       = 0         //Check to see if TSL has been activated
var TSLTriggerValue = 0.0 //Initial and climbing value of TSL
var TSLStop         = 0.0       //Sell Trigger
var TSLRunning      = 0       //Continuously check each bar to raise TSL or not

//  Check if a Buy has been triggered and set initial value for TSL //
if buyAlert
    TSLTriggerValue := alertBuyValue+(alertBuyValue*trailStopArm)
    TSLActive  := 0
    TSLRunning := 1
    TSLStop := TSLTriggerValue - (TSLTriggerValue*trailStopPct)


//  Check that Buy has triggered and if Close has reached initial TSL//
//  Keeps from setting Sell Signal before TSL has been armed w/TSLActive//
beginTrail=TSLRunning==1 and TSLActive==0 and close>alertBuyValue+(alertBuyValue*trailStopArm) and ta.crossover(close,TSLTriggerValue)
if beginTrail
    TSLTriggerValue :=close
    TSLActive :=1
    TSLStop :=TSLTriggerValue - (TSLTriggerValue*trailStopPct)

//  Continuously check if TSL needs to increase and set new value //
runTrail= TSLActive==1 and (ta.crossover(close,TSLTriggerValue) or close>=TSLTriggerValue)
if runTrail
    TSLTriggerValue :=close
    TSLStop :=TSLTriggerValue - (TSLTriggerValue*trailStopPct)

//  Verify that TSL is active and trigger when close cross below TSL Stop//
TSL=TSLActive==1 and (ta.crossunder(close,TSLStop) or (close[1]>TSLStop and close<TSLStop))

// Plot point of inital arming of TSL//
TSLTrigger=TSLActive==1 and TSLActive[1]==0
plotshape(TSLTrigger, title='TSL Armed', location=location.abovebar, color=color.new(color.blue, 0), size=size.small, style=shape.cross, text='TSL Armed')


////////////////////////////////////////////////////////////
/////             Sell Conditions                    ///////
////////////////////////////////////////////////////////////
Sell1 = TSL
Sell2 = ta.crossunder(close,alertSellValueLow)

alertSell = Sell1 or Sell2
////////////////////////////////////////////////////////////

////////////////////////////////////////////////////////////
////        Remove Redundant Signals                    ////
////////////////////////////////////////////////////////////
showAlertSell = 0
if(alertSell and lastsignal != -1)
    showAlertSell           := 1
    lastsignal              := -1
sellAlert= showAlertSell    > 0

if sellAlert
    TSLActive  :=0
    TSLRunning :=0
    buyActive  :=0
/////////////////////////////////////////
//  Plot Buy and Sell Shapes on Chart  //
/////////////////////////////////////////
plotshape(buyAlert,  title='Buy' , location=location.belowbar , color=color.new(color.green, 0), size=size.small , style=shape.triangleup   , text='Buy')
plotshape(sellAlert, title='Sell', location=location.abovebar , color=color.new(color.red, 0)  , size=size.small , style=shape.triangledown , text='Sell')

/////////////////////////////////////////////////////////////////////////////////////////////
//                        Remove // on alertCondition to enable Alerts                     //
/////////////////////////////////////////////////////////////////////////////////////////////
//Alerts
alertcondition(title='Buy Alert', condition=buyAlert, message='Buy Conditions are Met')
alertcondition(title='Sell Alert', condition=sellAlert, message='Sell Conditions are Met')
/////////////////////////////////////////////////////////////////////////////////////////////


////////////////////////////////////////////////////////////
////  Comment out this section if setup as Indicator    ////
////////////////////////////////////////////////////////////
//longCondition = buyAlert
//if (longCondition)
//    strategy.entry("Buy", strategy.long)
//    alert(message='Buy', freq=alert.freq_once_per_bar_close)

//shortCondition = sellAlert
//if (shortCondition)
//    strategy.close_all(sellAlert,"Sell")
//    alert(message='Sell', freq=alert.freq_once_per_bar_close)
/////////////////////////////////////////////////////////////


if buyAlert
    strategy.entry("Enter Long", strategy.long)
else if sellAlert
    strategy.entry("Enter Short", strategy.short)
- Handelsstrategie auf der Grundlage von aufeinanderfolgenden MACD-Gold- und Todeskreuzungen
- Erweiterte Bollinger Bands RSI-Handelsstrategie
- Strategie für die dreifache EMA-Überschreitung
- Exponential Moving Average Crossover Leverage-Strategie
- GM-8 & ADX Doppel gleitende Durchschnittsstrategie
- Erweiterte EMA-Crossover-Strategie mit RSI/MACD/ATR
- Z-Score-Trend nach Strategie
- Langzeit-Eintritt auf EMA-Kreuzung mit Risikomanagementstrategie
- VWAP-Handelsstrategie
- WaveTrend Kreuz LazyBear Strategie
- AlphaTradingBot Handelsstrategie
- SSL-Hybrid
- Lustre-Ausgang
- RISOTTO
- EMA-Intraday-Strategie in der Cloud
- Supertrend des Drehpunkts
- Supertrend+4bewegt
- Momentum-basierte ZigZag
- VuManChu-Chiffer B + Divergenzstrategie
- Konzept Dual SuperTrend
- Super Scalper
- Trendylich
- Sma-BTC-Killer
- ML-Warnungsvorlage
- Fibonacci-Progression mit Pausen
- RSI MTF Ob+Os
- Fukuiz Octa-EMA + Ichimoku
- MTF Ob+Os der KMU
- Ein intelligenter MACD
- Strategie des OCC R5.1
- Willkommen auf dem Bärenmarkt.