Multi-Faktor-Strategie-Kombination

Hier ist mein detaillierter Strategie-Analyse-Artikel, der auf dem Code basiert, den Sie mir zur Verfügung gestellt haben:
Überblick
Die Strategie besteht aus einer Kombination von Faktoren, die darauf abzielen, die Vorteile der verschiedenen Faktoren zu nutzen, um eine umfassende Handelsstrategie zu erstellen. Hauptsächlich werden die folgenden Faktoren kombiniert:
- Stoch.RSI - der Zufallsindex für glatte gleitende Durchschnittswerte
- RSI - Relativ starke und schwache Indizes
- Doppelstrategie - Doppelstrategie für Zufallsindikatoren und RSI
- CM Williams Vix Fix - Williams Volatilitätsreparatur auf der Suche nach einem Marktboden
- DMI - Trendindikator
Durch die Kombination mehrerer Faktoren können die Vorteile der einzelnen Faktoren genutzt werden, um mehr Handelsmöglichkeiten zu erhalten und das Risiko einer Abhängigkeit von einem einzigen Faktor zu verringern.
Strategieprinzip
Die Strategie basiert auf folgenden technischen Indikatoren:
-
Stoch.RSIDer Random RSI-Indikator kombiniert die Vorzüge des RSI und des Random-Indikators. Er verwendet den RSI-Wert als Eingabewert für den Random-Indikator, um zu beurteilen, ob ein Markt überkauft oder überverkauft ist. Wenn die %K-Linie die %D-Linie unterhalb der Überkaufzone durchquert, macht man einen Plus; wenn die %K-Linie die %D-Linie über der Überverkaufzone durchquert, macht man einen Minus.
-
RSI- Relativ starker Index, der die Überkauf-Überverkauf-Zustand des Marktes beurteilt. Der RSI ist überkaufend, wenn er größer als 70 ist, und überverkaufend, wenn er kleiner als 30 ist. Der RSI bewegt sich zwischen 30 und 70, was bedeutet, dass sich der Markt in einer horizontalen Korrektur befindet.
-
Double Strategy- Eine Doppelstrategie in Kombination mit einem Zufallsindikator und dem RSI. Wenn der Zufallsindikator%K die%D-Linie unterhalb der Überverkaufszone durchbricht und der RSI unterhalb der Überverkaufszone durchbricht, macht man einen Plus; wenn der Zufallsindikator%K die%D-Linie über die Überkaufszone durchbricht und der RSI über die Überkaufszone durchbricht, macht man einen Minus.
-
CM Williams Vix Fix- Der Williams Volatilitäts-Reparatur-Indikator, der durch Berechnung eines prozentualen Bereichs der Preisschwankungen in der jüngsten Zeit beurteilt, ob sich ein Markt an einem Wendepunkt befindet. Überschreiten der Schwelle ist ein Wendezeichen.
-
DMI- Trendindikatoren, die die Richtung eines Markttrends bestimmen, indem sie die Differenz zwischen + DI und - DI berechnen. Der ADX-Index kann verwendet werden, um die Stärke eines Trends zu bestimmen.
Durch die Kombination der Vorteile der einzelnen Indikatoren und die Beurteilung von Markttrends und Kauf- und Verkaufspunkten aus verschiedenen Blickwinkeln kann die Stabilität und Erfolgsrate der Strategie verbessert werden.
Strategische Vorteile
- Es ist eine Kombination aus mehreren Faktoren, die sich gegenseitig ergänzen, umfassender.
- Es gibt mehr Möglichkeiten, mit verschiedenen Arten von Handelssignalen wie Trends und Umkehrungen zu handeln.
- Gleichzeitig werden Überkauf- und Überverkaufszonen ermittelt, um die Entstehung und Umkehrung von Extremsituationen rechtzeitig zu erkennen.
- Das Ziel ist es, die Verbraucher in der Lage zu machen, sich mit dem Markt zu befassen.
- Der Trend-Indikator wird verwendet, um die Stärke des Trends zu bestimmen, um einen Gegenwert zu vermeiden.
Risikoanalyse
- Es ist eine Kombination aus mehreren Faktoren, die die robuste Gesamtheit der Strategie bestätigen müssen.
- Es gibt Probleme mit der Gleichwertigkeit einiger Indikatoren, die eine weitere Optimierung der Kombination ermöglichen.
- Wenn mehrere Luftsignale gleichzeitig auftreten, ist es notwendig, eine klare Strategie für die Auswahl der Richtung zu entwickeln.
- Die Parameter-Einstellungen erfordern eine strenge Rückmessoptimierung und sind nicht geeignet, die Parameter beliebig zu ändern.
- Die langfristige Wirksamkeit kann schwach sein, und es ist notwendig, den Verlust rechtzeitig zu stoppen.
Optimierungsrichtung
- weitere Filterung der in der Portfolio enthaltenen Indikatoren, um die einzigartigen Faktoren zu erhalten;
- Optimierung der Parameter-Einstellungen für die einzelnen Indikatoren, um sie besser für den Zielmarkt geeignet zu machen;
- Einführung klarer Ein- und Ausstiegsprinzipien;
- Risikokontrolle in Kombination mit Stop-Loss- und Profit-Return-Methoden;
- Die Auswirkungen der unterschiedlichen Laufzeiten auf die Performance werden getestet.
Zusammenfassen
Die Strategie nutzt die Vorzüge mehrerer technischer Indikatoren, um Handelssignale durch Faktoren wie Stoch.RSI, RSI, Double Strategy, CM Williams Vix Fix und DMI zu bilden. Sie bietet eine umfassendere und stabilere Urteilsbasis und macht die Optimierung der Strategieparameter komplexer. Die Stabilität und Leistung der Strategie können durch weitere Optimierung der Parameter, die Auswahl von einzigartigen Faktoren und die Einrichtung eines klaren Einstiegs- und Ausstiegsprinzips verbessert werden.
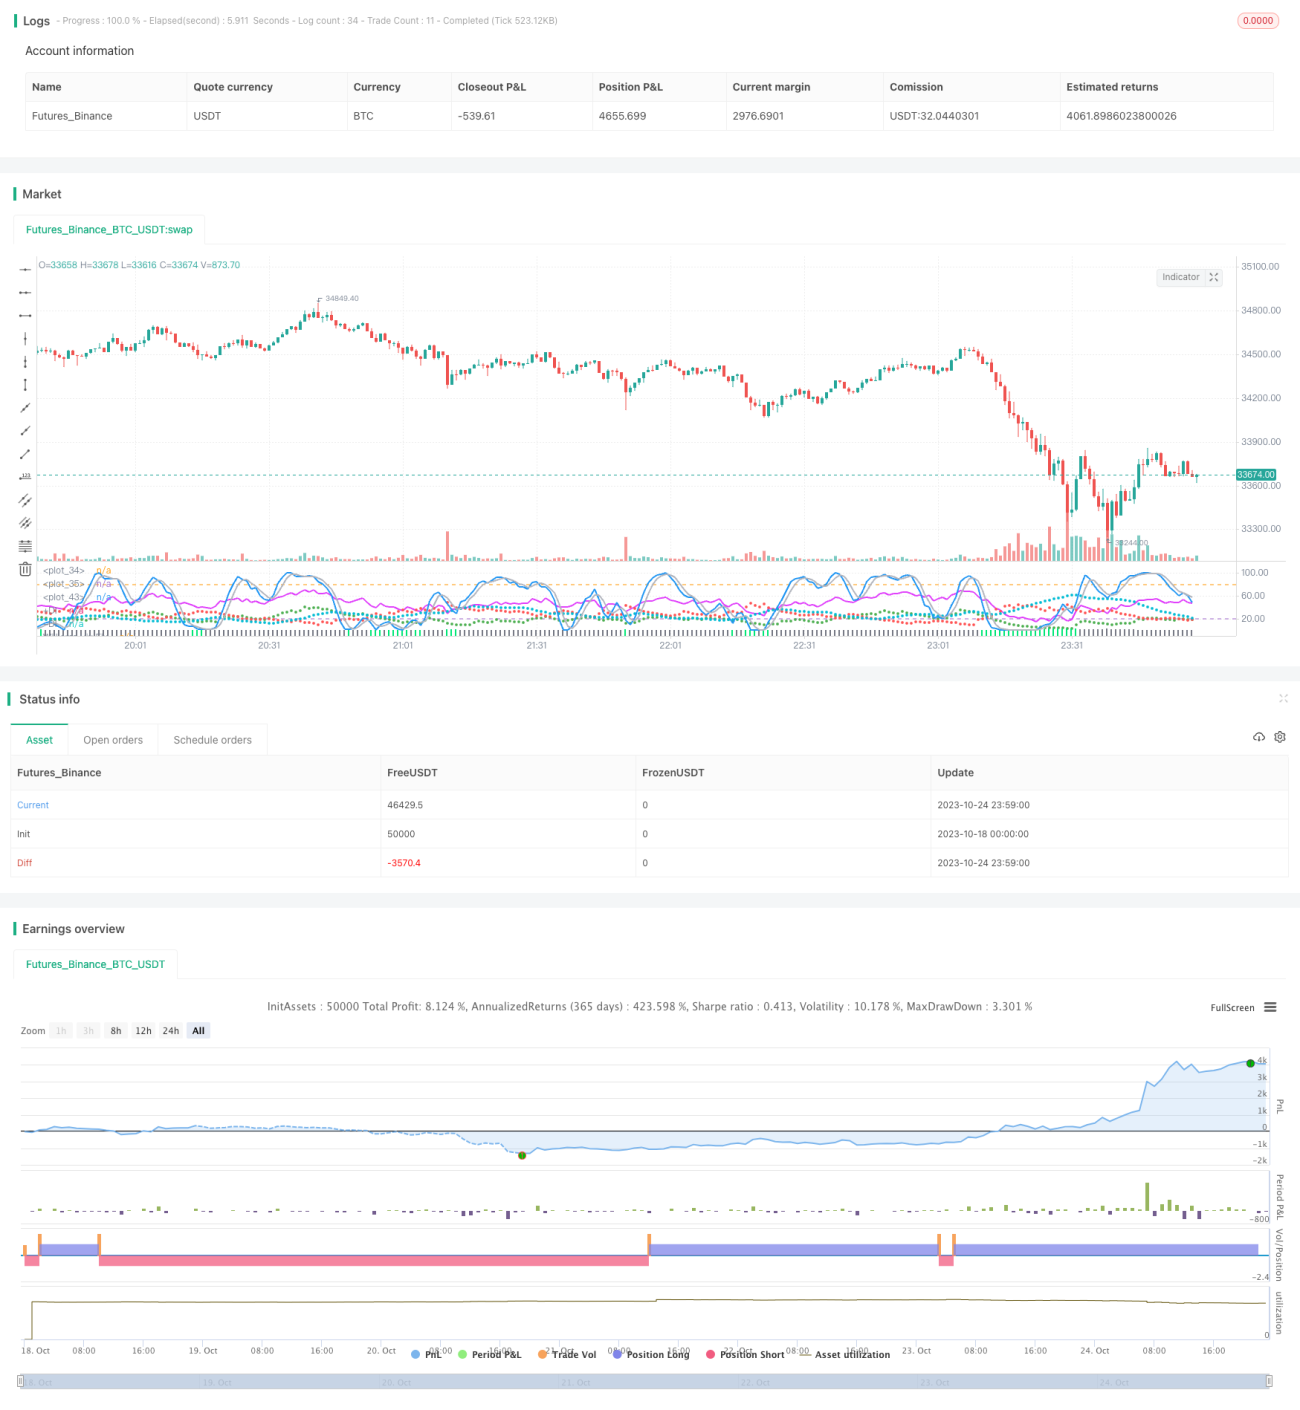
/*backtest
start: 2023-10-18 00:00:00
end: 2023-10-25 00:00:00
period: 1m
basePeriod: 1m
exchanges: [{"eid":"Futures_Binance","currency":"BTC_USDT"}]
*/


     //////////////////////////////////////////////////////////////////////
    ////  STOCHASTIC_RSI+RSI+DOUBLE_STRATEGY+CM_WILLIAMS_VIX_FIX+DMI  ////
//////////////////////////////////////////////////////////////////////- 1