
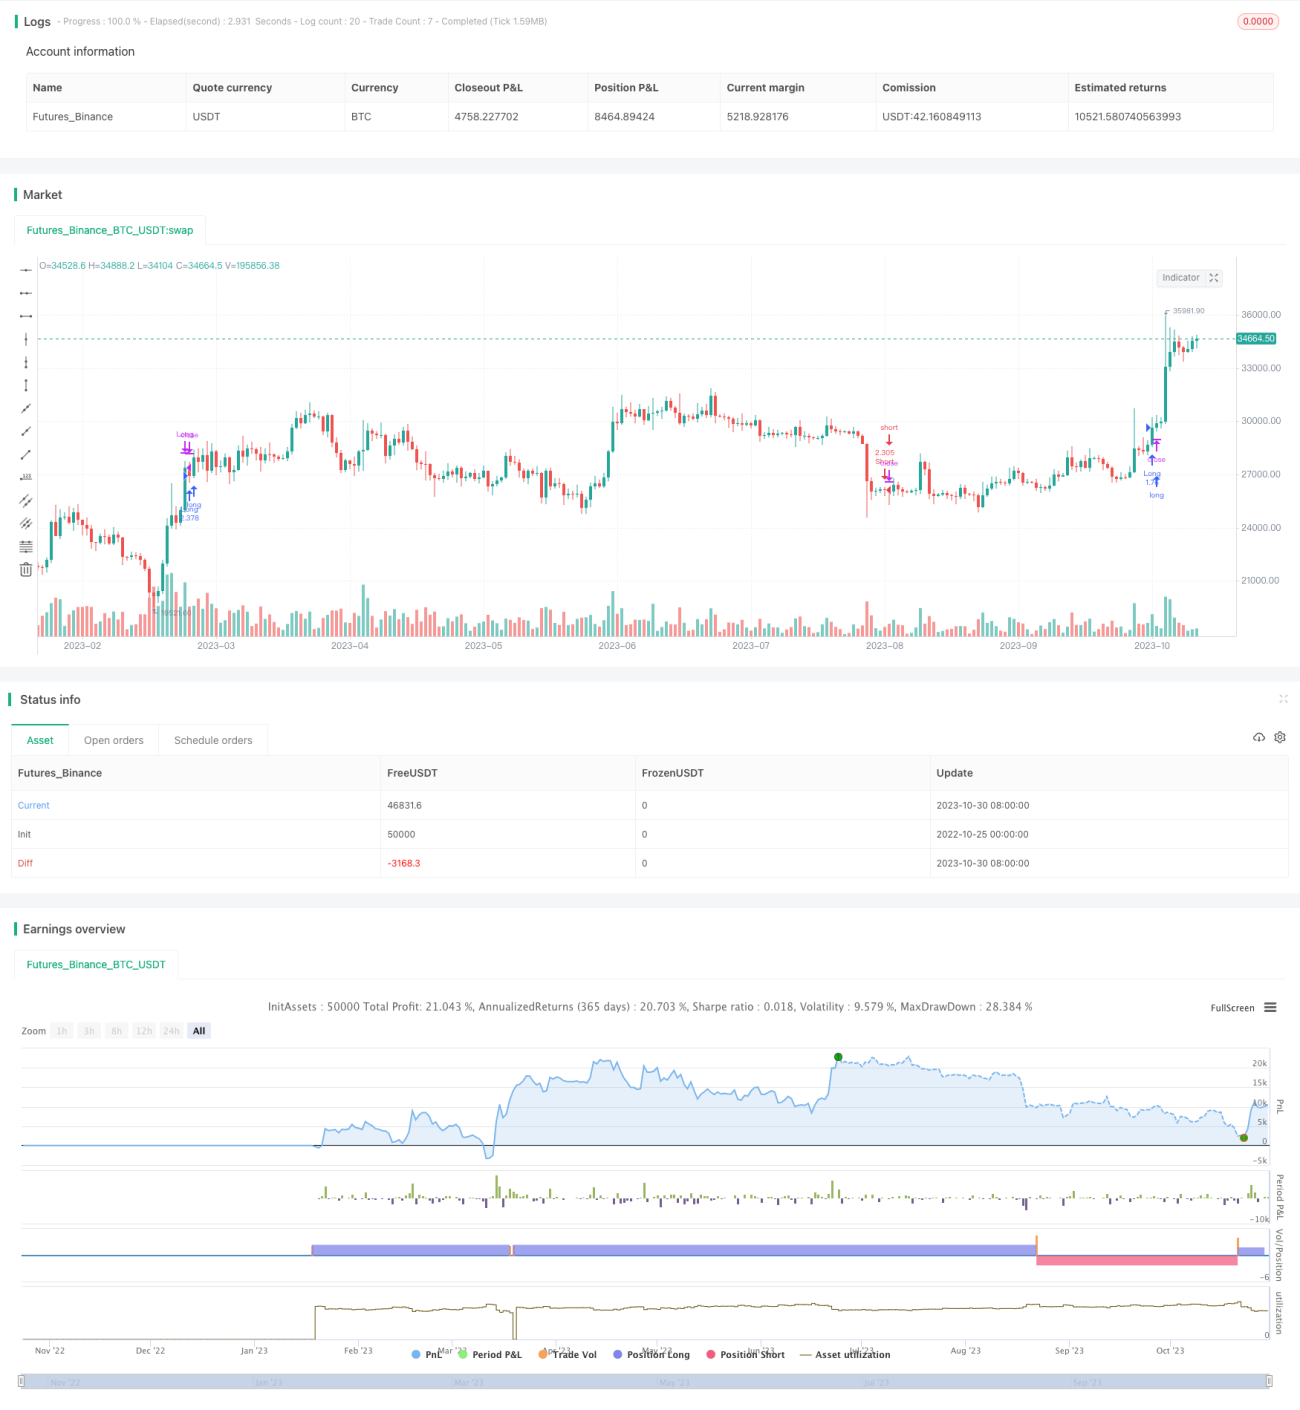
Die Strategie basiert auf dem Wall Street Catch-the-Mouse-Sphere-Index und ermöglicht eine automatische Trading-Strategie, bei der die bullish-bullish-Operationen für die Ziel-Kryptowährungen durchgeführt werden. Die Strategie ermöglicht die Verfolgung von Transaktionen für mehrere Kryptowährungen, die auf die Parameter des Support-Index basieren, der für verschiedene Kryptowährungen eingestellt ist.
Berechnen Sie die mittlere Linie des Wall Street Rattenfänger-Sphären-Index für die Basis-Kryptowährung mit einer mittleren Linie mit einer Länge von 200 Zyklen.
Beurteilen Sie den fallenden Zustand der Durchschnittslinie: Wenn die Durchschnittslinie steigt, wird eine Beobachtungsoperation durchgeführt. Wenn die Durchschnittslinie sinkt, wird eine Beobachtungsoperation durchgeführt.
Strategie, die automatische Eröffnung und Befreiung von Positionen basierend auf dem Kurs-Wachstums-Zustand der Durchschnittslinie und der aktuellen Position ermöglicht:
Wenn die Durchschnittslinie hoch ist und es keine Position gibt, wird der Strategie-Marktpreis automatisch erhöht.
Strategie-Marktpreise, die automatisch eine Short-Position einnehmen, wenn der Durchschnittswert sinkt und keine Position vorhanden ist;
Der Strategie-Marktpreis gleicht sich automatisch aus, wenn die Gewinne aus den Mehrarten die eingestellte Stop-Loss-Rate erreichen.
Der Strategie-Marktpreis gleicht automatisch den Short-Option aus, wenn die Gewinne aus den Short-Positions die eingestellte Stop-Loss-Ratio erreichen.
Der Strategie-Marktpreis gleicht sich automatisch aus, wenn die Verluste aus einer Überschreitung die eingestellte Stop-Loss-Ratio erreichen.
Wenn der Verlust der Short-Position die eingestellte Stop-Loss-Ratio erreicht, wird der Strategie-Marktpreis automatisch auf den Short-Position ausgeglichen.
Die Strategie basiert auf der Benchmark-Kryptowährung und aktualisiert den Stop-Loss-Preis in Echtzeit.
Die Strategie ist sehr anpassungsfähig und kann verschiedene Parameter für verschiedene Kryptowährungen einstellen, um Transaktionen für mehrere Kryptowährungen zu verfolgen.
Der Wall Street Rattenring-Indikator wird verwendet, um Markttrends zu beurteilen und falsche Geschäfte zu vermeiden, die durch Geräusche verursacht werden. Der Indikator hat eine gewisse Verzögerung beim Auf- und Abbruch und kann den Verlust durch falsche Durchbrüche verringern.
Die Strategie beinhaltet einen Stop-Loss-Mechanismus, der den Trend erfasst und den Rückgang verhindert und den Einzelschaden kontrolliert.
Die Strategie ist vollständig automatisiert, ohne menschliche Intervention, und kann 24 Stunden lang betrieben werden.
Es besteht die Möglichkeit, dass sich die Preise bestimmter Kryptowährungen von den Basis-Kryptowährungen abheben, was zu einem Risiko führt, dass die Strategie nicht normal handeln kann. Es kann optimiert werden, um die relevanten Faktoren für die Berechnung mehrerer Basis-Kryptowährungen zu verwenden und die am stärksten relevanten Basis-Kryptowährung auszuwählen.
Es besteht die Gefahr, dass die Stop-Loss-Rate aufgrund ungewöhnlicher Marktschwankungen überschritten wird. Die Stop-Loss-Rate kann entsprechend angepasst oder der Stop-Loss-Tracking hinzugefügt werden.
Es besteht die Gefahr, dass die Stop-Ratio-Einstellungen zu klein sind, was dazu führt, dass nicht genügend Trendgewinne erfasst werden können. Trend-Tracking oder Dynamische Stopps können hinzugefügt werden.
Es besteht die Gefahr, dass ein falscher Durchbruch zu einem Stillstand führt. Die Kennzahlenparameter, Identifikations-Einstellungen oder die Aufnahme eines Wiedereintrittsmechanismus können entsprechend angepasst werden.
Die Auswahl von mehreren Benchmark-Kryptowährungen mit Hilfe von Relevanzanalyse, die Kombination der berechneten Kennzahlen und die Verringerung des Risikos einer einzigen Benchmarkwährung.
Ein zusätzlicher Trend-Tracking-Mechanismus, der die Stop-Loss-Regelung an die Dynamik der Volatilität anpasst.
Erhöhen Sie den Stop-Loss, um zu verhindern, dass der Stop-Loss von Extremen durchbrochen wird.
Die Einführung eines Wiedereintrittsmechanismus, um Verluste zu vermeiden, die nach dem Stillstand verpasst werden.
Optimierung der Kennzahlen, Identifikations-Einstellungen und Verbesserung der Kennzahlenwirkung.
Optimierung der Parameter für verschiedene Kryptowährungen, um die Anpassungsfähigkeit der Strategie zu verbessern.
Optimierung der Positionsverwaltung und dynamische Anpassung der Positionen an die Größe des Kapitals.
Die Strategie als Ganzes ist eine typische Trend-Tracking-Strategie. Die zentrale Idee ist, die Trendrichtung der Basis-Kryptowährung anhand der Wall Street Rattenfänger-Sphäre-Indikatoren zu beurteilen, um die Handelsrichtung der Ziel-Kryptowährung zu bestimmen. Die Strategie hat einige Vorteile, aber es gibt auch einige Risiken, die zu beachten sind.
/*backtest
start: 2022-10-25 00:00:00
end: 2023-10-31 00:00:00
period: 1d
basePeriod: 1h
exchanges: [{"eid":"Futures_Binance","currency":"BTC_USDT"}]
*/
// This source code is subject to the terms of the Mozilla Public License 2.0 at https://mozilla.org/MPL/2.0/
// © levieux
//@version=5
strategy(title='Correlation Strategy', shorttitle='Correlation Strategy', initial_capital=1000, overlay=true, default_qty_type=strategy.percent_of_equity, default_qty_value=100, commission_type=strategy.commission.percent, commission_value=0.1)
supportLength = input.int(200, minval=1, title='Support Length')
supportSymbol = input('BTC_USDT:swap', title='Correlated Symbol')
supportSource = input(hlc3, title='Price Source')
takeprofitLong = input.float(0.2, 'Take Profit Long', step=0.01)
takeprofitShort = input.float(0.15, 'Take Profit Short', step=0.01)
stoplossLong = input.float(0.1, 'Stop Loss Long', step=0.01)
stoplossShort = input.float(0.04, 'Stop Loss Short', step=0.01)
start = input(defval = timestamp("01 Jan 2016 00:00 +0000"), title = "Start Time")
end = input(defval = timestamp("31 Dec 2050 23:59 +0000"), title = "End Time")
supportTicker = request.security(supportSymbol, timeframe.period, supportSource, lookahead=barmerge.lookahead_off) //input(close, title="Source")
supportLine = ta.wma(supportTicker, supportLength)
window() => true
if not window()
strategy.cancel_all()
supportLongPrice = close
supportShortPrice = close
if strategy.position_size > 0
supportLongPrice := supportLongPrice[1]
if strategy.position_size < 0
supportShortPrice := supportShortPrice[1]
longCondition = ta.rising(supportLine, 5) and window() and strategy.position_size <= 0
shortCondition = ta.falling(supportLine, 5) and window() and window() and strategy.position_size > 0
takeprofitLongCondition = takeprofitLong > 0 and window() and strategy.position_size > 0 and supportTicker > supportLongPrice * (1 + takeprofitLong)
stoplossLongCondition = stoplossLong > 0 and window() and strategy.position_size > 0 and supportTicker < supportLongPrice * (1 - stoplossLong)
takeprofitShortCondition = takeprofitShort > 0 and window() and strategy.position_size < 0 and supportTicker > supportShortPrice * (1 + takeprofitShort)
stoplossShortCondition = stoplossShort > 0 and window() and strategy.position_size < 0 and supportTicker < supportShortPrice * (1 - stoplossShort)
if longCondition
strategy.entry('Long', strategy.long)
supportLongPrice := supportTicker
if shortCondition
strategy.entry('Short', strategy.short)
supportShortPrice := supportTicker
if takeprofitLongCondition
strategy.close('Long')
if stoplossLongCondition
strategy.close('Long')
if takeprofitShortCondition
strategy.close('Short')
if stoplossShortCondition
strategy.close('Short')
///////////////////
// MONTHLY TABLE //
new_month = month(time) != month(time[1])
new_year = year(time) != year(time[1])
eq = strategy.equity
bar_pnl = eq / eq[1] - 1
bar_bh = (close-close[1])/close[1]
cur_month_pnl = 0.0
cur_year_pnl = 0.0
cur_month_bh = 0.0
cur_year_bh = 0.0
// Current Monthly P&L
cur_month_pnl := new_month ? 0.0 :
(1 + cur_month_pnl[1]) * (1 + bar_pnl) - 1
cur_month_bh := new_month ? 0.0 :
(1 + cur_month_bh[1]) * (1 + bar_bh) - 1
// Current Yearly P&L
cur_year_pnl := new_year ? 0.0 :
(1 + cur_year_pnl[1]) * (1 + bar_pnl) - 1
cur_year_bh := new_year ? 0.0 :
(1 + cur_year_bh[1]) * (1 + bar_bh) - 1
// Arrays to store Yearly and Monthly P&Ls
var month_pnl = array.new_float(0)
var month_time = array.new_int(0)
var month_bh = array.new_float(0)
var year_pnl = array.new_float(0)
var year_time = array.new_int(0)
var year_bh = array.new_float(0)
end_time = false
end_time:= time_close + (time_close - time_close[1]) > timenow or barstate.islastconfirmedhistory
if (not na(cur_month_pnl[1]) and (new_month or end_time))
if (end_time[1])
array.pop(month_pnl)
array.pop(month_time)
array.push(month_pnl , cur_month_pnl[1])
array.push(month_time, time[1])
array.push(month_bh , cur_month_bh[1])
if (not na(cur_year_pnl[1]) and (new_year or end_time))
if (end_time[1])
array.pop(year_pnl)
array.pop(year_time)
array.push(year_pnl , cur_year_pnl[1])
array.push(year_time, time[1])
array.push(year_bh , cur_year_bh[1])
// Monthly P&L Table
var monthly_table = table(na)
getCellColor(pnl, bh) =>
if pnl > 0
if bh < 0 or pnl > 2 * bh
color.new(color.green, transp = 20)
else if pnl > bh
color.new(color.green, transp = 50)
else
color.new(color.green, transp = 80)
else
if bh > 0 or pnl < 2 * bh
color.new(color.red, transp = 20)
else if pnl < bh
color.new(color.red, transp = 50)
else
color.new(color.red, transp = 80)
if end_time
monthly_table := table.new(position.bottom_right, columns = 14, rows = array.size(year_pnl) + 1, border_width = 1)
table.cell(monthly_table, 0, 0, "", bgcolor = #cccccc)
table.cell(monthly_table, 1, 0, "Jan", bgcolor = #cccccc)
table.cell(monthly_table, 2, 0, "Feb", bgcolor = #cccccc)
table.cell(monthly_table, 3, 0, "Mar", bgcolor = #cccccc)
table.cell(monthly_table, 4, 0, "Apr", bgcolor = #cccccc)
table.cell(monthly_table, 5, 0, "May", bgcolor = #cccccc)
table.cell(monthly_table, 6, 0, "Jun", bgcolor = #cccccc)
table.cell(monthly_table, 7, 0, "Jul", bgcolor = #cccccc)
table.cell(monthly_table, 8, 0, "Aug", bgcolor = #cccccc)
table.cell(monthly_table, 9, 0, "Sep", bgcolor = #cccccc)
table.cell(monthly_table, 10, 0, "Oct", bgcolor = #cccccc)
table.cell(monthly_table, 11, 0, "Nov", bgcolor = #cccccc)
table.cell(monthly_table, 12, 0, "Dec", bgcolor = #cccccc)
table.cell(monthly_table, 13, 0, "Year", bgcolor = #999999)
for yi = 0 to array.size(year_pnl) - 1
table.cell(monthly_table, 0, yi + 1, str.tostring(year(array.get(year_time, yi))), bgcolor = #cccccc)
y_color = getCellColor(array.get(year_pnl, yi), array.get(year_bh, yi))
table.cell(monthly_table, 13, yi + 1, str.tostring(math.round(array.get(year_pnl, yi) * 100)) + " (" + str.tostring(math.round(array.get(year_bh, yi) * 100)) + ")", bgcolor = y_color)
for mi = 0 to array.size(month_time) - 1
m_row = year(array.get(month_time, mi)) - year(array.get(year_time, 0)) + 1
m_col = month(array.get(month_time, mi))
m_color = getCellColor(array.get(month_pnl, mi), array.get(month_bh, mi))
table.cell(monthly_table, m_col, m_row, str.tostring(math.round(array.get(month_pnl, mi) * 100)) + " (" + str.tostring(math.round(array.get(month_bh, mi) * 100)) +")", bgcolor = m_color)