Multifaktorielle quantitative Handelsstrategie, die dynamischen RSI und CCI kombiniert

Überblick
Diese Strategie ermöglicht eine quantitative Handelsstrategie, die durch die Kombination von dynamischen RSI-Indikatoren, CCI-Indikatoren und Multiple-MA-Mittellinien durch mehrere Faktoren angetrieben wird. Die Strategie berücksichtigt mehrere Dimensionen wie Trend, Überkauf und Überverkauf, um Urteile zu fällen und Handelssignale zu erzeugen.
Strategieprinzip
Technische Kennzahlen
- MA-Durchschnittslinie: Berechnung des Durchschnitts der Schlusskosten innerhalb eines bestimmten Zeitraums, um die Preisentwicklung zu beurteilen
- Relative Schwäche des RSI: Überkauf- und Überverkaufszonen
- Der CCI-Wechselkurs: Überkauf und Überverkauf
- Stoch KDJ-Indikator: Beurteilung von Abweichungen von Zufallsindikatoren vom Haupttrend
Handelssignale
Kaufsignale: MA12 mit MA26, CCI unter 100 (Überverkauf), Stoch KDJ unter 80 (Überverkauf)
Verkaufssignale: Dynamische Verluste unter dem RSI, Stoch KDJ über 80 (Überkauf)
Strategische Vorteile
- Multi-Faktor-Antriebe, umfassendes Urteilsvermögen, Verringerung von Falschsignalen
- Dynamische Abwertungen, die in Echtzeit überkauft und überverkauft werden können
- Trends, Zufälligkeit und mehrere Mainstream-Technik-Indikatoren kombiniert
- Flexibilität bei der Einstellung von mehreren Parametern
Strategisches Risiko
- Die Kombination von mehreren Faktoren ist zu kompliziert und die Optimierung der Parameter ist schwierig.
- Strategie-Performance ist stark mit Parameter-Auswahl verbunden
- Parameter-Optimierung muss strikt nach dem Quantifizierungsprozess erfolgen
- Es besteht ein höheres Risiko für Kurvenübereinstimmung
Strategieoptimierung
- Weitere Datensätze, um die Robustheit von Strategien zu testen
- Multiple-Parameter-Kombinationstests zur Suche nach den optimalen Parametern
- Erhöhung der Stop-Loss-Mechanismen zur Verringerung der maximalen Rücknahme
- Erhöhung der Positionskontrolle und Vermeidung von Rückschlägen
- Tests zur Eignung verschiedener Varianten
Zusammenfassen
Die Strategie verwendet mehrere technische Indikatoren und mehrere Faktoren, um die besten Parameter durch Parameteroptimierung und strenge statistische Verifizierung zu finden, um eine bessere Strategiewirkung zu erzielen. Die Strategie kann jedoch auf andere Sorten und Zeiträume ausgedehnt werden, um Optimierungstests durchzuführen.
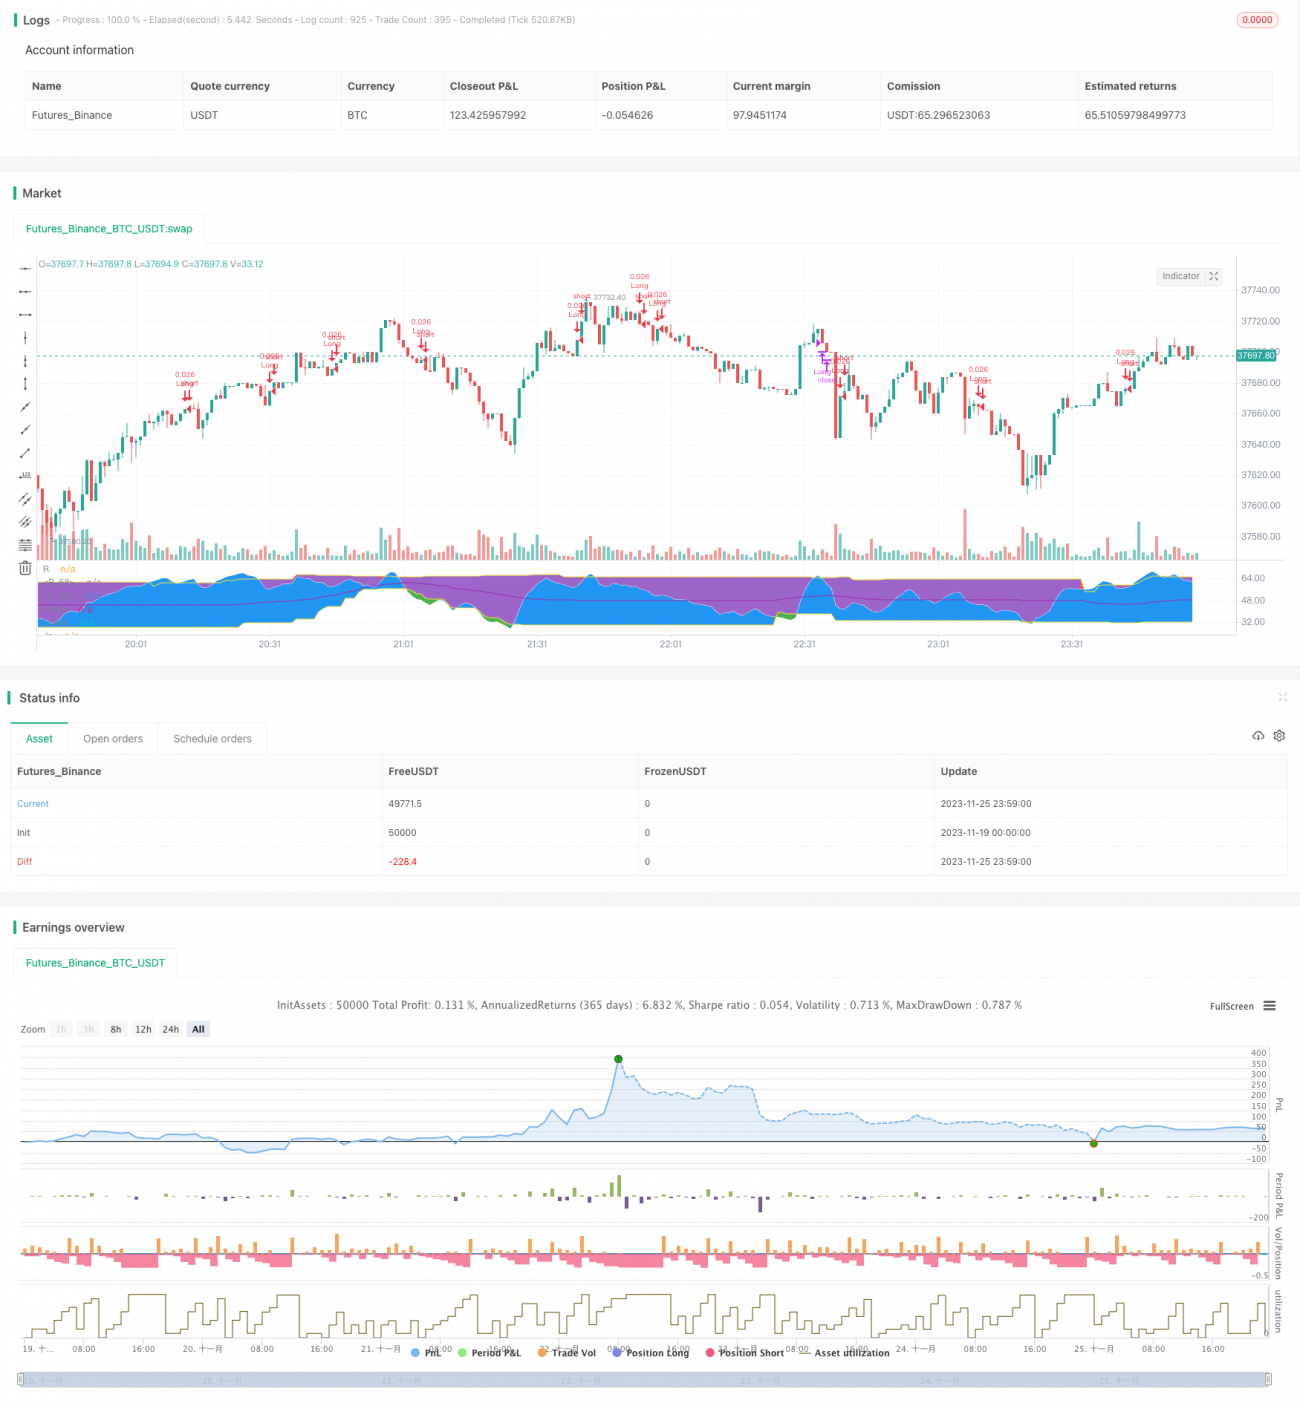
/*backtest
start: 2023-11-19 00:00:00
end: 2023-11-26 00:00:00
period: 1m
basePeriod: 1m
exchanges: [{"eid":"Futures_Binance","currency":"BTC_USDT"}]
*/

//@version=4
strategy(title="ATOM2.0", shorttitle="ATOM V2.0", overlay=false, default_qty_type=strategy.cash, currency=currency.USD, initial_capital=200, default_qty_type=strategy.cash, default_qty_value=100, pyramiding=10)

// Set Parameter MA12- 1