Dynamische Filter-Strategie für quantitatives Trading
Strategieübersicht
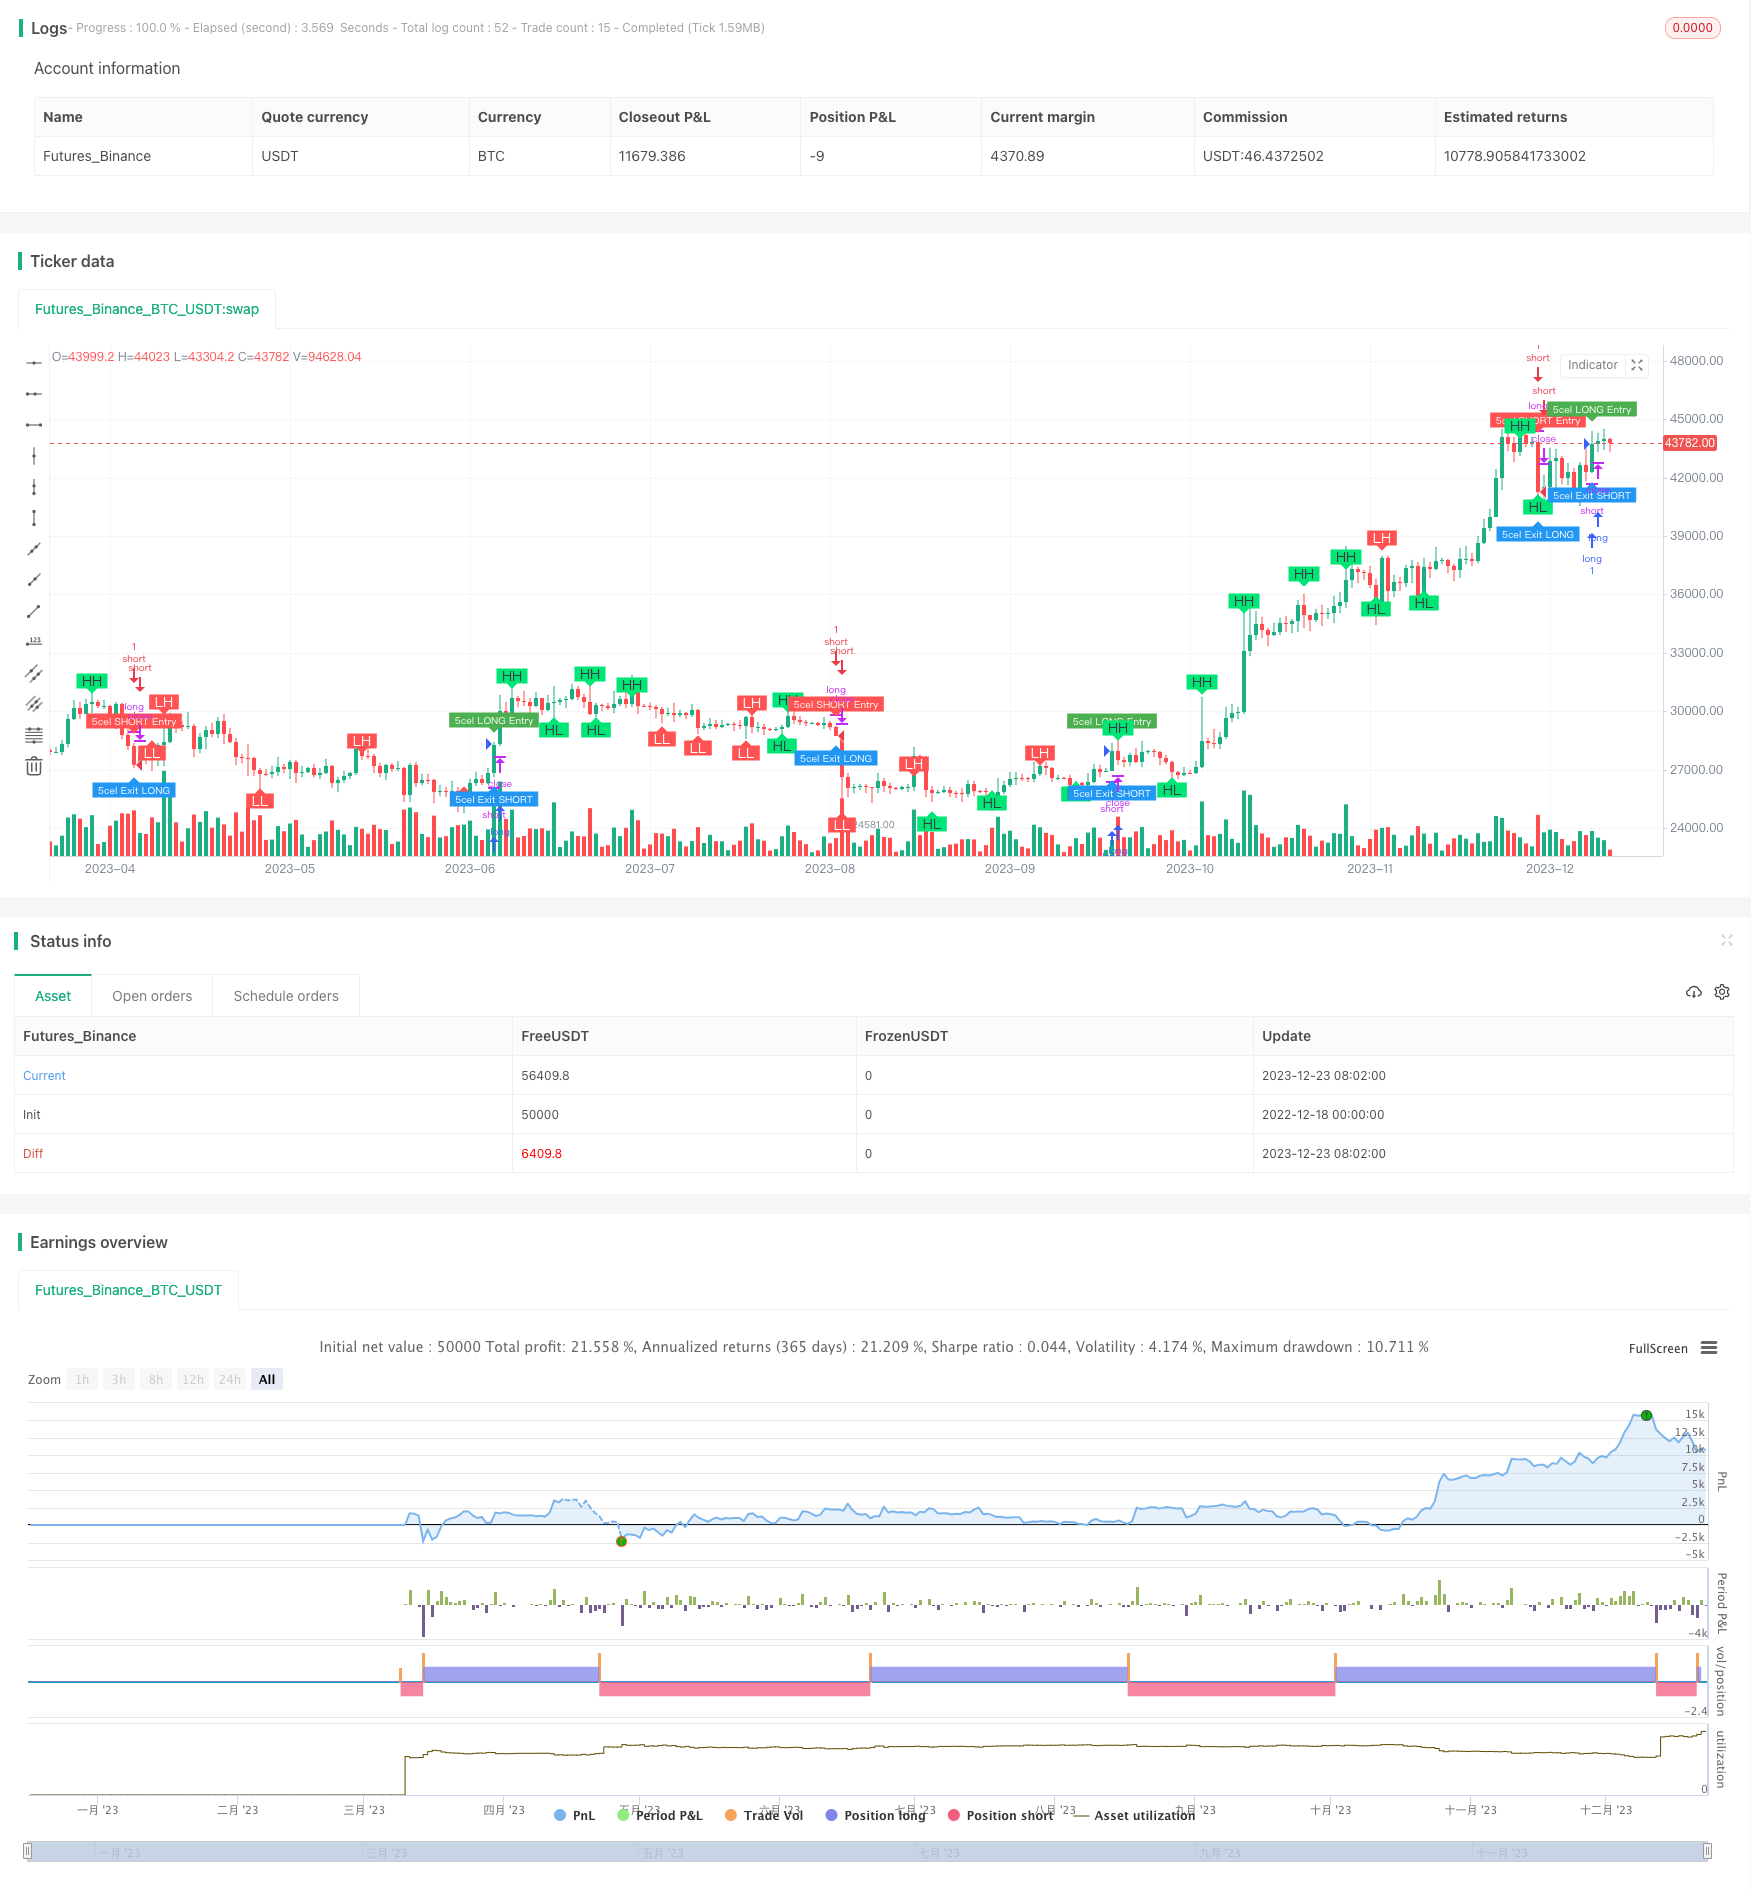
Die Strategie, die als Dynamic Filter Quant Trading Strategy bezeichnet wird, verwendet hauptsächlich Spannungsfilterindikatoren in Kombination mit mehreren technischen Indikatoren, um automatisierte Trendverfolgungstransaktionen für die Kryptowährung BTCUSDT zu realisieren. Die Strategie ist für hochfrequente quantitative Transaktionen geeignet, um Gewinne zu sichern und Rücknahmen zu reduzieren, indem sie den Stop-Loss-Stop dynamisch anpasst.
Strategieprinzip
Der Kern der Strategie ist der Range-Filter, der auf der Grundlage der statistischen Preisschwankungen eine mittlere Linie erzeugt. Wenn der Preis diese mittlere Linie überschreitet, wird ein Handelssignal erzeugt. Darüber hinaus wird die Strategie in Kombination mit dem RSI-Indikator zur Bestimmung von Überkauf und Überverkauf, der Mittellinie zur Bestimmung von Trends und dem MACD zur Bestimmung der Dynamik verwendet, um ein zuverlässigeres Handelssignal zu erzeugen.
Die mittlere Linie des Bereichsfilters wird anhand eines Index-Moving-Averages für den Bereich der Preisveränderung ermittelt. Die Richtung wird anhand der Stärke und Geschwindigkeit des Durchbruchs der mittleren Linie bestimmt. Ein starkes Durchbruchssignal wird erzeugt, wenn der Preis die mittlere Linie für mehrere K-Linien in Folge durchbricht.
Der RSI-Indikator beurteilt Überkauf-Überverkauf-Zustände zur Bestätigung von Filtersignalen. Wenn der Durchschnitt nach oben geht, wird er als Trend nach oben beurteilt, wenn er nach unten geht, wird er als Trend nach unten beurteilt. Der MACD-Indikator beurteilt, ob die Marktbewegung ausreichend ist, um einen Trend zu bilden.
Zusammenfassend kann man aus diesen Indikatoren einen eher zuverlässigen Trend-Breakout-Punkt als Zeitpunkt für eine Positionserrichtung erkennen.
Analyse der Stärken
Der größte Vorteil dieser Strategie ist, dass die Kombination von mehreren Indikatoren für die Entscheidungsfindung, anstatt auf eine einzelne technische Indikator, kann effektiv die Wahrscheinlichkeit von falschen Geschäften zu reduzieren, um sicherzustellen, dass die Handelssignale zuverlässiger. Darüber hinaus macht die dynamische Anpassung Parameter auch die Strategie an Veränderungen des Marktes anpassen können.
Ein weiterer Vorteil ist die Möglichkeit des Hochfrequenzhandels. Der Range Filter ist sehr empfindlich auf kleine Phasen, was bedeutet, dass die Strategie in kürzerer Zeit friedliche Positionen eröffnen kann, was für die Hochfrequenz geeignet ist und es ermöglicht, in einem stark schwankenden Kryptowährungsmarkt zu profitieren.
Risikoanalyse
Diese Strategie birgt immer noch einige Risiken. Zunächst einmal besteht die Gefahr, dass die technische Form des Urteils fehlschlägt, da der Indikator nicht hundertprozentig sicher ist, dass die Preisentwicklung stattfindet.
Ein weiteres Hauptrisiko besteht darin, dass die mittlere Linie des Spannungsfilters nicht vollständig die Preisschwankungen filtern kann. Bei Preisschwankungen, die größer als die mittlere Linie sind, wird die mittlere Linie außer Kraft gesetzt, was zu einem Risiko für falsche Signale führt. In diesem Fall können die Parameter entsprechend gelockert und die mittlere Linie erweitert werden.
Letztendlich ist der Hochfrequenz-Handel selbst mit Risiken verbunden. Wenn die Frequenz zu hoch ist, sind die Gebühren höher und können einen Teil der Gewinne ausgleichen. In diesem Fall können die Häufigkeit der Transaktionen und die Haltedauer angemessen reduziert werden.
Strategieoptimierung
Es gibt noch Raum für weitere Optimierungen in dieser Strategie. Zum Beispiel kann man erwägen, mehr Indikatoren zu kombinieren, wie z. B. die Trendbestätigung von Volatilitätsindikatoren, strengere Filterbedingungen zu implementieren, um sicherzustellen, dass Handelssignale präziser sind. Oder die Preisverhaltensregeln verschiedener Kryptowährungen und Aktien zu untersuchen und die für sie am besten geeigneten Indikatorparameter festzulegen.
Es ist auch möglich, dynamische Stop-Loss- und Stop-Out-Grenzen festzulegen. Das heißt, die Stop-Loss-Grenze wird erweitert, um mehr Gewinne zu erzielen, wenn die Position größer ist, oder die Stop-Off-Geschwindigkeit wird beschleunigt, wenn die Gewinne größer sind.
Schließlich können die Filterparameter optimiert werden, um einen Satz von Parametern zu finden, der den mittleren Bereich sowohl für die effektive Filterung von Schwankungen als auch für die Erfassung von Trendwendepunkten ermöglicht. Dies erfordert eine große Menge an Rückmessdaten für die iterative Analyse.
Zusammenfassen
Die Strategie ist erfolgreich in Kombination mit mehreren Indikatoren beurteilt und bildet eine hoch zuverlässige Handelsstrategie, die für den Hochfrequenz-Quantitative-Handel geeignet ist. Nach kontinuierlicher Optimierung und Verbesserung wird davon ausgegangen, dass stabile Erträge erzielt werden können und es lohnt sich, sie weiter zu entwickeln.
/*backtest
start: 2022-12-18 00:00:00
end: 2023-12-24 00:00:00
period: 1d
basePeriod: 1h
exchanges: [{"eid":"Futures_Binance","currency":"BTC_USDT"}]
*/

//@version=5
strategy(title='5cel Scalp Strategy BTCUSDT Long & Short 30 Min', shorttitle='BTCUSDT Long & Short Scalp 30m', precision=1, overlay=true)

//Swing Call - Based on RSI Overbought & Oversold
//#### Starts Here #####
ema_value = input(5)
sma_value = input(50)
ema1 = ta.ema(close, ema_value)
sma2 = ta.sma(close, sma_value)
rs = ta.rsi(close, 14)

iff_1 = high < sma2 ? color.red : color.yellow
iff_2 = low > sma2 ? color.lime : iff_1
mycolor = rs >= 85 or rs <= 15 ? color.yellow : iff_2

//For Main Strategy
bool swingCallGreen = false
bool swingCallRed = false
bool swingCallYellow = false

if rs >= 85 or rs <= 15
    //color.yellow
    swingCallGreen := false
    swingCallRed := false
    swingCallYellow := true
    swingCallYellow
else
    if low > sma2
        //color.lime
        swingCallGreen := true
        swingCallRed := false
        swingCallYellow := false
        swingCallYellow
        //color.red
    else if high < sma2
        swingCallGreen := false
        swingCallRed := true
        swingCallYellow := false
        swingCallYellow
    else
        //color.yellow
        swingCallGreen := false
        swingCallRed := false
        swingCallYellow := true
        swingCallYellow

hlong = input.int(80, title='Overbought limit of RSI', step=1)
ll = input.int(20, title='Oversold limit of RSI', step=1)

buyexit = ta.crossunder(rs, hlong)
sellexit = ta.crossover(rs, ll)

sellcall = ta.crossover(sma2, ema1) and open > close
buycall = ta.crossunder(sma2, ema1) and high > sma2
//#### Ends Here #####


//Parabolic SAR -  Trend Circles
//#### Starts Here #####
start = input.int(2, minval=0, maxval=10, title='Start - Default = 2 - Multiplied by .01')
increment = input.int(2, minval=0, maxval=10, title='Step Setting (Sensitivity) - Default = 2 - Multiplied by .01')
maximum = input.int(2, minval=1, maxval=10, title='Maximum Step (Sensitivity) - Default = 2 - Multiplied by .10')
sus = input(true, 'Show Up Trending Parabolic Sar')
sds = input(true, 'Show Down Trending Parabolic Sar')
disc = input(false, title='Start and Step settings are *.01 so 2 = .02 etc, Maximum Step is *.10 so 2 = .2')

startCalc = start * .01
incrementCalc = increment * .01
maximumCalc = maximum * .10

sarUp = ta.sar(startCalc, incrementCalc, maximumCalc)
sarDown = ta.sar(startCalc, incrementCalc, maximumCalc)

colUp = close >= sarDown ? color.lime : na
colDown = close <= sarUp ? color.red : na

parabolicSARGreen = ta.sar(startCalc, incrementCalc, maximumCalc)
parabolicSARRed = ta.sar(startCalc, incrementCalc, maximumCalc)
//#### Ends Here #####


//EMA Line
//#### Starts Here #####
ema100 = ta.ema(close, 100)
//#### Ends Here #####


// Ichimoku Cloud
//#### Starts Here #####
sCloud = input(false, 'Show Ichimoku lines')

// Colors
colorGreen = #00ff00
colorRed = #ff0000
colorTenkanViolet = #9400D3
colorKijun = #fdd8a0
colorLime = #006400
colorMaroon = #8b0000

//Periods are set to standard
tenkanPeriods = input.int(9, minval=1, title='Tenkan')
kijunPeriods = input.int(26, minval=1, title='Kijun')
chikouPeriods = input.int(52, minval=1, title='Chikou')
displacement = input.int(26, minval=1, title='Offset')

donchian(len) =>
    math.avg(ta.lowest(len), ta.highest(len))

tenkan = donchian(tenkanPeriods)
kijun = donchian(kijunPeriods)
senkouA = math.avg(tenkan, kijun)
senkouB = donchian(chikouPeriods)
displacedSenkouA = senkouA[displacement]
displacedSenkouB = senkouB[displacement]

bullishSignal = ta.crossover(tenkan, kijun)
bearishSignal = ta.crossunder(tenkan, kijun)

bullishSignalValues = bullishSignal ? tenkan : na
bearishSignalValues = bearishSignal ? tenkan : na


strongBullishSignal = bullishSignalValues > displacedSenkouA and bullishSignalValues > displacedSenkouB
neutralBullishSignal = bullishSignalValues > displacedSenkouA and bullishSignalValues < displacedSenkouB or bullishSignalValues < displacedSenkouA and bullishSignalValues > displacedSenkouB
weakBullishSignal = bullishSignalValues < displacedSenkouA and bullishSignalValues < displacedSenkouB

strongBearishSignal = bearishSignalValues < displacedSenkouA and bearishSignalValues < displacedSenkouB
neutralBearishSignal = bearishSignalValues > displacedSenkouA and bearishSignalValues < displacedSenkouB or bearishSignalValues < displacedSenkouA and bearishSignalValues > displacedSenkouB
weakBearishSignal = bearishSignalValues > displacedSenkouA and bearishSignalValues > displacedSenkouB
//#### Ends Here #####


//Higher High Lower Low Strategy
//#### Starts Here #####
lb = input.int(5, title='Left Bars', minval=1)
rb = input.int(5, title='Right Bars', minval=1)
showsupres = input.bool(true, title='Support/Resistance', inline='srcol')
supcol = input.color(color.lime, title='', inline='srcol')
rescol = input.color(color.red, title='', inline='srcol')
// srlinestyle = input.string(line.style_dotted, title='Line Style/Width', options=[line.style_solid, line.style_dashed, line.style_dotted], inline='style')
srlinewidth = input.int(3, title='', minval=1, maxval=5, inline='style')
changebarcol = input.bool(true, title='Change Bar Color', inline='bcol')
bcolup = input.color(color.blue, title='', inline='bcol')
bcoldn = input.color(color.black, title='', inline='bcol')

ph = ta.pivothigh(lb, rb)
pl = ta.pivotlow(lb, rb)

iff_3 = pl ? -1 : na  // Trend direction
hl = ph ? 1 : iff_3
iff_4 = pl ? pl : na  // similar to zigzag but may have multiple highs/lows
zz = ph ? ph : iff_4
valuewhen_1 = ta.valuewhen(hl, hl, 1)
valuewhen_2 = ta.valuewhen(zz, zz, 1)
zz := pl and hl == -1 and valuewhen_1 == -1 and pl > valuewhen_2 ? na : zz
valuewhen_3 = ta.valuewhen(hl, hl, 1)
valuewhen_4 = ta.valuewhen(zz, zz, 1)
zz := ph and hl == 1 and valuewhen_3 == 1 and ph < valuewhen_4 ? na : zz

valuewhen_5 = ta.valuewhen(hl, hl, 1)
valuewhen_6 = ta.valuewhen(zz, zz, 1)
hl := hl == -1 and valuewhen_5 == 1 and zz > valuewhen_6 ? na : hl
valuewhen_7 = ta.valuewhen(hl, hl, 1)
valuewhen_8 = ta.valuewhen(zz, zz, 1)
hl := hl == 1 and valuewhen_7 == -1 and zz < valuewhen_8 ? na : hl
zz := na(hl) ? na : zz

findprevious() =>  // finds previous three points (b, c, d, e)
    ehl = hl == 1 ? -1 : 1
    loc1 = 0.0
    loc2 = 0.0
    loc3 = 0.0
    loc4 = 0.0
    xx = 0
    for x = 1 to 1000 by 1
        if hl[x] == ehl and not na(zz[x])
            loc1 := zz[x]
            xx := x + 1
            break
    ehl := hl
    for x = xx to 1000 by 1
        if hl[x] == ehl and not na(zz[x])
            loc2 := zz[x]
            xx := x + 1
            break
    ehl := hl == 1 ? -1 : 1
    for x = xx to 1000 by 1
        if hl[x] == ehl and not na(zz[x])
            loc3 := zz[x]
            xx := x + 1
            break
    ehl := hl
    for x = xx to 1000 by 1
        if hl[x] == ehl and not na(zz[x])
            loc4 := zz[x]
            break
    [loc1, loc2, loc3, loc4]

float a = na
float b = na
float c = na
float d = na
float e = na
if not na(hl)
    [loc1, loc2, loc3, loc4] = findprevious()
    a := zz
    b := loc1
    c := loc2
    d := loc3
    e := loc4

_hh = zz and a > b and a > c and c > b and c > d
_ll = zz and a < b and a < c and c < b and c < d
_hl = zz and (a >= c and b > c and b > d and d > c and d > e or a < b and a > c and b < d)
_lh = zz and (a <= c and b < c and b < d and d < c and d < e or a > b and a < c and b > d)

plotshape(_hl, text='HL', title='Higher Low', style=shape.labelup, color=color.new(color.lime, 0), textcolor=color.new(color.black, 0), location=location.belowbar, offset=-rb)
plotshape(_hh, text='HH', title='Higher High', style=shape.labeldown, color=color.new(color.lime, 0), textcolor=color.new(color.black, 0), location=location.abovebar, offset=-rb)
plotshape(_ll, text='LL', title='Lower Low', style=shape.labelup, color=color.new(color.red, 0), textcolor=color.new(color.white, 0), location=location.belowbar, offset=-rb)
plotshape(_lh, text='LH', title='Lower High', style=shape.labeldown, color=color.new(color.red, 0), textcolor=color.new(color.white, 0), location=location.abovebar, offset=-rb)

float res = na
float sup = na
res := _lh ? zz : res[1]
sup := _hl ? zz : sup[1]

int trend = na
iff_5 = close < sup ? -1 : nz(trend[1])
trend := close > res ? 1 : iff_5

res := trend == 1 and _hh or trend == -1 and _lh ? zz : res
sup := trend == 1 and _hl or trend == -1 and _ll ? zz : sup
rechange = res != res[1]
suchange = sup != sup[1]

var line resline = na
var line supline = na
//#### Ends Here #####


//Range Filter 5Min
//#### Starts Here #####

src = input(defval=close, title='Source')
per = input.int(defval=100, minval=1, title='Sampling Period')

// Range Multiplier
mult = input.float(defval=3.0, minval=0.1, title='Range Multiplier')

// Smooth Average Range
smoothrng(x, t, m) =>
    wper = t * 2 - 1
    avrng = ta.ema(math.abs(x - x[1]), t)
    smoothrng = ta.ema(avrng, wper) * m
    smoothrng
smrng = smoothrng(src, per, mult)

// Range Filter
rngfilt(x, r) =>
    rngfilt = x
    rngfilt := x > nz(rngfilt[1]) ? x - r < nz(rngfilt[1]) ? nz(rngfilt[1]) : x - r : x + r > nz(rngfilt[1]) ? nz(rngfilt[1]) : x + r
    rngfilt
filt = rngfilt(src, smrng)

// Filter Direction
upward = 0.0
upward := filt > filt[1] ? nz(upward[1]) + 1 : filt < filt[1] ? 0 : nz(upward[1])
downward = 0.0
downward := filt < filt[1] ? nz(downward[1]) + 1 : filt > filt[1] ? 0 : nz(downward[1])

// Target Bands
hband = filt + smrng
lband = filt - smrng

// Colors
filtcolor = upward > 0 ? color.lime : downward > 0 ? color.red : color.orange
barcolor = src > filt and src > src[1] and upward > 0 ? color.lime : src > filt and src < src[1] and upward > 0 ? color.green : src < filt and src < src[1] and downward > 0 ? color.red : src < filt and src > src[1] and downward > 0 ? color.maroon : color.orange

// Break Outs
longCond = bool(na)
shortCond = bool(na)
longCond := src > filt and src > src[1] and upward > 0 or src > filt and src < src[1] and upward > 0
shortCond := src < filt and src < src[1] and downward > 0 or src < filt and src > src[1] and downward > 0

CondIni = 0
CondIni := longCond ? 1 : shortCond ? -1 : CondIni[1]
longCondition = longCond and CondIni[1] == -1
shortCondition = shortCond and CondIni[1] == 1
//#### Ends Here #####


//#### Starts Here #####
source = close
useCurrentRes = input(true, title='Use Current Chart Resolution?')
resCustom = input.timeframe(title='Use Different Timeframe? Uncheck Box Above', defval='60')
smd = input(true, title='Show MacD & Signal Line? Also Turn Off Dots Below')
sd = input(true, title='Show Dots When MacD Crosses Signal Line?')
sh = input(true, title='Show Histogram?')
macd_colorChange = input(true, title='Change MacD Line Color-Signal Line Cross?')
hist_colorChange = input(true, title='MacD Histogram 4 Colors?')

res1 = useCurrentRes ? timeframe.period : resCustom

fastLength = input.int(12, minval=1)
slowLength = input.int(26, minval=1)
signalLength = input.int(9, minval=1)

fastMA = ta.ema(source, fastLength)
slowMA = ta.ema(source, slowLength)

macd = fastMA - slowMA
signal = ta.sma(macd, signalLength)
hist = macd - signal

outMacD = request.security(syminfo.tickerid, res1, macd)
outSignal = request.security(syminfo.tickerid, res1, signal)
outHist = request.security(syminfo.tickerid, res1, hist)

histA_IsUp = outHist > outHist[1] and outHist > 0
histA_IsDown = outHist < outHist[1] and outHist > 0
histB_IsDown = outHist < outHist[1] and outHist <= 0
histB_IsUp = outHist > outHist[1] and outHist <= 0

//MacD Color Definitions
macd_IsAbove = outMacD >= outSignal
macd_IsBelow = outMacD < outSignal

plot_color = hist_colorChange ? histA_IsUp ? color.aqua : histA_IsDown ? color.blue : histB_IsDown ? color.red : histB_IsUp ? color.maroon : color.yellow : color.gray
macd_color = macd_colorChange ? macd_IsAbove ? color.lime : color.red : color.red
signal_color = macd_colorChange ? macd_IsAbove ? color.yellow : color.yellow : color.lime

circleYPosition = outSignal
//#### Ends Here #####


//////////////////
// Main Strategy
/////////////////
//#### Starts Here #####
var bottomText = 'Something is not ok'

bool rangeBuy = false
if longCondition
    rangeBuy := true
else
    rangeBuy := false

bool rangeSell = false
if shortCondition
    rangeSell := true
else
    rangeSell := false

bool ema100Bullish = false
bool ema100Bearish = false
bool ichimokuBearish = false
bool ichimokuBullish = false
string statusChance = 'Who knows what will happen'
string futureIchimokuTrend = 'Anything can happen'

if close > ema100
    ema100Bullish := true
    ema100Bearish := false
else
    ema100Bullish := false
    ema100Bearish := true

if displacedSenkouA > displacedSenkouB
    ichimokuBearish := false
    futureIchimokuTrend := 'Green - chance to go up'
    ichimokuBullish := true
else
    ichimokuBearish := true
    futureIchimokuTrend := 'Red - chance to go down'
    ichimokuBullish := false
    ichimokuBullish

if ema100Bullish and parabolicSARGreen
    if ichimokuBullish
        statusChance := '100%'
    else
        statusChance := '95%'
else
    if ema100Bullish and parabolicSARRed
        statusChance := '75%'
    else if ema100Bearish and parabolicSARGreen
        statusChance := '65%'
    else
        statusChance := '55%'

bool longTradePosition = false
bool shortTradePosition = false
string longTradeText = 'Now cannot say anything'

if (swingCallGreen or swingCallYellow) and ichimokuBullish and longCondition and ema100Bullish and parabolicSARGreen
    longTradePosition := true
    longTradeText := 'Bullish'

bottomText := longTradeText + ' Chance: ' + statusChance + '\n Future Trend: ' + futureIchimokuTrend
// Bottom Text

var tLog = table.new(position=position.bottom_right, rows=1, columns=2, bgcolor=color.blue, border_width=1)
table.cell(tLog, row=0, column=0, text=bottomText, text_color=color.white)
table.cell_set_text(tLog, row=0, column=0, text=bottomText)
//#### Ends Here #####

bool entryLongPosition = false
bool exitLongPosition = false

bool entryShortPosition = false
bool exitShortPosition = false

bool longPositionCount = false
bool shortPositionCount = false


if (strategy.position_size > 0)
    longPositionCount := true

if (strategy.position_size < 0)
    shortPositionCount := true

// Entry LONG
if (longCondition) and (not longPositionCount)
    entryLongPosition := true

// Exit LONG
if (shortCondition) and (longPositionCount)
    exitLongPosition := true

// Entry SHORT
if (shortCondition) and (not shortPositionCount)
    entryShortPosition := true

// Exit SHORT
if (longCondition) and (shortPositionCount)
    exitShortPosition := true

// LONG Entry & Exit
plotshape(entryLongPosition, style=shape.labeldown, location=location.abovebar, color=color.new(color.green, 0), size=size.tiny, title='buy label', text='5cel\nLONG Entry', textcolor=color.new(color.white, 0))
plotshape(exitLongPosition, style=shape.labelup, location=location.belowbar, color=color.new(color.blue, 0), size=size.tiny, title='sell label', text='5cel\nExit LONG', textcolor=color.new(color.white, 0))

//SHORT Entry & Exit
plotshape(entryShortPosition, style=shape.labeldown, location=location.abovebar, color=color.new(color.red, 0), size=size.tiny, title='buy label', text='5cel\nSHORT Entry', textcolor=color.new(color.white, 0))
plotshape(exitShortPosition, style=shape.labelup, location=location.belowbar, color=color.new(color.blue, 0), size=size.tiny, title='sell label', text='5cel\nExit SHORT', textcolor=color.new(color.white, 0))

//Get the Current Value
heikinashi_close = request.security(ticker.heikinashi(syminfo.tickerid), timeframe.period, close)

if entryLongPosition
    longLabel = label.new(bar_index, high, text=str.tostring(heikinashi_close, '0.00'), color=color.orange, style=label.style_label_down, yloc=yloc.abovebar)

if entryShortPosition
    shortLabel = label.new(bar_index, high, text=str.tostring(heikinashi_close, '0.00'), color=color.orange, style=label.style_label_down, yloc=yloc.abovebar)

/// SHORT Exit
strategy.close("short", when=exitShortPosition, comment="close_short_position")

/// LONG Exit
strategy.close("long", when=exitLongPosition, comment = "close_long_position")

/// LONG Enter
strategy.entry("long", strategy.long, when=entryLongPosition, comment="open_long_position")

/// SHORT Enter
strategy.entry("short", strategy.short, when = entryShortPosition, comment="open_short_position")