El valor de las operaciones de mercado se calcula a partir de las siguientes cifras:
El autor:¿ Qué pasa?, Fecha: 2022-05-07 17:13:32Las etiquetas:El MACD
Aquí hay una combinación del clásico MACD (indicador de convergencia de divergencia de la media móvil) con el clásico SMA de media móvil lenta con el período 200 juntos como una estrategia.
Esta estrategia va a largo si el histograma MACD y el impulso MACD están por encima de cero y el promedio móvil MACD rápido está por encima del promedio móvil MACD lento. Como filtro largo adicional, el precio reciente tiene que estar por encima del SMA 200. Si la lógica inversa es cierta, la estrategia va corta. Para el peor caso hay una pérdida máxima de capital intradiario del 50% del filtro.
Ahorra otros 999 dólares con mi estrategia gratuita.
Esta estrategia funciona en el backtest en el gráfico diario de Bitcoin, así como en los gráficos diarios del S&P 500 y el Dow Jones Industrial Average. El rendimiento actual al 30 de noviembre de 2015 en el SPX500 CFD diario es rentable en porcentaje: 68% desde el año 1970 con un factor de ganancia de 6.4.
Todos los trades implican un alto riesgo; el rendimiento pasado no es necesariamente indicativo de resultados futuros. Los resultados hipotéticos o simulados del rendimiento tienen ciertas limitaciones inherentes. A diferencia de un registro de rendimiento real, los resultados simulados no representan el comercio real. Además, ya que las operaciones no se han ejecutado realmente, los resultados pueden haber subcompensado o sobrecompensado el impacto de ciertos factores del mercado, como la falta de liquidez. Los programas de comercio simulados en general también están sujetos al hecho de que están diseñados con el beneficio de la retrospectiva.
Prueba posterior
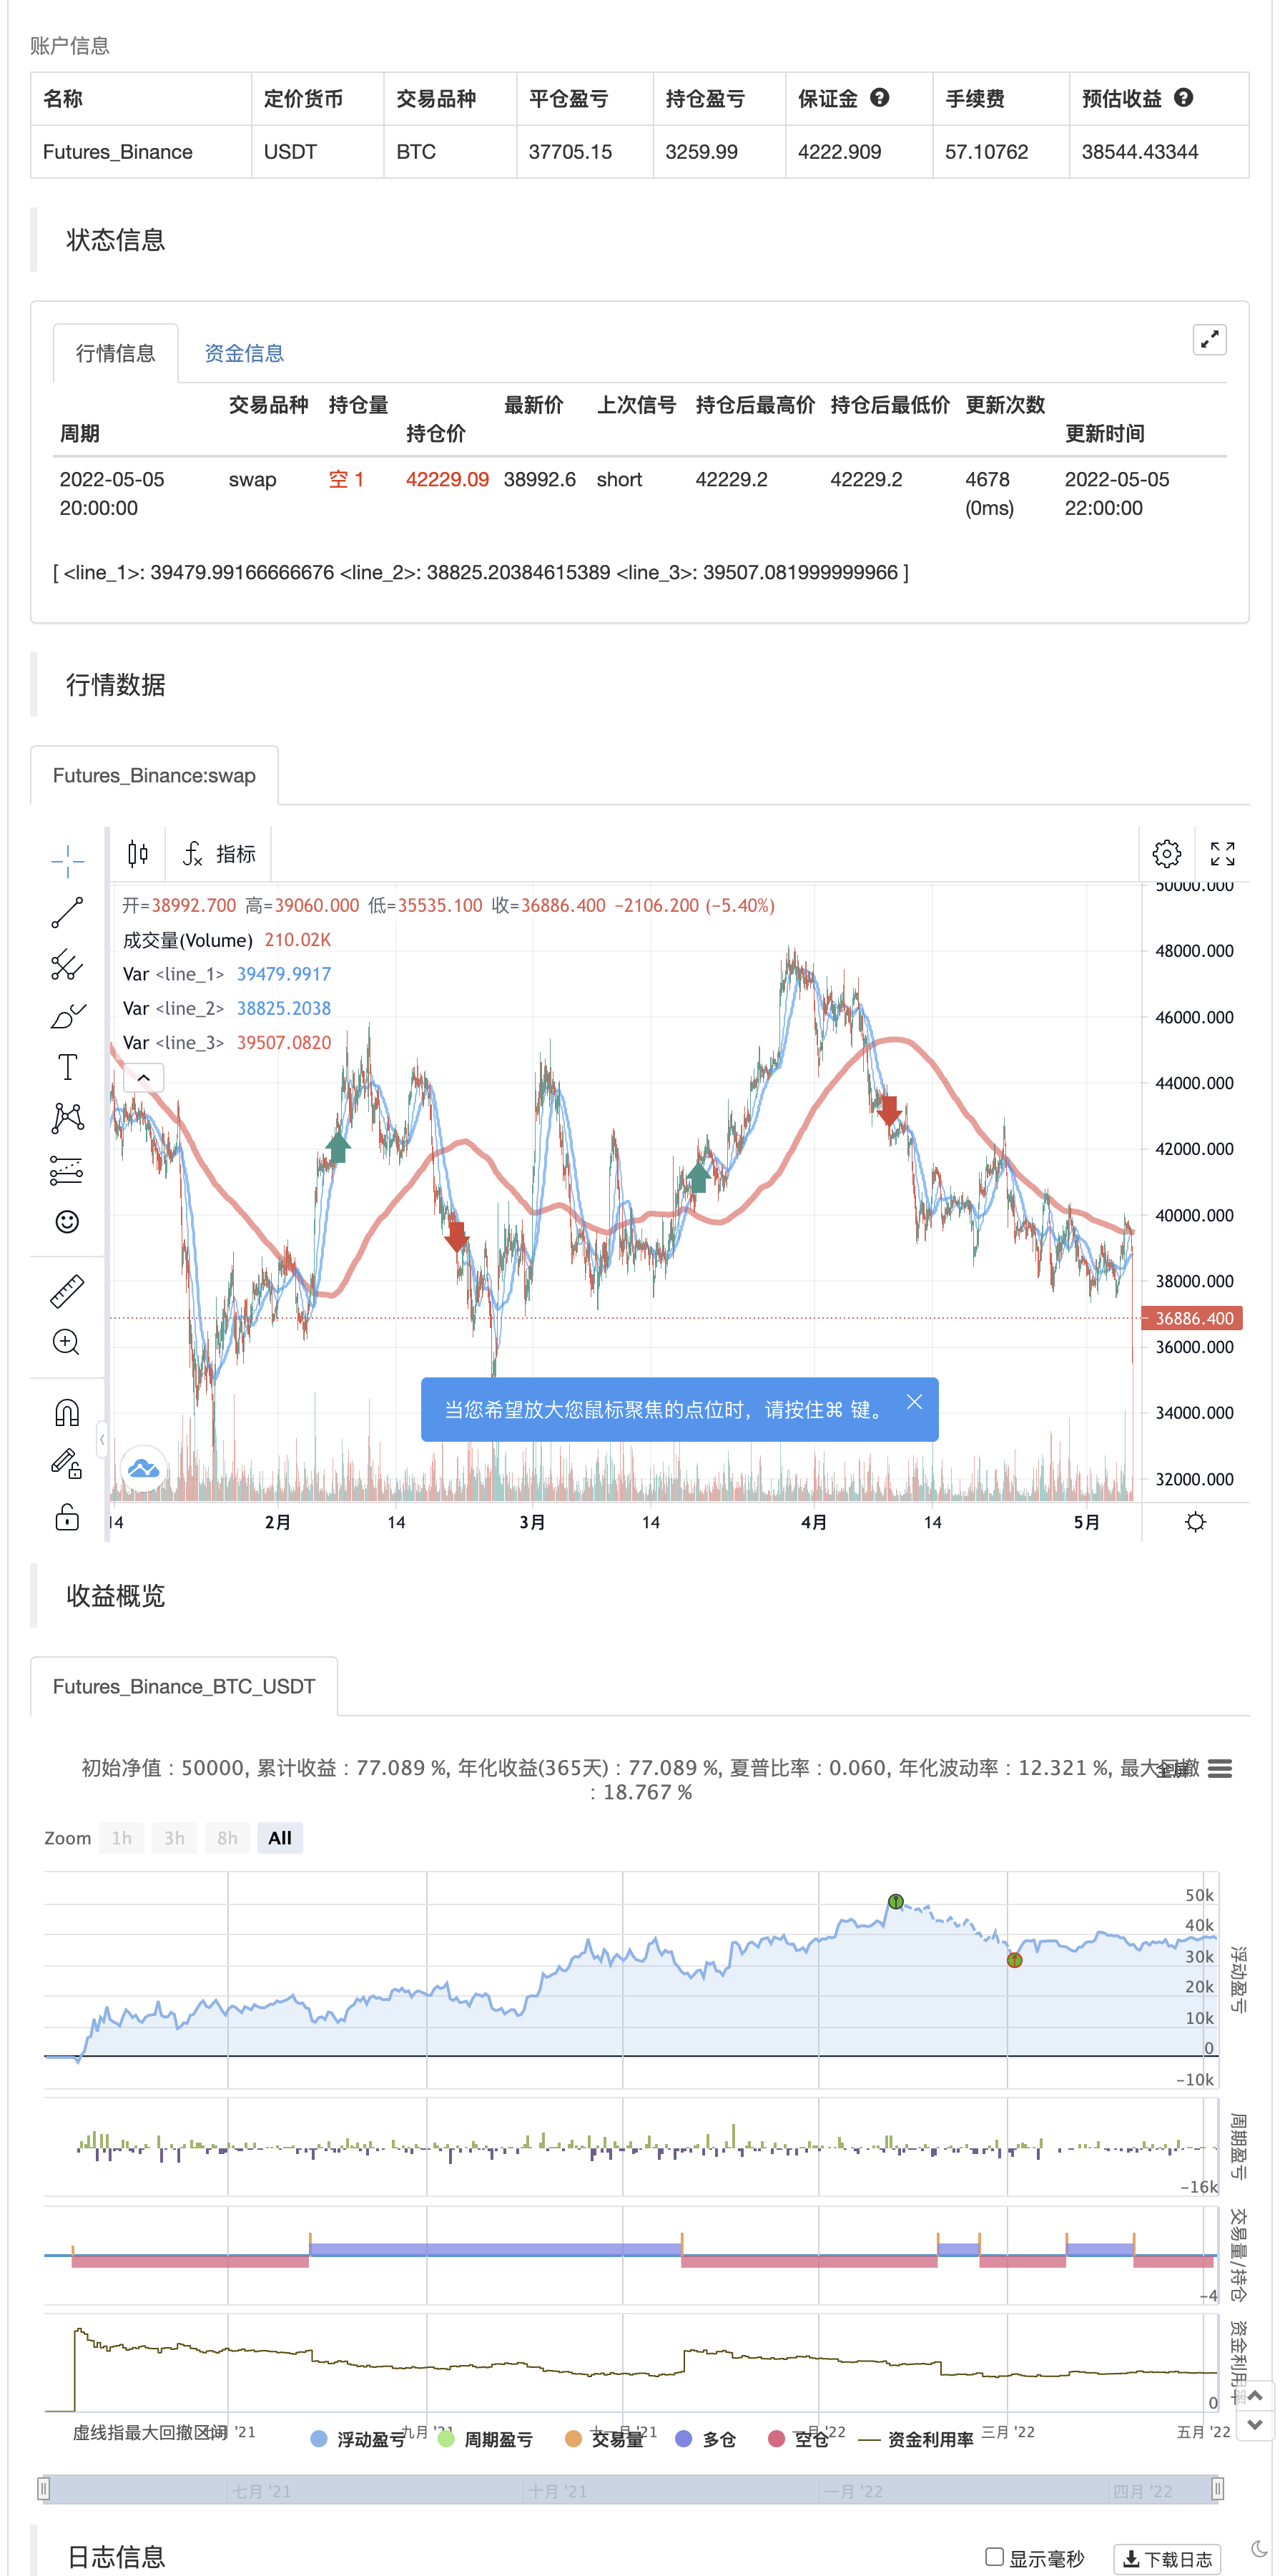
/*backtest
start: 2021-05-06 00:00:00
end: 2022-05-05 23:59:00
period: 2h
basePeriod: 15m
exchanges: [{"eid":"Futures_Binance","currency":"BTC_USDT"}]
*/

//@version=2
strategy("MACD + SMA 200 Strategy (by ChartArt)", shorttitle="CA_-_MACD_SMA_strategy", overlay=true)

// ChartArt's MACD + SMA 200 Strategy
//
// Version 1.0
// Idea by ChartArt on November 30, 2015.
//
// Here is a combination of the MACD with the
// slow moving average SMA 200 as a strategy.
//
// This strategy goes long if the MACD histogram
// and the MACD momentum are both above zero and
// the fast MACD moving average is above the
// slow MACD moving average. As additional long filter
// the recent price has to be above the SMA 200.
// If the inverse logic is true, the strategy
// goes short. For the worst case there is a
// max intraday equity loss of 50% filter.


// Input
source = input(close)
fastLength = input(12, minval=1, title="MACD fast moving average")
slowLength=input(26,minval=1, title="MACD slow moving average")
signalLength=input(9,minval=1, title="MACD signal line moving average")
veryslowLength=input(200,minval=1, title="Very slow moving average")
switch1=input(true, title="Enable Bar Color?")
switch2=input(true, title="Enable Moving Averages?")
switch3=input(true, title="Enable Background Color?")

// Calculation
fastMA = ta.sma(source, fastLength)
slowMA = ta.sma(source, slowLength)
veryslowMA = ta.sma(source, veryslowLength)
macd = fastMA - slowMA
signal = ta.sma(macd, signalLength)
hist = macd - signal

// Colors
MAtrendcolor = change(veryslowMA) > 0 ? color.green : color.red
trendcolor = fastMA > slowMA and change(veryslowMA) > 0 and close > slowMA ? color.green : fastMA < slowMA and change(veryslowMA) < 0 and close < slowMA ? color.red : color.blue
bartrendcolor = close > fastMA and close > slowMA and close > veryslowMA and change(slowMA) > 0 ? color.green : close < fastMA and close < slowMA and close < veryslowMA and change(slowMA) < 0 ? color.red : color.blue
backgroundcolor = slowMA > veryslowMA and crossover(hist, 0) and macd > 0 and fastMA > slowMA and close[slowLength] > veryslowMA ? color.green : slowMA < veryslowMA and crossunder(hist, 0) and macd < 0 and fastMA < slowMA and close[slowLength] < veryslowMA ? color.red : na
//bgcolor(switch3?backgroundcolor:na,transp=80)
//barcolor(switch1?bartrendcolor:na)

// Output
F=plot(switch2?fastMA:na,color=trendcolor)
S=plot(switch2?slowMA:na,color=trendcolor,linewidth=2)
V=plot(switch2?veryslowMA:na,color=MAtrendcolor,linewidth=4)
//fill(F,V,color=gray)

// Strategy
buyprice = low
sellprice = high
cancelLong = slowMA < veryslowMA
cancelShort = slowMA > veryslowMA


if crossover(hist, 0) and macd > 0 and fastMA > slowMA and close[slowLength] > veryslowMA
    strategy.entry("MACDLE", strategy.long, stop=buyprice, comment="Bullish")

else if crossunder(hist, 0) and macd < 0 and fastMA < slowMA and close[slowLength] < veryslowMA
    strategy.entry("MACDSE", strategy.short, stop=sellprice, comment="Bearish")

//maxIdLossPcnt = input(50, "Max Intraday Loss(%)", type=float)
//strategy.risk.max_intraday_loss(maxIdLossPcnt, strategy.percent_of_equity)

//plot(strategy.equity, title="equity", color=red, linewidth=2, style=areabr)
- MACD RSI Ichimoku Tendencia de impulso después de una estrategia larga
- Estrategia de negociación basada en cruces de oro y de muerte MACD consecutivos
- Estrategia reforzada de cruce de la EMA con el RSI/MACD/ATR
- Estrategia de negociación a largo plazo combinada del MACD y del RSI
- Estrategia de combinación de múltiples indicadores (CCI, DMI, MACD, ADX)
- Tendencia de múltiples indicadores siguiendo la estrategia
- El CCI, el DMI y la estrategia de corto plazo híbrida MACD
- Teoría de las ondas de Elliott 4-9 Detección automática de ondas de impulso Estrategia de negociación
- Estrategia MACD Cruz de Oro y Cruz de la Muerte
- El valor de las operaciones de mercado se calcula en función de las operaciones de mercado.
- Estrategia de ruptura del MACD BB
- La estrategia de fluctuación fácil de Shinobi en la versión en lengua de Pine
- 3EMA + Boullinger + el eje central
- Baguetas de granos
- La máquina de moler
- Indicador de inversión de K I
- Las velas engullentes
- MA Emperador en sí
- Puntos de reversión de Demark
- Los patrones de swing altos/bajos y de velas
- Superposición de TMA
- Sistema de disparo por honda CM
- Bollinger + RSI, doble estrategia v1.1
- Estrategia de bandas de Bollinger
- Seguimiento de tendencias optimizado
- Retorno mensual en las estrategias de PineScript
- ADX y DI para v4
- MacD Indicador personalizado-marco de tiempo múltiple + Todas las opciones disponibles!
- Indicador: Oscilador de tendencia de onda
- Indicador de impulso de compresión
- La tendencia alfa