Williams %R - Limpiado
El autor:¿ Qué pasa?, Fecha: 2022-05-09 12:04:48Las etiquetas:La WMAEl EMA
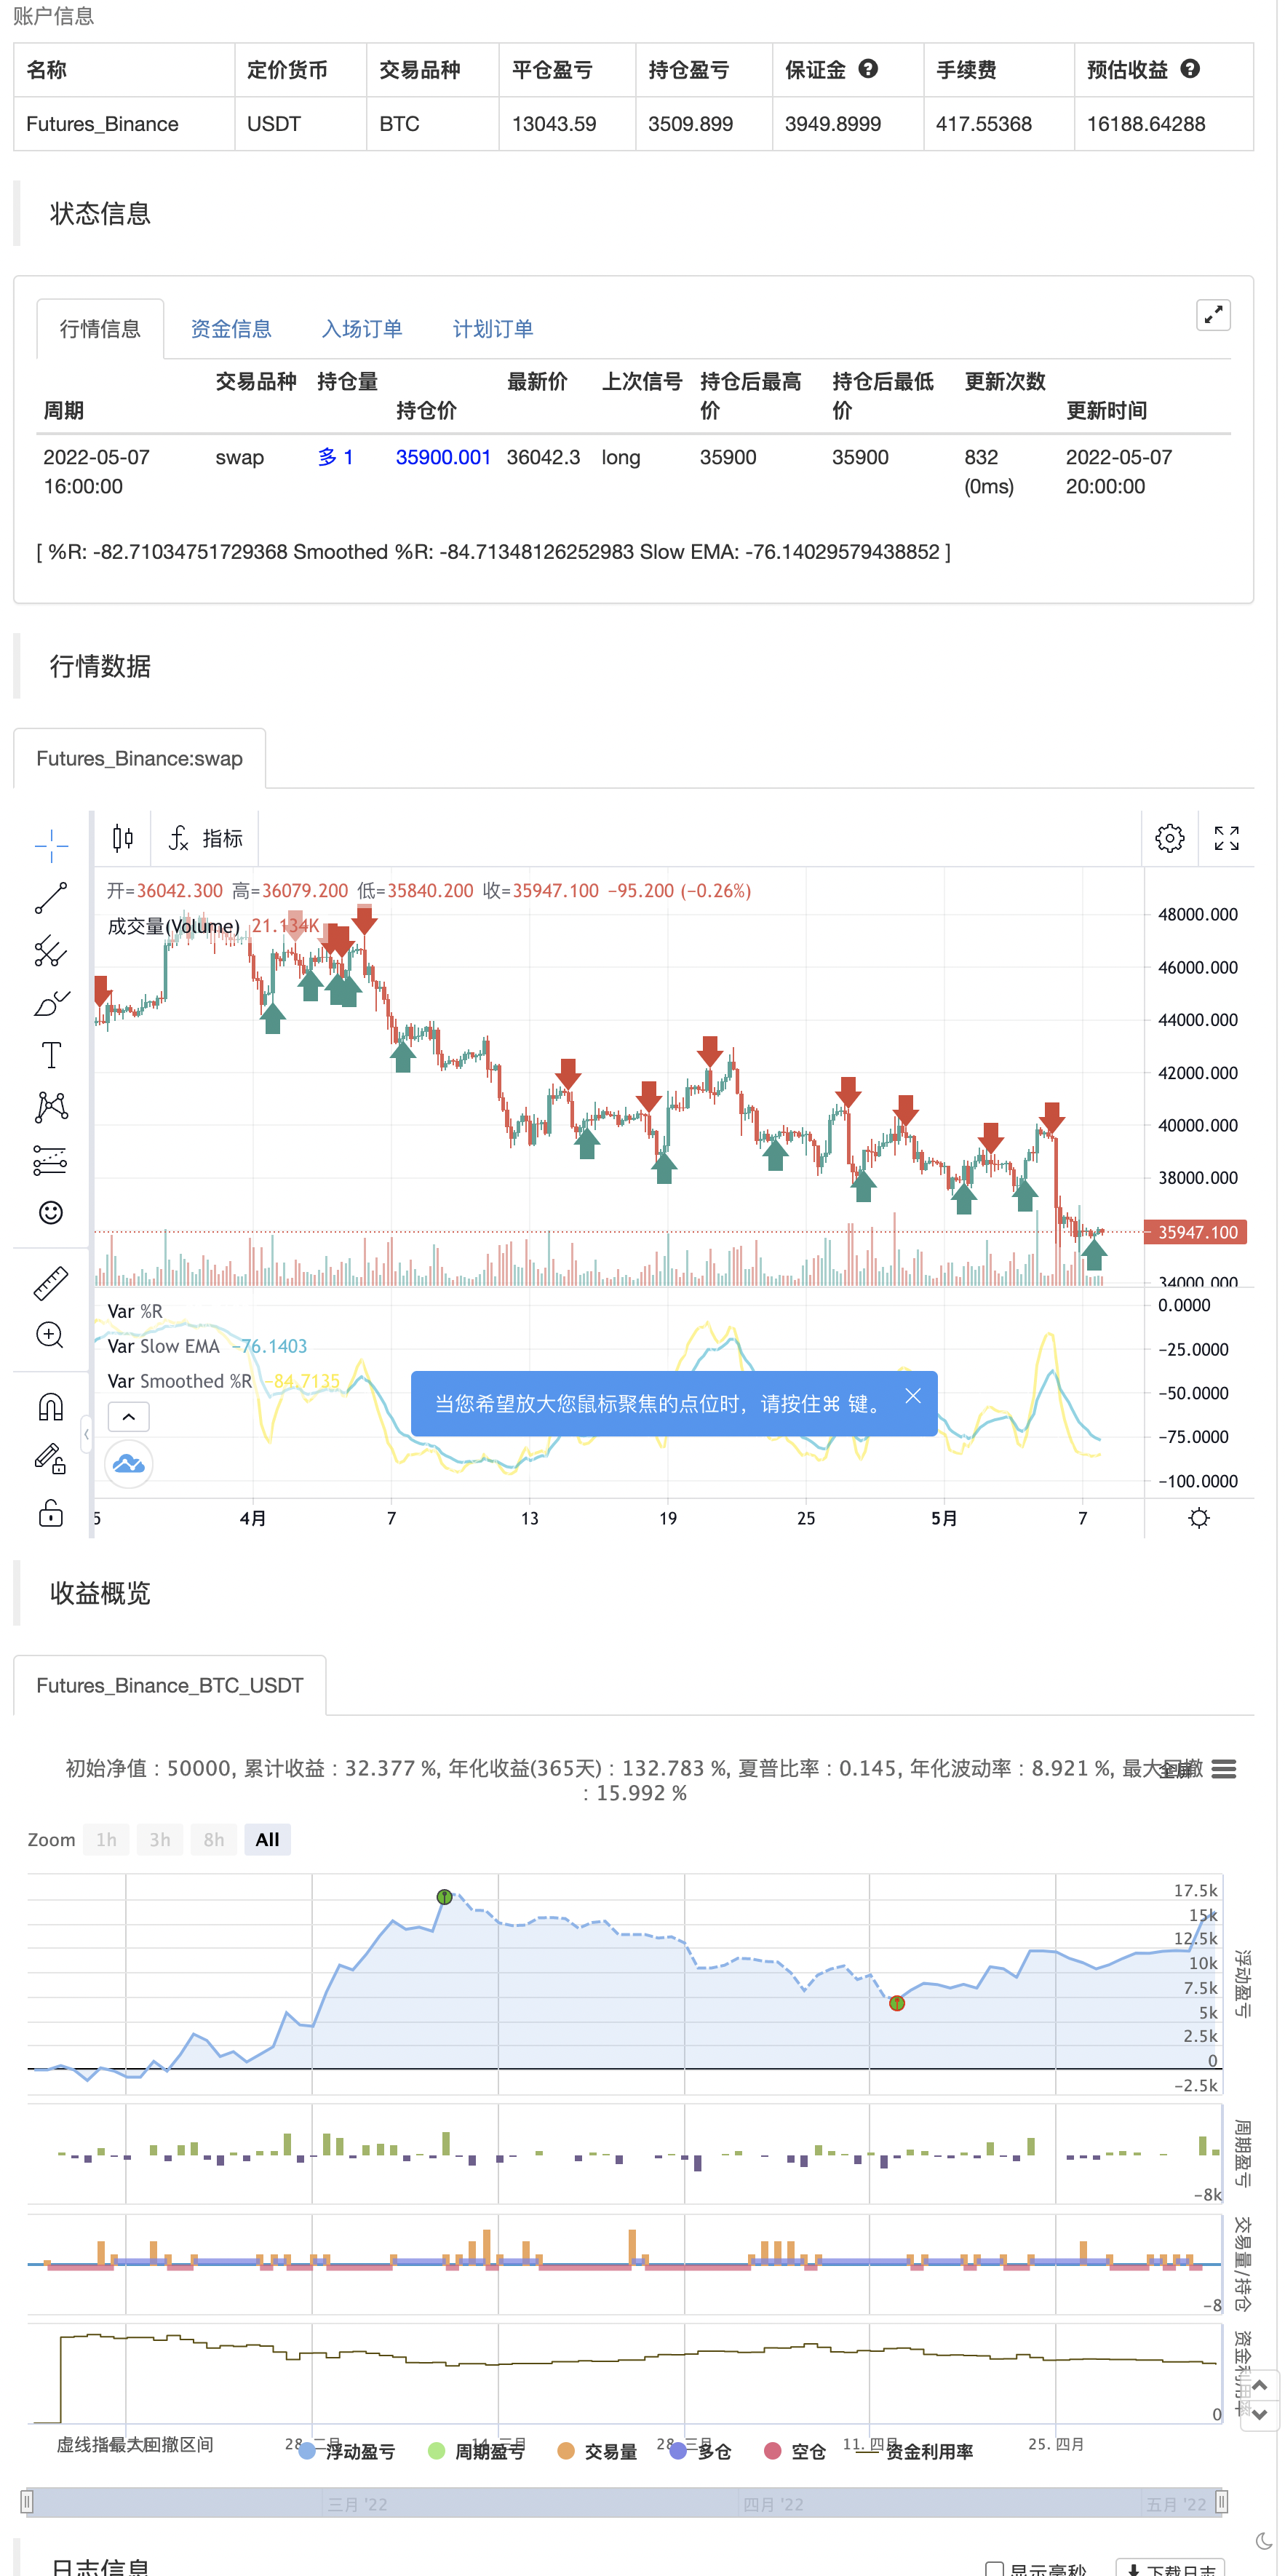
De la descripción de TradingView: Williams %R (%R) es un oscilador basado en el impulso utilizado en el análisis técnico, principalmente para identificar condiciones de sobrecompra y sobreventa. El %R se basa en una comparación entre el cierre actual y el máximo máximo para un período de retroalimentación definido por el usuario. %R oscila entre 0 y -100 (note los valores negativos) con lecturas más cercanas a cero que indican condiciones de sobrecompra y lecturas más cercanas a -100 que indican sobreventa.
¿Qué es especial? Este indicador añade dos líneas EMA adicionales al indicador original Williams %R. Las longitudes EMA predeterminadas son 5 y 13. Este indicador incluye:
- las señales para cruces de la EMA. Las cruces de la EMA pueden ayudar a indicar cambios de tendencia confirmados. Los colores predeterminados son verde y rojo
- las señales para inversiones de tendencia en la línea EMA más rápida.
Alertas disponibles para cruces alcistas / bajistas y reversiones.
¡Disfruta de ello!
Prueba posterior
/*backtest
start: 2022-02-08 00:00:00
end: 2022-05-08 00:00:00
period: 4h
basePeriod: 15m
exchanges: [{"eid":"Futures_Binance","currency":"BTC_USDT"}]
*/

// This source code is subject to the terms of the Mozilla Public License 2.0 at https://mozilla.org/MPL/2.0/
// © platsn

//@version=5
indicator(title='Williams %R - Smoothed', shorttitle='The Smooth Willy')

// Williams %R
length = input.int(defval=34, minval=1)
upper = ta.highest(length)
lower = ta.lowest(length)

output = 100 * (close - upper) / (upper - lower)

fast_period = input(defval=5, title='Smoothed %R Length')
slow_period = input(defval=13, title='Slow EMA Length')

fast_ema = ta.wma(output,fast_period)
slow_ema = ta.ema(output,slow_period)

// Plot
//h1 = hline(-20, title='Upper Band')
//h2 = hline(-80, title='Lower Band')
//fill(h1, h2, title='Background', transp=90)

plot(output, title='%R', color=color.new(color.white, 80), linewidth=1)
plot(fast_ema, title='Smoothed %R', color=color.new(color.yellow, 0), linewidth=2)
plot(slow_ema, title='Slow EMA', color=color.new(color.aqua, 0), linewidth=2)

bullX = ta.crossover(fast_ema, slow_ema)
bearX = ta.crossunder(fast_ema, slow_ema)
bullreverse = fast_ema[2] > fast_ema[1] and fast_ema > fast_ema[1] and fast_ema < -30
bearreverse = fast_ema[2] < fast_ema[1] and fast_ema < fast_ema[1] and fast_ema > -70

plotX = input.bool(true, "Show EMA Crossovers")
plotRev = input.bool(true, "Show trend reversals")

//plotshape(plotX and bearX ,"Cross down", color=color.red, style=shape.triangledown, location = location.top, size =size.tiny, offset=-1)
//plotshape(plotX and bullX ,"Cross up", color=color.green, style=shape.triangleup, location = location.bottom, size =size.tiny, offset=-1)
//plotshape(plotRev and bearreverse ,"Bear reversal", color=color.orange, style=shape.triangledown, location = location.top, size =size.tiny, offset=-1)
//plotshape(plotRev and bullreverse ,"Bull reversal", color=color.blue, style=shape.triangleup, location = location.bottom, size =size.tiny, offset=-1)

//alertcondition(bearX,"Bearish Crossover", "Bearish cross on William %R")
//alertcondition(bullX,"Bullish Crossover", "Bullish cross on William %R")
//alertcondition(bearreverse,"Bearish Reversal", "Bearish Reversal on William %R")
//alertcondition(bullreverse,"Billish Reversal", "Bullish Reversal on William %R")

if plotRev and bullreverse
    strategy.entry("Enter Long", strategy.long)
else if plotRev and bearreverse
    strategy.entry("Enter Short", strategy.short)
- Estrategia de escáner bajo cripto
- Estrategia de negociación cuantitativa basada en medias móviles y bandas de Bollinger
- Ratio de energía direccional acelerada por volumen de RedK
- HALFTREND + HEMA + SMA (Estrategia de la señal falsa)
- Estrategia Swing Hull/rsi/EMA
- Alerta cruzada de promedio móvil, marco de tiempo múltiple (MTF)
- La mejor estrategia de ingestión + escape
- RedK Dual VADER con barras de energía
- Barras de impulso de RedK
- Oscilador de arco iris
- Alertas R3.0 + Condición de volatilidad de aumento + TP RSI
- No puedo.
- CCI + EMA con estrategia cruzada de los índices de crecimiento
- Estrategia de captura de tendencias de bandas de EMA + leledc + bandas de Bollinger
- Las operaciones de las entidades de crédito se clasifican en el modelo de referencia.
- Estrategia MACD Willy
- RSI - Señales de compra y venta
- Tendencia de Heikin-Ashi
- HA Parcialidad del mercado
- Oscilador suave de la nube de Ichimoku
- QQE MOD + SSL híbrido + Waddah Attar explosión
- Comprar y vender Strat
- Triple Supertrend con EMA y ADX
- Tom DeMark Mapa de calor secuencial
- jma + dwma por multigranos
- El MACD mágico
- Puntuación Z con señales
- La estrategia de fluctuación fácil de Shinobi en la versión en lengua de Pine
- 3EMA + Boullinger + el eje central
- Baguetas de granos