Pruebas de retroceso - Indicador
El autor:¿ Qué pasa?, Fecha: 2022-05-17 13:59:05Las etiquetas:El EMA
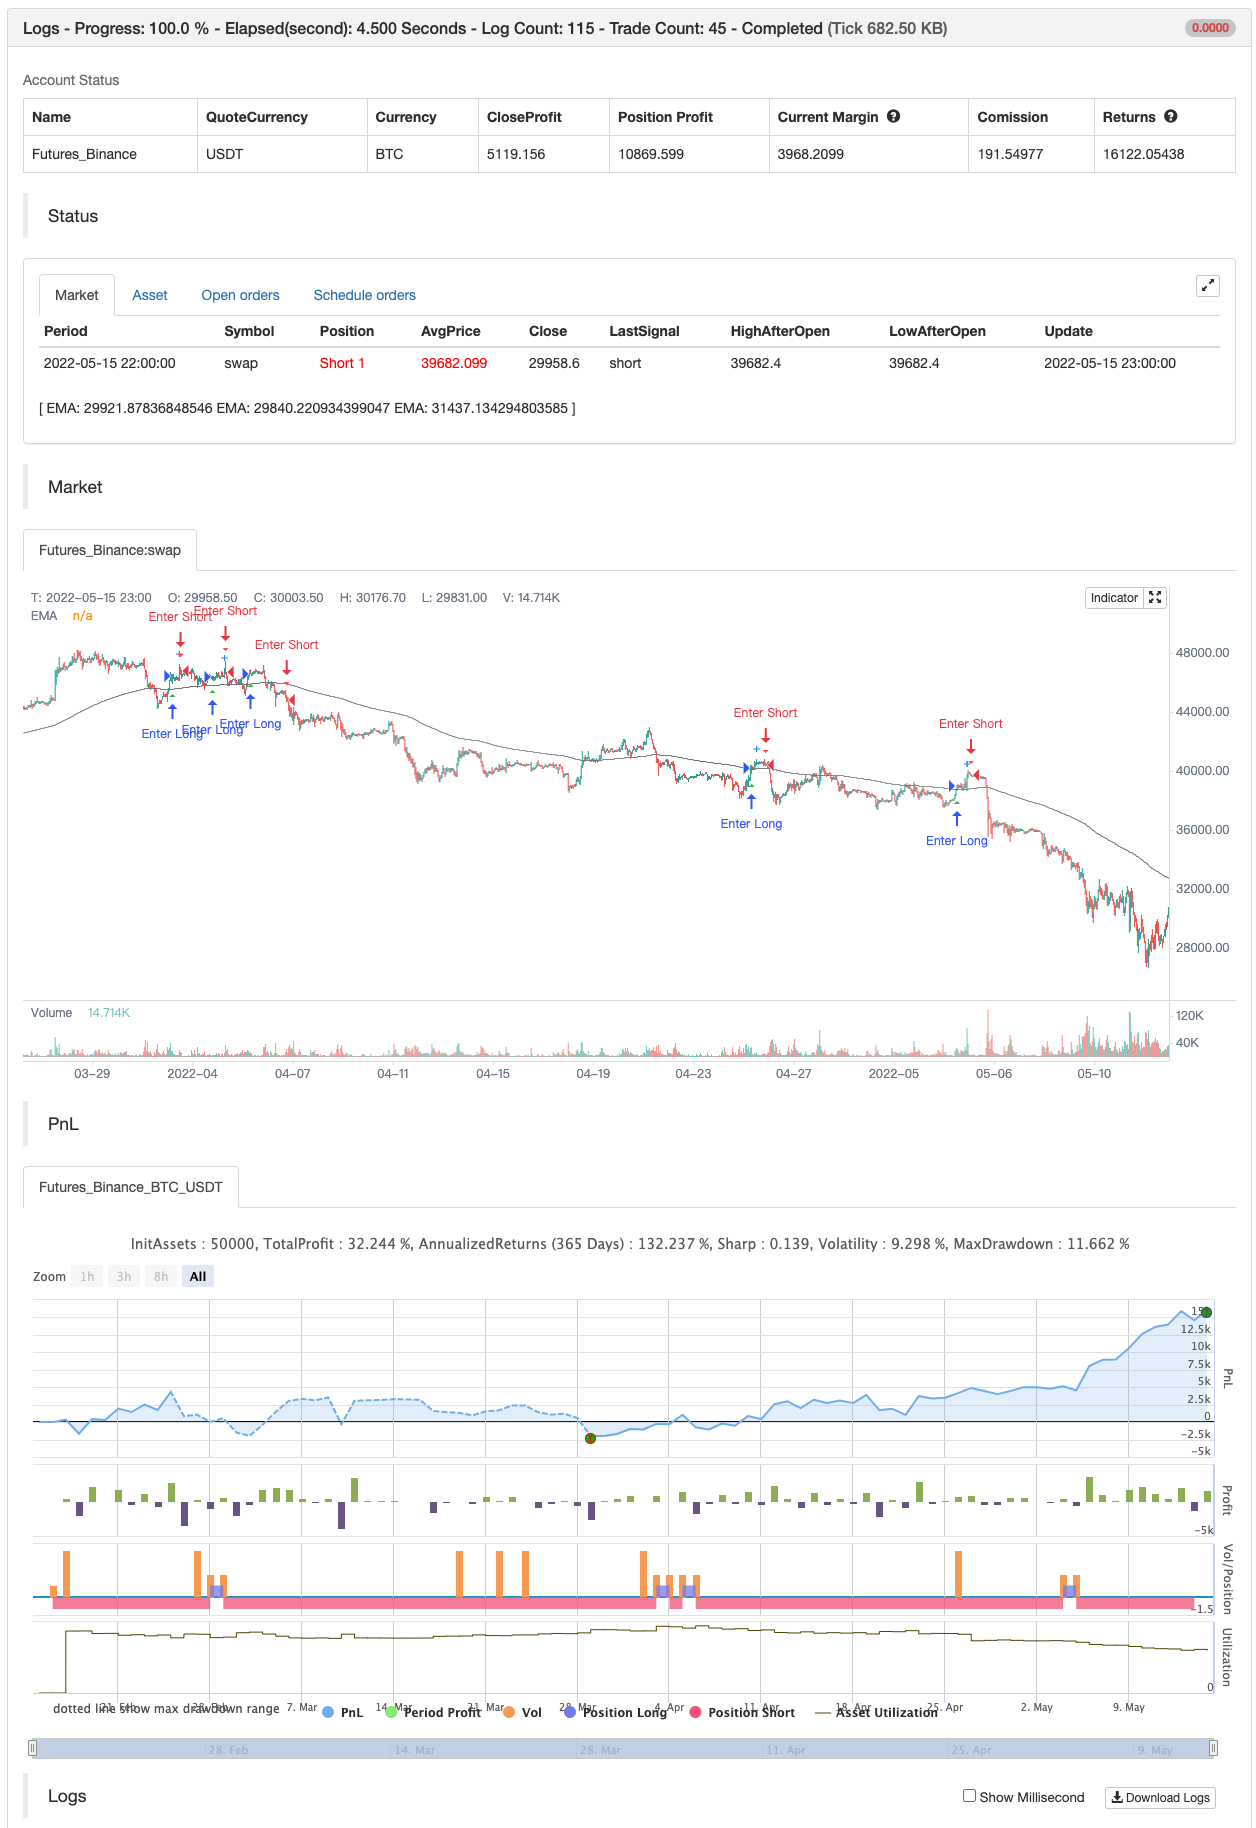
Para cualquier persona interesada, aquí hay un ejemplo de cómo poner los resultados de backtesting en un indicador. Esto calcula los mismos valores que se encuentran en la pantalla de resumen del backtester de estrategia incorporado. Esto usará el mismo tamaño de resultado que el backtester estándar, es decir, el gráfico de 5 minutos captura aproximadamente 1 mes de datos, el gráfico de 1 minuto captura 1 semana de datos, etc. Intenté mantener esto lo más autónomo posible, por lo que puse la mayor parte del código para los resultados en la parte inferior del indicador. Los resultados se detienen en la última señal de comercio completada, es decir, una compra tiene una venta. Este es el mismo indicador que publiqué anteriormente con el PCT Trailing StopLoss, por lo que también verá ese código aquí.
Las notas adicionales:
- Los resultados se encuentran dentro de un margen de error aceptable debido al hecho de que el indicador tiene que calcular en función de cuándo se produce la señal de compra y venta en lugar de cuando se producen las operaciones reales como en la estrategia Backtester
- Estaba tratando de encontrar una manera de establecer el número de señales de compra para usar, es decir, muéstrame los resultados de las últimas 100 operaciones, pero no pude ordenar la lógica. Estoy abierto a sugerencias. También tenga en cuenta que no soy un codificador por profesión, así que si tiene alguna idea en ese frente, por favor expliquémelo como si fuera un niño de 5 años y proporcione ejemplos de código si es posible:)
- Incluí los resultados de la estrategia en las capturas de pantalla para que puedan ver dónde se alinean los resultados. Nota adicional adicional: Esto no es un consejo financiero. Use bajo su propio riesgo.
Prueba posterior
/*backtest
start: 2022-02-16 00:00:00
end: 2022-05-16 00:00:00
period: 1h
basePeriod: 15m
exchanges: [{"eid":"Futures_Binance","currency":"BTC_USDT"}]
*/

// This source code is subject to the terms of the Mozilla Public License 2.0 at https://mozilla.org/MPL/2.0/
// © Thumpyr
//@version=5

/////////////////////////////////////////////////////////////////////////////////////////////
// Comment out Strategy Line and remove // from Indicator line to turn into Indicator  //////
// Do same for alertConidction at bottom                                               //////
/////////////////////////////////////////////////////////////////////////////////////////////
//strategy("Backtesting-Strategy", shorttitle="Backtesting- Strategy", overlay=true, margin_long=100, margin_short=100, default_qty_type=strategy.percent_of_equity,default_qty_value=90, commission_type=strategy.commission.percent, commission_value=.075)
indicator(title="Backtesting- Indicator", shorttitle="Backtesting - Indicator", overlay=true)//


openBalance  =input.float(3000, minval=0, title="Opening Balance:", group="Back Test")
pctAllocated =input.float(.9, minval=0, title="Allocated % (90% = .9):", group="Back Test")
commission   =input.float(.075, minval=0, title="Commission%", group="Back Test")


sellLow=input.float(.035, minval=0, title="Stop Loss Loss: 1% = .01", group="Sell Settings")
trailStopArm=input.float(.0065, minval=0, title="Trailing Stop Arm: 1%=.01", group="Sell Settings")
trailStopPct=input.float(.003, minval=0, title="Trailing Stop Trigger: 1%=.01 ", group="Sell Settings")

/////////////////////////////////////////////////
//               Indicators                    //
/////////////////////////////////////////////////
ema1Len = input.int(14, minval=1, title=" ema 1 Length", group="Trend Line Settings")
ema1Src = input(close, title="ema 1 Source", group="Trend Line Settings")
ema1 = ta.ema(ema1Src, ema1Len)
plot(ema1, title="EMA", color=color.blue)

ema2Len = input.int(22, minval=1, title=" ema 2 Length", group="Trend Line Settings")
ema2Src = input(close, title="ema 2 Source", group="Trend Line Settings")
ema2 = ta.ema(ema2Src, ema2Len)
plot(ema2, title="EMA", color=color.orange)

ema3Len = input.int(200, minval=1, title=" ema 3 Length", group="Trend Line Settings")
ema3Src = input(close, title="ema 2 Source", group="Trend Line Settings")
ema3 = ta.ema(ema3Src, ema3Len)
plot(ema3, title="EMA", color=color.gray)


/////////////////////////////
////   Buy Conditions    ////
/////////////////////////////

alertBuy = ta.crossover(ema1,ema2) and close>ema3

////////////////////////////////////////////////////////////////////
////   Filter redundant Buy Signals if Sell has not happened    ////
////////////////////////////////////////////////////////////////////
var lastsignal = 0
showAlertBuy   = 0
if(alertBuy and lastsignal != 1)
    showAlertBuy           := 1
    lastsignal             := 1
buyAlert= showAlertBuy     > 0

var buyActive = 0
if  buyAlert
    buyActive :=1

//////////////////////////////////////////////////////////////////
////          Track Conditions at buy Signal                  ////
//////////////////////////////////////////////////////////////////

alertBuyValue = ta.valuewhen(buyAlert, close,0)
alertSellValueLow = alertBuyValue - (alertBuyValue*sellLow)

////////////////////////////////////////////////////////////
/////            Trailing Stop                         /////
////////////////////////////////////////////////////////////
var TSLActive       = 0         //Check to see if TSL has been activated
var TSLTriggerValue = 0.0 //Initial and climbing value of TSL
var TSLStop         = 0.0       //Sell Trigger
var TSLRunning      = 0       //Continuously check each bar to raise TSL or not

//  Check if a Buy has been triggered and set initial value for TSL //
if buyAlert
    TSLTriggerValue := alertBuyValue+(alertBuyValue*trailStopArm)
    TSLActive  := 0
    TSLRunning := 1
    TSLStop := TSLTriggerValue - (TSLTriggerValue*trailStopPct)


//  Check that Buy has triggered and if Close has reached initial TSL//
//  Keeps from setting Sell Signal before TSL has been armed w/TSLActive//
beginTrail=TSLRunning==1 and TSLActive==0 and close>alertBuyValue+(alertBuyValue*trailStopArm) and ta.crossover(close,TSLTriggerValue)
if beginTrail
    TSLTriggerValue :=close
    TSLActive :=1
    TSLStop :=TSLTriggerValue - (TSLTriggerValue*trailStopPct)

//  Continuously check if TSL needs to increase and set new value //
runTrail= TSLActive==1 and (ta.crossover(close,TSLTriggerValue) or close>=TSLTriggerValue)
if runTrail
    TSLTriggerValue :=close
    TSLStop :=TSLTriggerValue - (TSLTriggerValue*trailStopPct)

//  Verify that TSL is active and trigger when close cross below TSL Stop//
TSL=TSLActive==1 and (ta.crossunder(close,TSLStop) or (close[1]>TSLStop and close<TSLStop))

// Plot point of inital arming of TSL//
TSLTrigger=TSLActive==1 and TSLActive[1]==0
plotshape(TSLTrigger, title='TSL Armed', location=location.abovebar, color=color.new(color.blue, 0), size=size.small, style=shape.cross, text='TSL Armed')


////////////////////////////////////////////////////////////
/////             Sell Conditions                    ///////
////////////////////////////////////////////////////////////
Sell1 = TSL
Sell2 = ta.crossunder(close,alertSellValueLow)

alertSell = Sell1 or Sell2
////////////////////////////////////////////////////////////

////////////////////////////////////////////////////////////
////        Remove Redundant Signals                    ////
////////////////////////////////////////////////////////////
showAlertSell = 0
if(alertSell and lastsignal != -1)
    showAlertSell           := 1
    lastsignal              := -1
sellAlert= showAlertSell    > 0

if sellAlert
    TSLActive  :=0
    TSLRunning :=0
    buyActive  :=0
/////////////////////////////////////////
//  Plot Buy and Sell Shapes on Chart  //
/////////////////////////////////////////
plotshape(buyAlert,  title='Buy' , location=location.belowbar , color=color.new(color.green, 0), size=size.small , style=shape.triangleup   , text='Buy')
plotshape(sellAlert, title='Sell', location=location.abovebar , color=color.new(color.red, 0)  , size=size.small , style=shape.triangledown , text='Sell')

/////////////////////////////////////////////////////////////////////////////////////////////
//                        Remove // on alertCondition to enable Alerts                     //
/////////////////////////////////////////////////////////////////////////////////////////////
//Alerts
alertcondition(title='Buy Alert', condition=buyAlert, message='Buy Conditions are Met')
alertcondition(title='Sell Alert', condition=sellAlert, message='Sell Conditions are Met')
/////////////////////////////////////////////////////////////////////////////////////////////


////////////////////////////////////////////////////////////
////  Comment out this section if setup as Indicator    ////
////////////////////////////////////////////////////////////
//longCondition = buyAlert
//if (longCondition)
//    strategy.entry("Buy", strategy.long)
//    alert(message='Buy', freq=alert.freq_once_per_bar_close)

//shortCondition = sellAlert
//if (shortCondition)
//    strategy.close_all(sellAlert,"Sell")
//    alert(message='Sell', freq=alert.freq_once_per_bar_close)
/////////////////////////////////////////////////////////////


if buyAlert
    strategy.entry("Enter Long", strategy.long)
else if sellAlert
    strategy.entry("Enter Short", strategy.short)
- Estrategia de negociación basada en cruces de oro y de muerte MACD consecutivos
- Estrategia de negociación mejorada de bandas de Bollinger RSI
- Estrategia de cruce de la EMA triple
- Estrategia de apalancamiento cruzado de promedio móvil exponencial
- Estrategia de media móvil doble GM-8 y ADX
- Estrategia reforzada de cruce de la EMA con el RSI/MACD/ATR
- Tendencia de la puntuación Z siguiendo la estrategia
- La entrada larga en la EMA se cruza con la estrategia de gestión de riesgos
- Estrategia de negociación de VWAP
- WaveTrend Cruza la estrategia de LazyBear
- Estrategia de negociación de AlphaTradingBot
- SSL híbrido
- Salida de la lámpara
- El RISOTTO
- Estrategia intradiaria de la nube de la EMA
- Supertendencia del punto de pivote
- Supertrend+4 en movimiento
- ZigZag basado en el impulso
- VuManChu Cifrado B + Divergencias Estrategia
- Concepto SuperTendencia Doble
- El Super Scalper
- Tendencia
- Es el asesino de los BTC.
- Modelo de alertas de ML
- La progresión de Fibonacci con brechas
- Las operaciones de las entidades de crédito se clasifican en el modelo de referencia.
- Fukuiz Octa-EMA + Ichimoku
- Las entidades de crédito de las entidades de crédito incluidas en el cuadro 1 deberán tener en cuenta los siguientes elementos:
- MACD más inteligente
- Estrategia R5.1 del OCC
- Bienvenido al mercado de osos.