Estrategia de inversión de tendencia basada en bandas de Bollinger

Descripción general
La estrategia se basa en el indicador de la banda de Brin y en las medias móviles para determinar si el precio está cerca de la banda de Brin y para realizar una posición cerrada larga o corta, para obtener ganancias. Cuando el precio rompe la banda de Brin, mira hacia abajo; cuando el precio cae hacia abajo, mira hacia arriba. Combina las ventajas de las dos estrategias de negociación de la reversión de la tendencia y la ruptura, para obtener mejores ganancias cuando la tendencia se tambalea.
El principio
La estrategia se basa en las siguientes dos señales de entrada:
-
Señales múltiples: cuando el precio de cierre toca la línea inferior y el precio de cierre está por encima de la línea media de la EMA, la entidad de la línea K anterior es negativa y la entidad de la línea K actual es positiva.
-
Señales de vacío: cuando el precio de cierre toca la vía superior y el precio de cierre está por debajo de la línea media de la EMA, la entidad de la línea K anterior es la línea positiva y la entidad de la línea K actual es la línea negativa.
Método de stop loss: Stop loss fijo. El punto de stop loss es el precio de entrada a la distancia de la vía oponente por el factor de riesgo de retorno.
Método de paradas: el objetivo es que el ganancia sea la vía de los oponentes. Es decir, hacer más paradas para bajar la vía, hacer paradas en blanco para subir la vía.
Las ventajas
-
La combinación de las ventajas de la tendencia y la estrategia de reversión, es mejor en situaciones de fluctuación de la tendencia.
-
Utiliza el indicador de la banda de Bryn para determinar las zonas de sobreventa y sobrecompra, y las oportunidades de reversión.
-
Los puntos de parada fijos se establecen razonablemente y ayudan a controlar el riesgo.
-
El sistema de suspensión móvil maximiza las ganancias.
El riesgo
-
Las estrategias de ruptura son susceptibles a arbitraje y hay que estar atento a las falsificaciones.
-
Si la situación es demasiado turbulenta, el stop loss puede ser activado con frecuencia.
-
El stop loss fijo no puede ajustarse a las fluctuaciones del mercado y puede ser demasiado flexible o demasiado radical.
-
Si los parámetros de la banda de Bryn no se establecen a tiempo, el resultado puede ser negativo.
Optimización de las ideas
-
Se puede considerar la combinación de indicadores RSI para filtrar las señales de entrada, por ejemplo, RSI superior a 50 para hacer más, RSI inferior a 50 para hacer menos, para evitar señales erróneas.
-
Se añade la función de ajuste automático de la distancia de parada fija para que la parada sea más flexible. Por ejemplo, la distancia de parada se puede ajustar dinámicamente según el indicador ATR.
-
Optimización de los parámetros de la banda de Bryn para encontrar la combinación óptima de parámetros.
-
Se pueden probar diferentes parámetros de la línea media de la EMA para optimizar el efecto de vallado de la línea media.
Resumir
La estrategia tiene en cuenta la tendencia y la reversión, utiliza la banda de Brin para determinar el punto de entrada de compra y venta, y maximiza las ganancias mediante el movimiento del stop. Se desempeña mejor en situaciones de fluctuación de la tendencia.
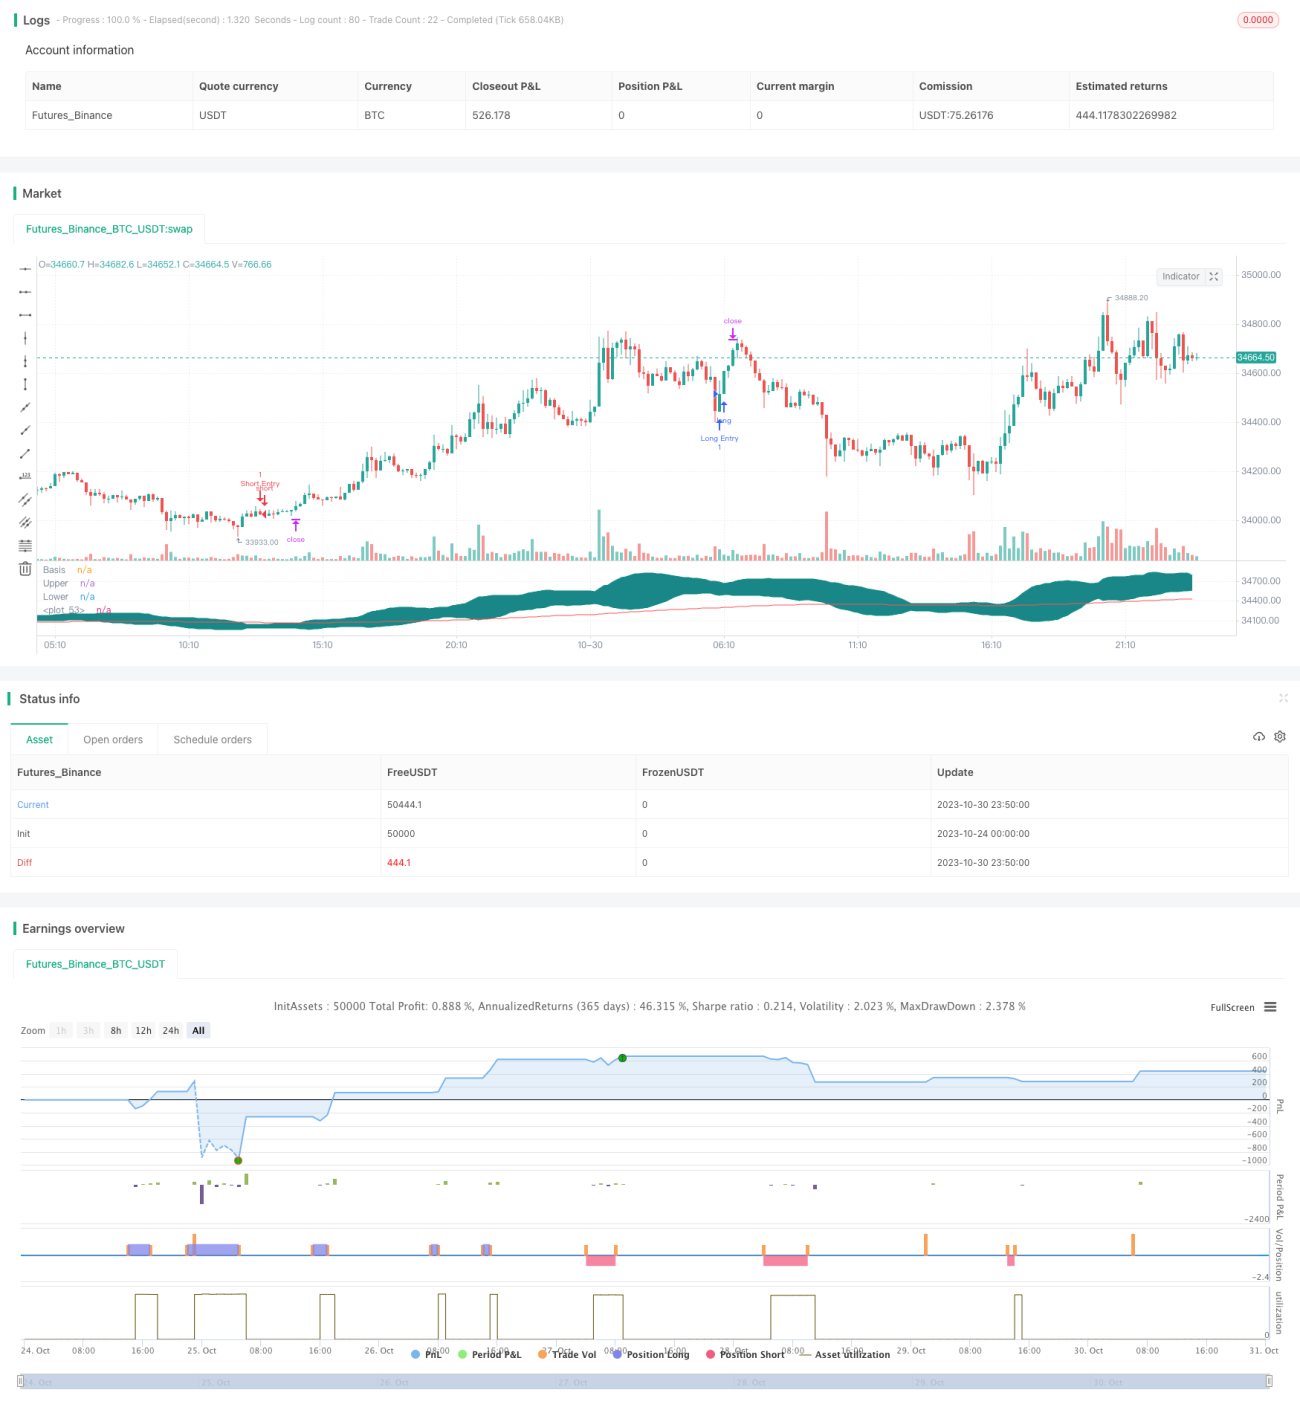
/*backtest
start: 2023-10-24 00:00:00
end: 2023-10-31 00:00:00
period: 10m
basePeriod: 1m
exchanges: [{"eid":"Futures_Binance","currency":"BTC_USDT"}]
*/

//@version=4

// Welcome to yet another script. This script was a lot easier since I was stuck for so long on the Donchian Channels one and learned so much from that one that I could use in this one
// This code should be a lot cleaner compared to the Donchian Channels, but we'll leave that up to the pro's- 1