La stratégie MACD + SMA 200
Auteur:ChaoZhang est là., Date: 2022-05-07 17h13:32Les étiquettes:Le MACD
Il s'agit d'une combinaison de l'indicateur classique MACD (indicateur de divergence de convergence de la moyenne mobile) avec l'indicateur classique SMA à moyenne mobile lente avec la période 200 ensemble comme stratégie.
Cette stratégie va long si l'histogramme MACD et la dynamique MACD sont tous deux au-dessus de zéro et la moyenne mobile MACD rapide est au-dessus de la moyenne mobile MACD lente. En tant que filtre long supplémentaire, le prix récent doit être au-dessus de la SMA 200. Si la logique inverse est vraie, la stratégie va court. Dans le pire des cas, il y a une perte maximale de capital intradien de 50% de filtre.
Économisez 999 $ avec ma stratégie gratuite.
Cette stratégie fonctionne dans le backtest sur le graphique quotidien de Bitcoin, ainsi que sur les graphiques quotidiens du S&P 500 et du Dow Jones Industrial Average. La performance actuelle au 30 novembre 2015 sur le SPX500 CFD quotidien est en pourcentage rentable: 68% depuis 1970 avec un facteur de profit de 6.4.
Toutes les transactions comportent un risque élevé; les performances passées ne sont pas nécessairement indicatives des résultats futurs. Les résultats hypothétiques ou simulés ont certaines limitations inhérentes. Contrairement à un enregistrement de performance réel, les résultats simulés ne représentent pas le trading réel.
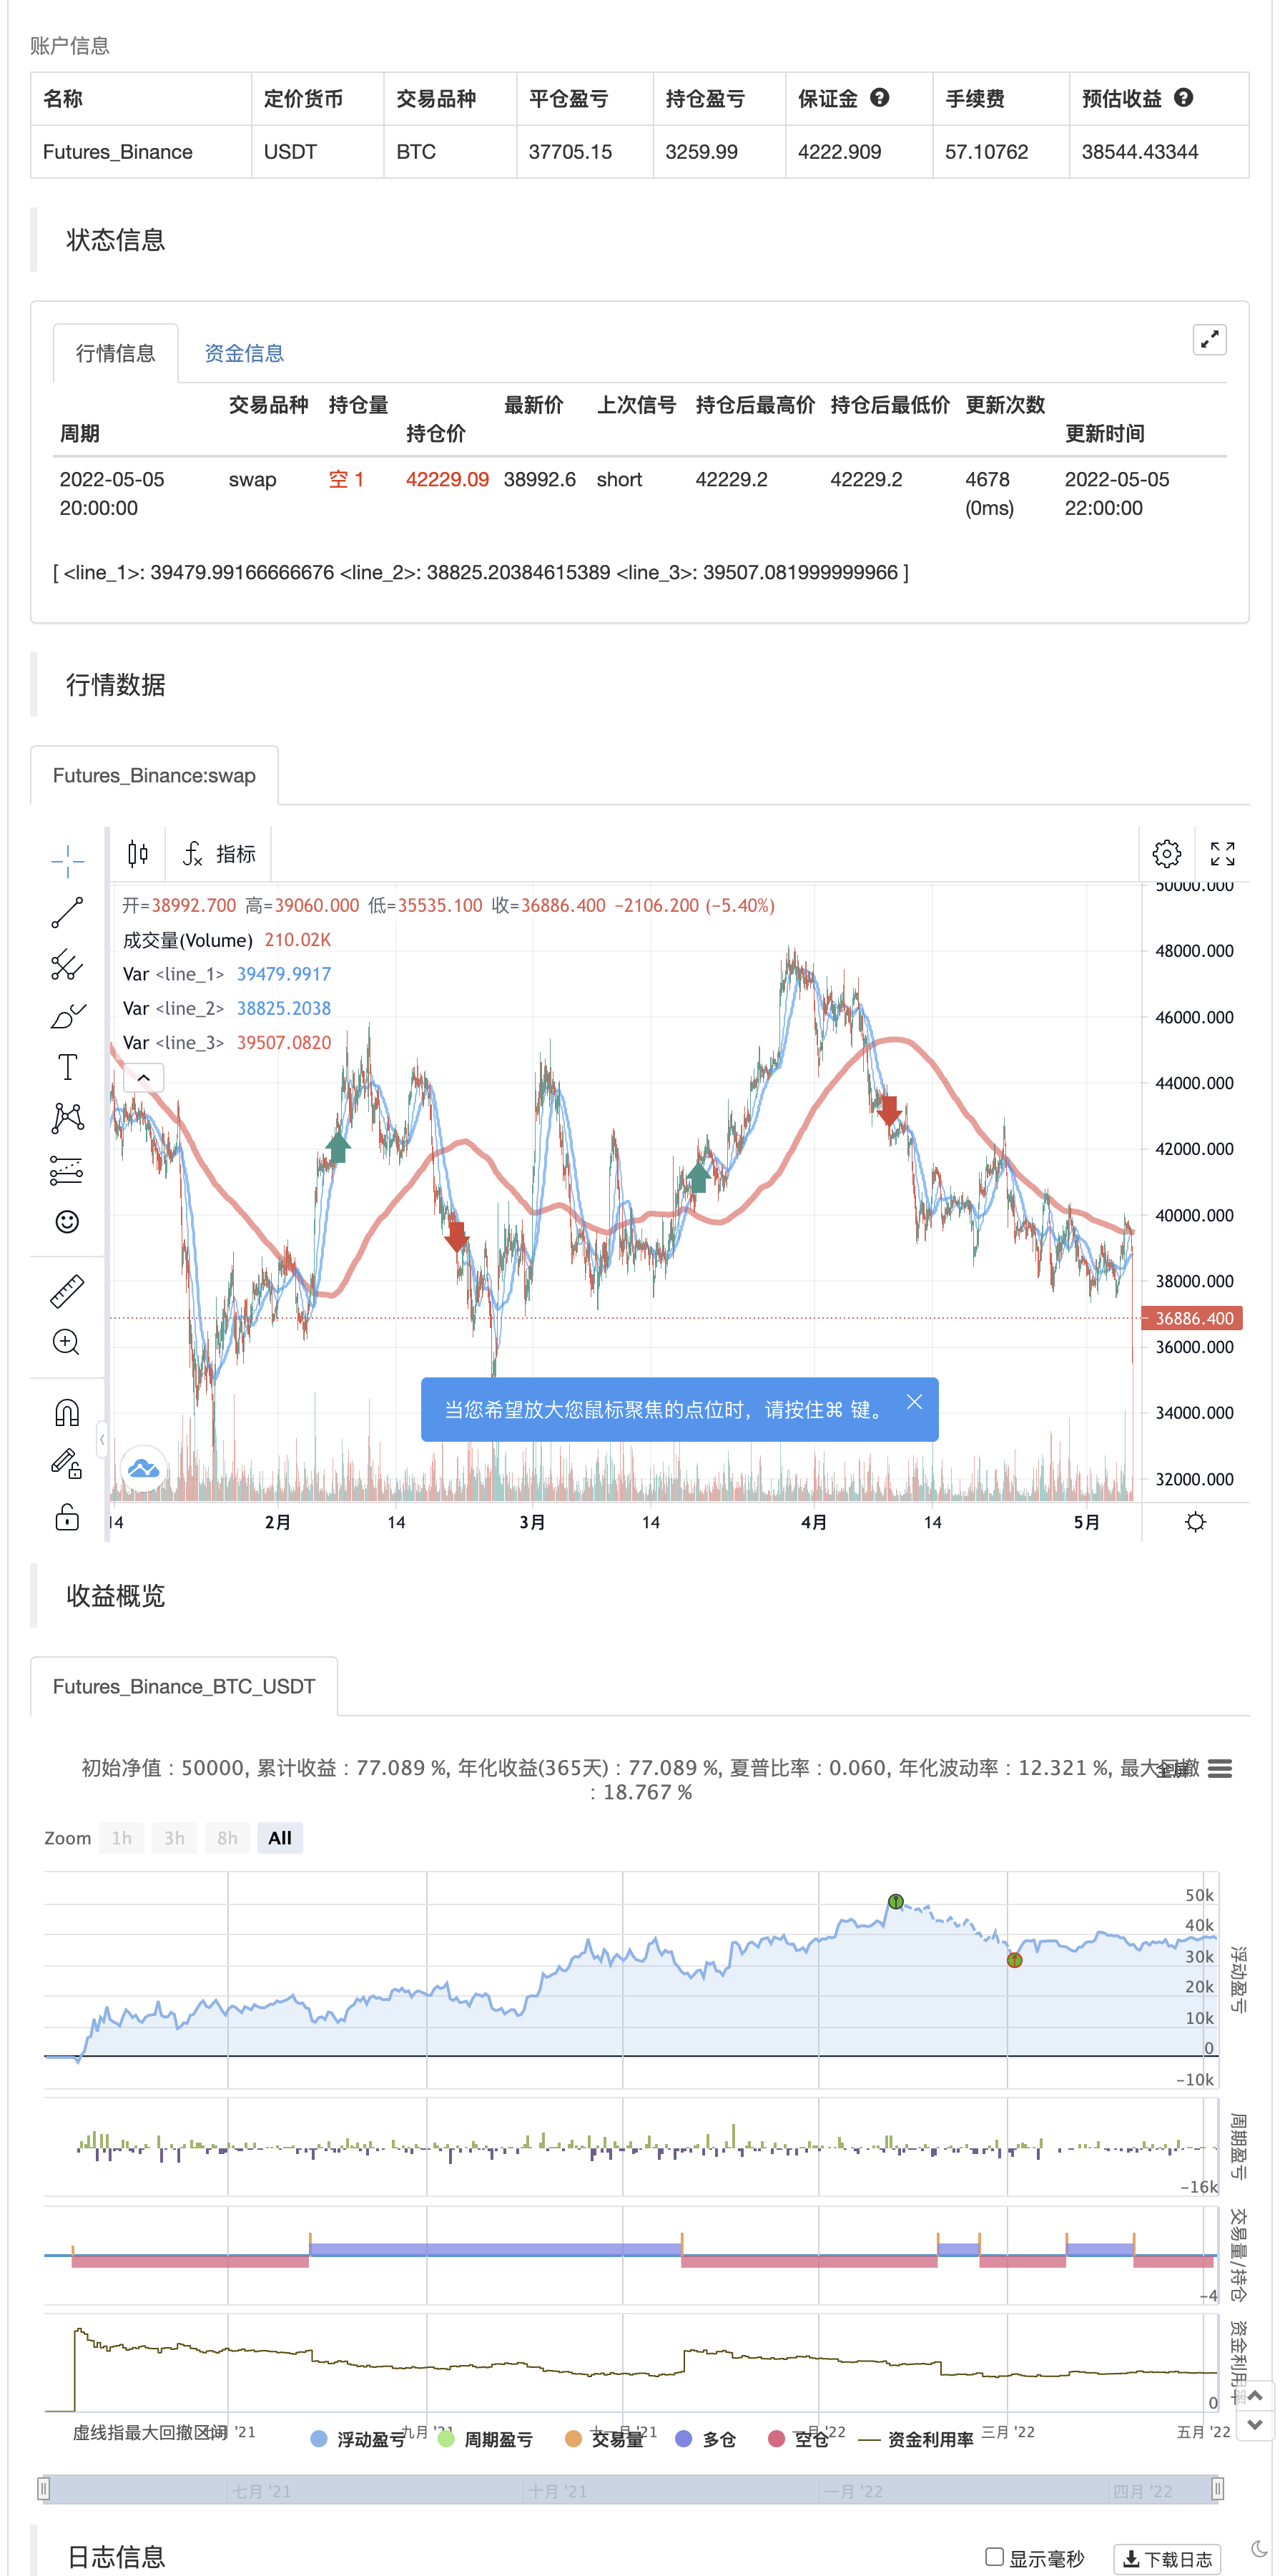
test de retour
/*backtest
start: 2021-05-06 00:00:00
end: 2022-05-05 23:59:00
period: 2h
basePeriod: 15m
exchanges: [{"eid":"Futures_Binance","currency":"BTC_USDT"}]
*/

//@version=2
strategy("MACD + SMA 200 Strategy (by ChartArt)", shorttitle="CA_-_MACD_SMA_strategy", overlay=true)

// ChartArt's MACD + SMA 200 Strategy
//
// Version 1.0
// Idea by ChartArt on November 30, 2015.
//
// Here is a combination of the MACD with the
// slow moving average SMA 200 as a strategy.
//
// This strategy goes long if the MACD histogram
// and the MACD momentum are both above zero and
// the fast MACD moving average is above the
// slow MACD moving average. As additional long filter
// the recent price has to be above the SMA 200.
// If the inverse logic is true, the strategy
// goes short. For the worst case there is a
// max intraday equity loss of 50% filter.


// Input
source = input(close)
fastLength = input(12, minval=1, title="MACD fast moving average")
slowLength=input(26,minval=1, title="MACD slow moving average")
signalLength=input(9,minval=1, title="MACD signal line moving average")
veryslowLength=input(200,minval=1, title="Very slow moving average")
switch1=input(true, title="Enable Bar Color?")
switch2=input(true, title="Enable Moving Averages?")
switch3=input(true, title="Enable Background Color?")

// Calculation
fastMA = ta.sma(source, fastLength)
slowMA = ta.sma(source, slowLength)
veryslowMA = ta.sma(source, veryslowLength)
macd = fastMA - slowMA
signal = ta.sma(macd, signalLength)
hist = macd - signal

// Colors
MAtrendcolor = change(veryslowMA) > 0 ? color.green : color.red
trendcolor = fastMA > slowMA and change(veryslowMA) > 0 and close > slowMA ? color.green : fastMA < slowMA and change(veryslowMA) < 0 and close < slowMA ? color.red : color.blue
bartrendcolor = close > fastMA and close > slowMA and close > veryslowMA and change(slowMA) > 0 ? color.green : close < fastMA and close < slowMA and close < veryslowMA and change(slowMA) < 0 ? color.red : color.blue
backgroundcolor = slowMA > veryslowMA and crossover(hist, 0) and macd > 0 and fastMA > slowMA and close[slowLength] > veryslowMA ? color.green : slowMA < veryslowMA and crossunder(hist, 0) and macd < 0 and fastMA < slowMA and close[slowLength] < veryslowMA ? color.red : na
//bgcolor(switch3?backgroundcolor:na,transp=80)
//barcolor(switch1?bartrendcolor:na)

// Output
F=plot(switch2?fastMA:na,color=trendcolor)
S=plot(switch2?slowMA:na,color=trendcolor,linewidth=2)
V=plot(switch2?veryslowMA:na,color=MAtrendcolor,linewidth=4)
//fill(F,V,color=gray)

// Strategy
buyprice = low
sellprice = high
cancelLong = slowMA < veryslowMA
cancelShort = slowMA > veryslowMA


if crossover(hist, 0) and macd > 0 and fastMA > slowMA and close[slowLength] > veryslowMA
    strategy.entry("MACDLE", strategy.long, stop=buyprice, comment="Bullish")

else if crossunder(hist, 0) and macd < 0 and fastMA < slowMA and close[slowLength] < veryslowMA
    strategy.entry("MACDSE", strategy.short, stop=sellprice, comment="Bearish")

//maxIdLossPcnt = input(50, "Max Intraday Loss(%)", type=float)
//strategy.risk.max_intraday_loss(maxIdLossPcnt, strategy.percent_of_equity)

//plot(strategy.equity, title="equity", color=red, linewidth=2, style=areabr)
- Le MACD RSI Ichimoku est une tendance de dynamique à la suite d'une longue stratégie.
- Stratégie de négociation basée sur les croisements consécutifs MACD or et mort
- La stratégie de croisement renforcée de l'EMA avec le RSI/MACD/ATR
- Stratégie de négociation à long terme combinée MACD et RSI
- Stratégie de combinaison de plusieurs indicateurs (CCI, DMI, MACD, ADX)
- Tendance multi-indicateurs à la suite de la stratégie
- La stratégie à court terme hybride CCI, DMI et MACD
- Théorie des ondes d'Elliott 4-9 Détection automatique des ondes d'impulsion Stratégie de trading
- MACD Stratégie de la croix d'or et de la croix de la mort
- La stratégie MACD-V et Fibonacci pour la prise de profit dynamique sur plusieurs délais
- Stratégie de rupture du MACD BB
- La stratégie de fluctuation facile de Shinto en version en pin
- 3EMA + Boullinger + PIVOT
- Baguette à base de grains multiples
- La machine à meuler
- Indicateur d'inversion de K I
- Des bougies engloutissantes
- L' empereur est incapable de
- Points de retournement de Demark
- Modèles d'altitude et de baisse et de bougies
- TMA surchargée
- Système de tir à la fronde CM
- Bollinger + RSI, stratégie double v1.1
- Stratégie des bandes de Bollinger
- Traqueur de tendance optimisé
- Retours mensuels dans les stratégies PineScript
- ADX et DI pour v4
- MacD Indicateur personnalisé - Cadre de temps multiples + Toutes les options disponibles!
- Indicateur: oscillateur de tendance d'onde
- Indicateur de momentum de compression
- AlphaTrend