Williams %R - Lissé
Auteur:ChaoZhang est là., Date: 2022-05-09 12:04:48 Je suis désoléLes étiquettes:La WMALe taux d'intérêt
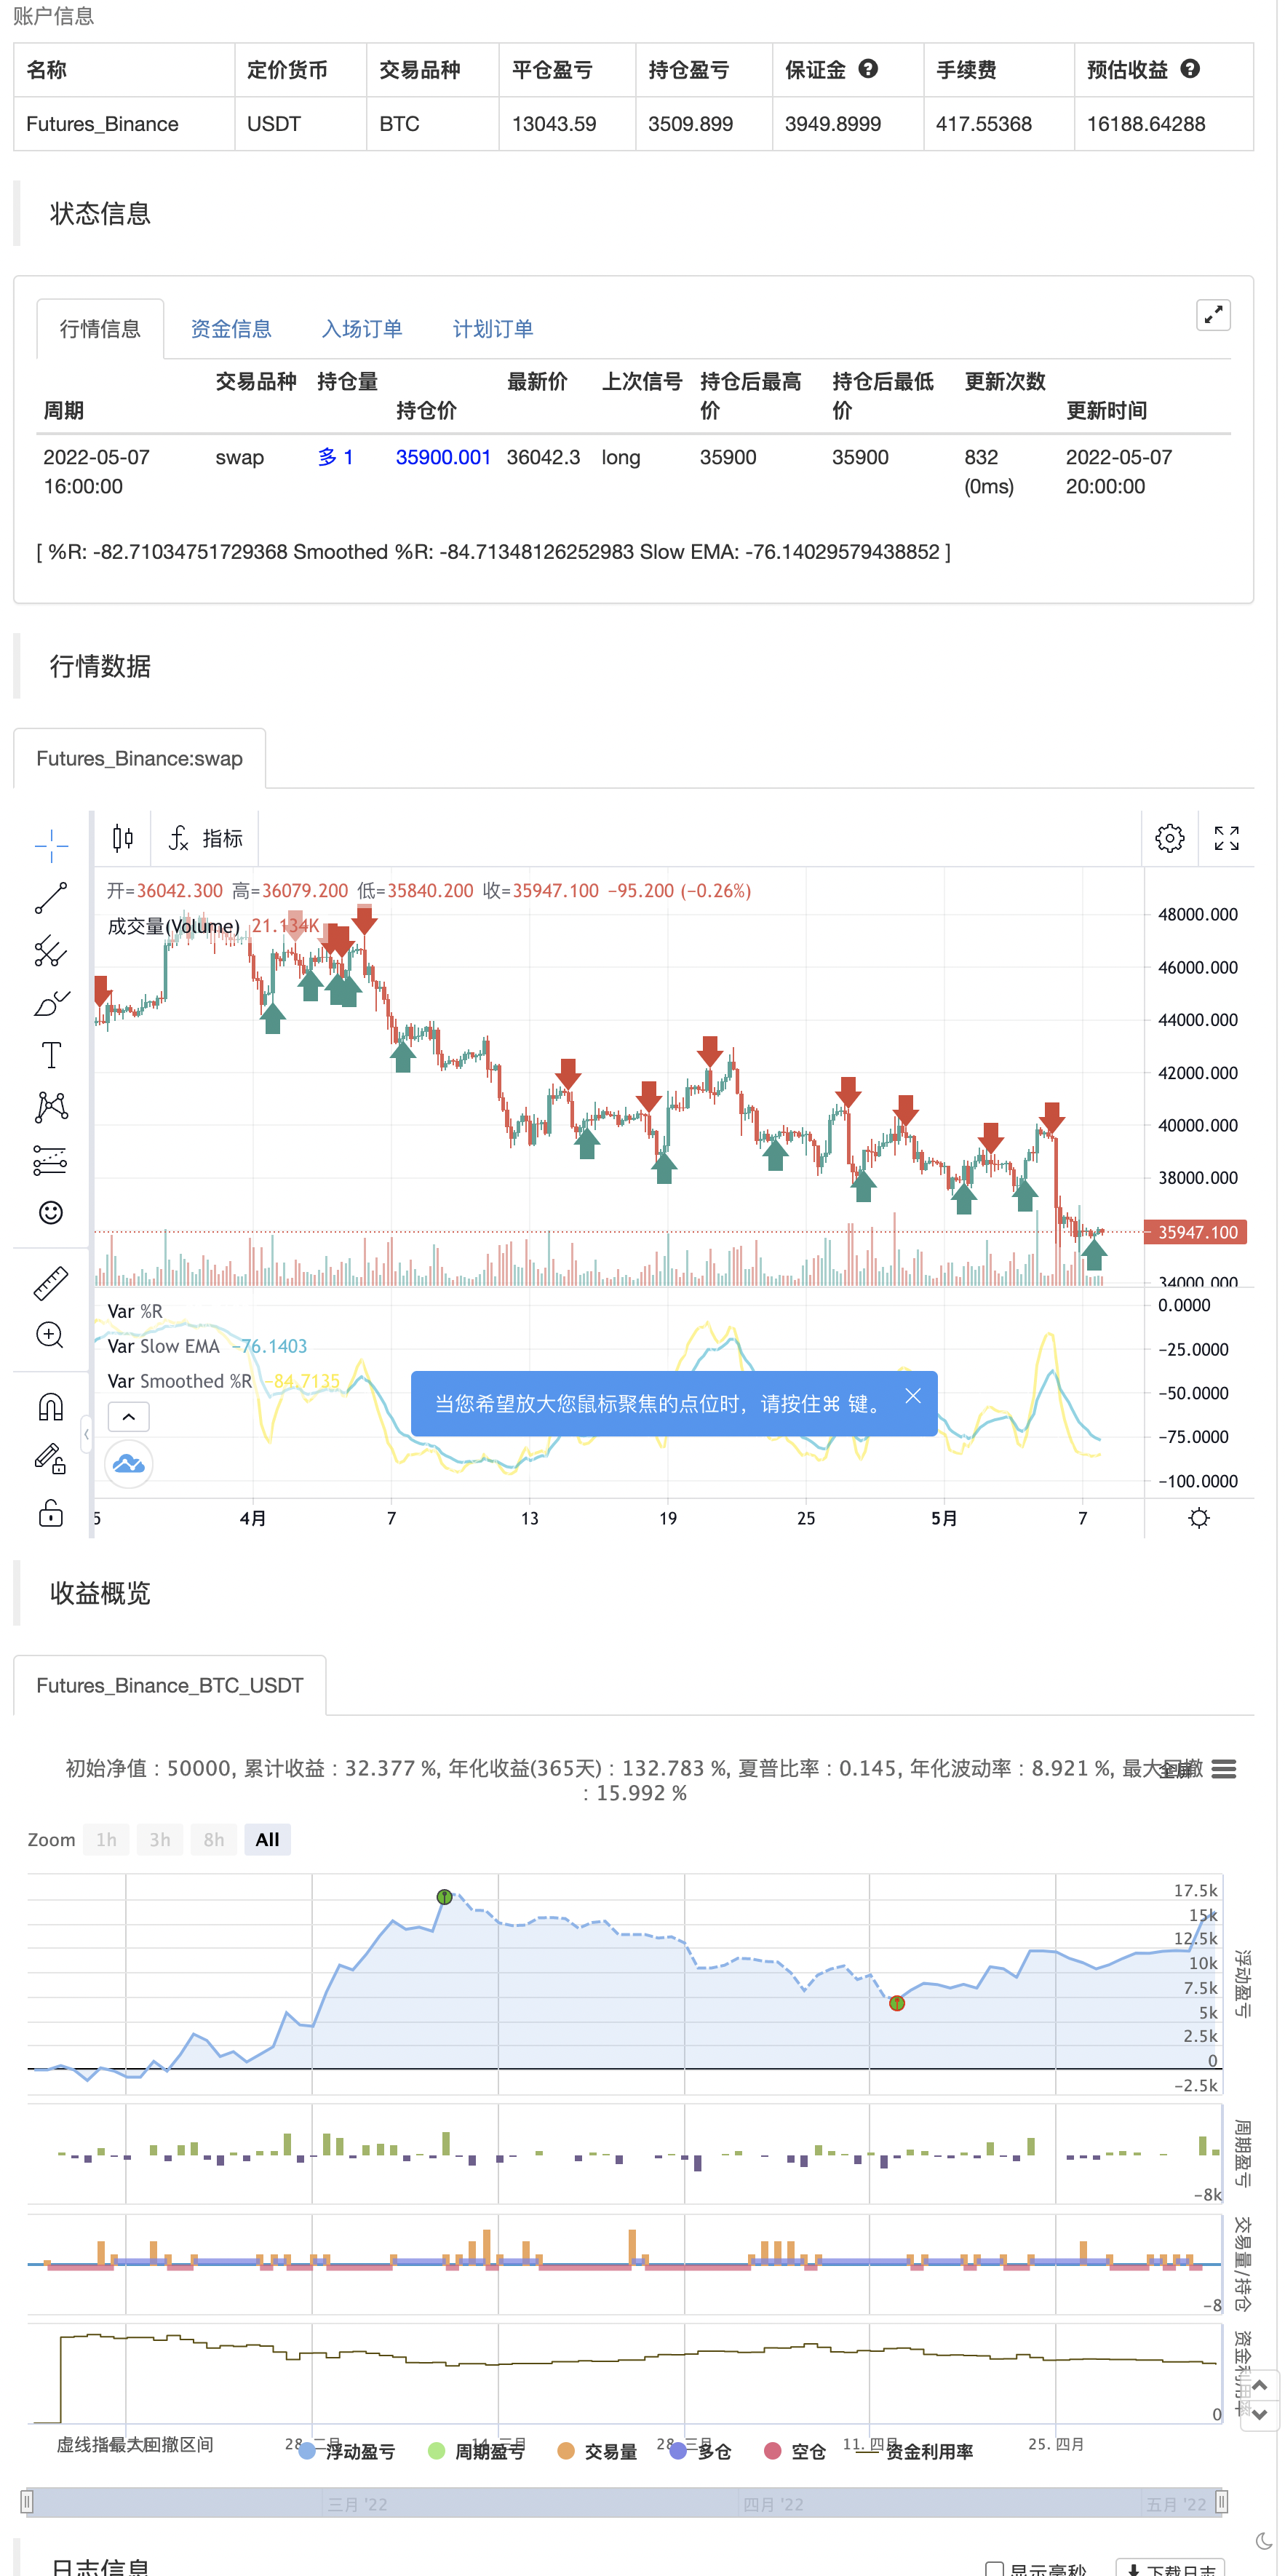
D'après la description de TradingView: Williams %R (%R) est un oscillateur basé sur la dynamique utilisé dans l'analyse technique, principalement pour identifier les conditions de surachat et de survente. Le %R est basé sur une comparaison entre la clôture actuelle et le plus haut pour une période de rétrospective définie par l'utilisateur. %R oscille entre 0 et -100 (notez les valeurs négatives) avec des lectures plus proches de zéro indiquant des conditions de surachat et des lectures plus proches de -100 indiquant une survente.
Qu'est-ce qui est spécial? Cet indicateur ajoute deux lignes EMA supplémentaires à l'indicateur Williams %R d'origine. Cet indicateur comprend:
- les signaux pour les croisements EMA. Les croisements EMA peuvent aider à indiquer des changements de tendance confirmés. Les couleurs par défaut sont le vert et le rouge
- Les couleurs par défaut sont bleu et orange
Alertes disponibles pour les croisements haussiers / baissiers et les retours.
Profitez de~~!
test de retour
/*backtest
start: 2022-02-08 00:00:00
end: 2022-05-08 00:00:00
period: 4h
basePeriod: 15m
exchanges: [{"eid":"Futures_Binance","currency":"BTC_USDT"}]
*/

// This source code is subject to the terms of the Mozilla Public License 2.0 at https://mozilla.org/MPL/2.0/
// © platsn

//@version=5
indicator(title='Williams %R - Smoothed', shorttitle='The Smooth Willy')

// Williams %R
length = input.int(defval=34, minval=1)
upper = ta.highest(length)
lower = ta.lowest(length)

output = 100 * (close - upper) / (upper - lower)

fast_period = input(defval=5, title='Smoothed %R Length')
slow_period = input(defval=13, title='Slow EMA Length')

fast_ema = ta.wma(output,fast_period)
slow_ema = ta.ema(output,slow_period)

// Plot
//h1 = hline(-20, title='Upper Band')
//h2 = hline(-80, title='Lower Band')
//fill(h1, h2, title='Background', transp=90)

plot(output, title='%R', color=color.new(color.white, 80), linewidth=1)
plot(fast_ema, title='Smoothed %R', color=color.new(color.yellow, 0), linewidth=2)
plot(slow_ema, title='Slow EMA', color=color.new(color.aqua, 0), linewidth=2)

bullX = ta.crossover(fast_ema, slow_ema)
bearX = ta.crossunder(fast_ema, slow_ema)
bullreverse = fast_ema[2] > fast_ema[1] and fast_ema > fast_ema[1] and fast_ema < -30
bearreverse = fast_ema[2] < fast_ema[1] and fast_ema < fast_ema[1] and fast_ema > -70

plotX = input.bool(true, "Show EMA Crossovers")
plotRev = input.bool(true, "Show trend reversals")

//plotshape(plotX and bearX ,"Cross down", color=color.red, style=shape.triangledown, location = location.top, size =size.tiny, offset=-1)
//plotshape(plotX and bullX ,"Cross up", color=color.green, style=shape.triangleup, location = location.bottom, size =size.tiny, offset=-1)
//plotshape(plotRev and bearreverse ,"Bear reversal", color=color.orange, style=shape.triangledown, location = location.top, size =size.tiny, offset=-1)
//plotshape(plotRev and bullreverse ,"Bull reversal", color=color.blue, style=shape.triangleup, location = location.bottom, size =size.tiny, offset=-1)

//alertcondition(bearX,"Bearish Crossover", "Bearish cross on William %R")
//alertcondition(bullX,"Bullish Crossover", "Bullish cross on William %R")
//alertcondition(bearreverse,"Bearish Reversal", "Bearish Reversal on William %R")
//alertcondition(bullreverse,"Billish Reversal", "Bullish Reversal on William %R")

if plotRev and bullreverse
    strategy.entry("Enter Long", strategy.long)
else if plotRev and bearreverse
    strategy.entry("Enter Short", strategy.short)
- Stratégie de cryptographie à faible balayage
- Stratégie de négociation quantitative basée sur les moyennes mobiles et les bandes de Bollinger
- Ratio énergie directionnelle accélérée par volume RedK
- HALFTREND + HEMA + SMA (stratégie du faux signal)
- Stratégie Swing Hull/rsi/EMA
- Alerte croisée moyenne mobile (MTF) sur plusieurs délais
- Meilleure stratégie d' engloutissement + de rupture
- RedK double VADER avec barres d'énergie
- Les barres de dynamique REDK
- Oscillateur arc-en-ciel
- Résultats de l'évaluation de la volatilité
- Chande Kroll Arrêtez
- CCI + EMA avec stratégie croisée RSI
- Stratégie de capture de tendance des bandes EMA + leledc + bandes Bollinger
- RSI MTF Ob+Os
- Stratégie MACD Willy
- RSI - Signaux d'achat et de vente
- La tendance de Heikin-Ashi
- HA Préjugés de marché
- L'oscillateur lisse du nuage Ichimoku
- QQE MOD + SSL hybride + Waddah Attar explosion
- Acheter ou vendre Strat
- Triple Supertrend avec EMA et ADX
- Tom DeMark Carte de chaleur séquentielle
- jma + dwma par grains multicolores
- Le MACD magique
- Z Score avec des signaux
- La stratégie de fluctuation facile de Shinto en version en pin
- 3EMA + Boullinger + PIVOT
- Baguette à base de grains multiples