Bandes de Mobo
Auteur:ChaoZhang est là., Date: le 13 mai 2022 à 14h27Les étiquettes:SMA
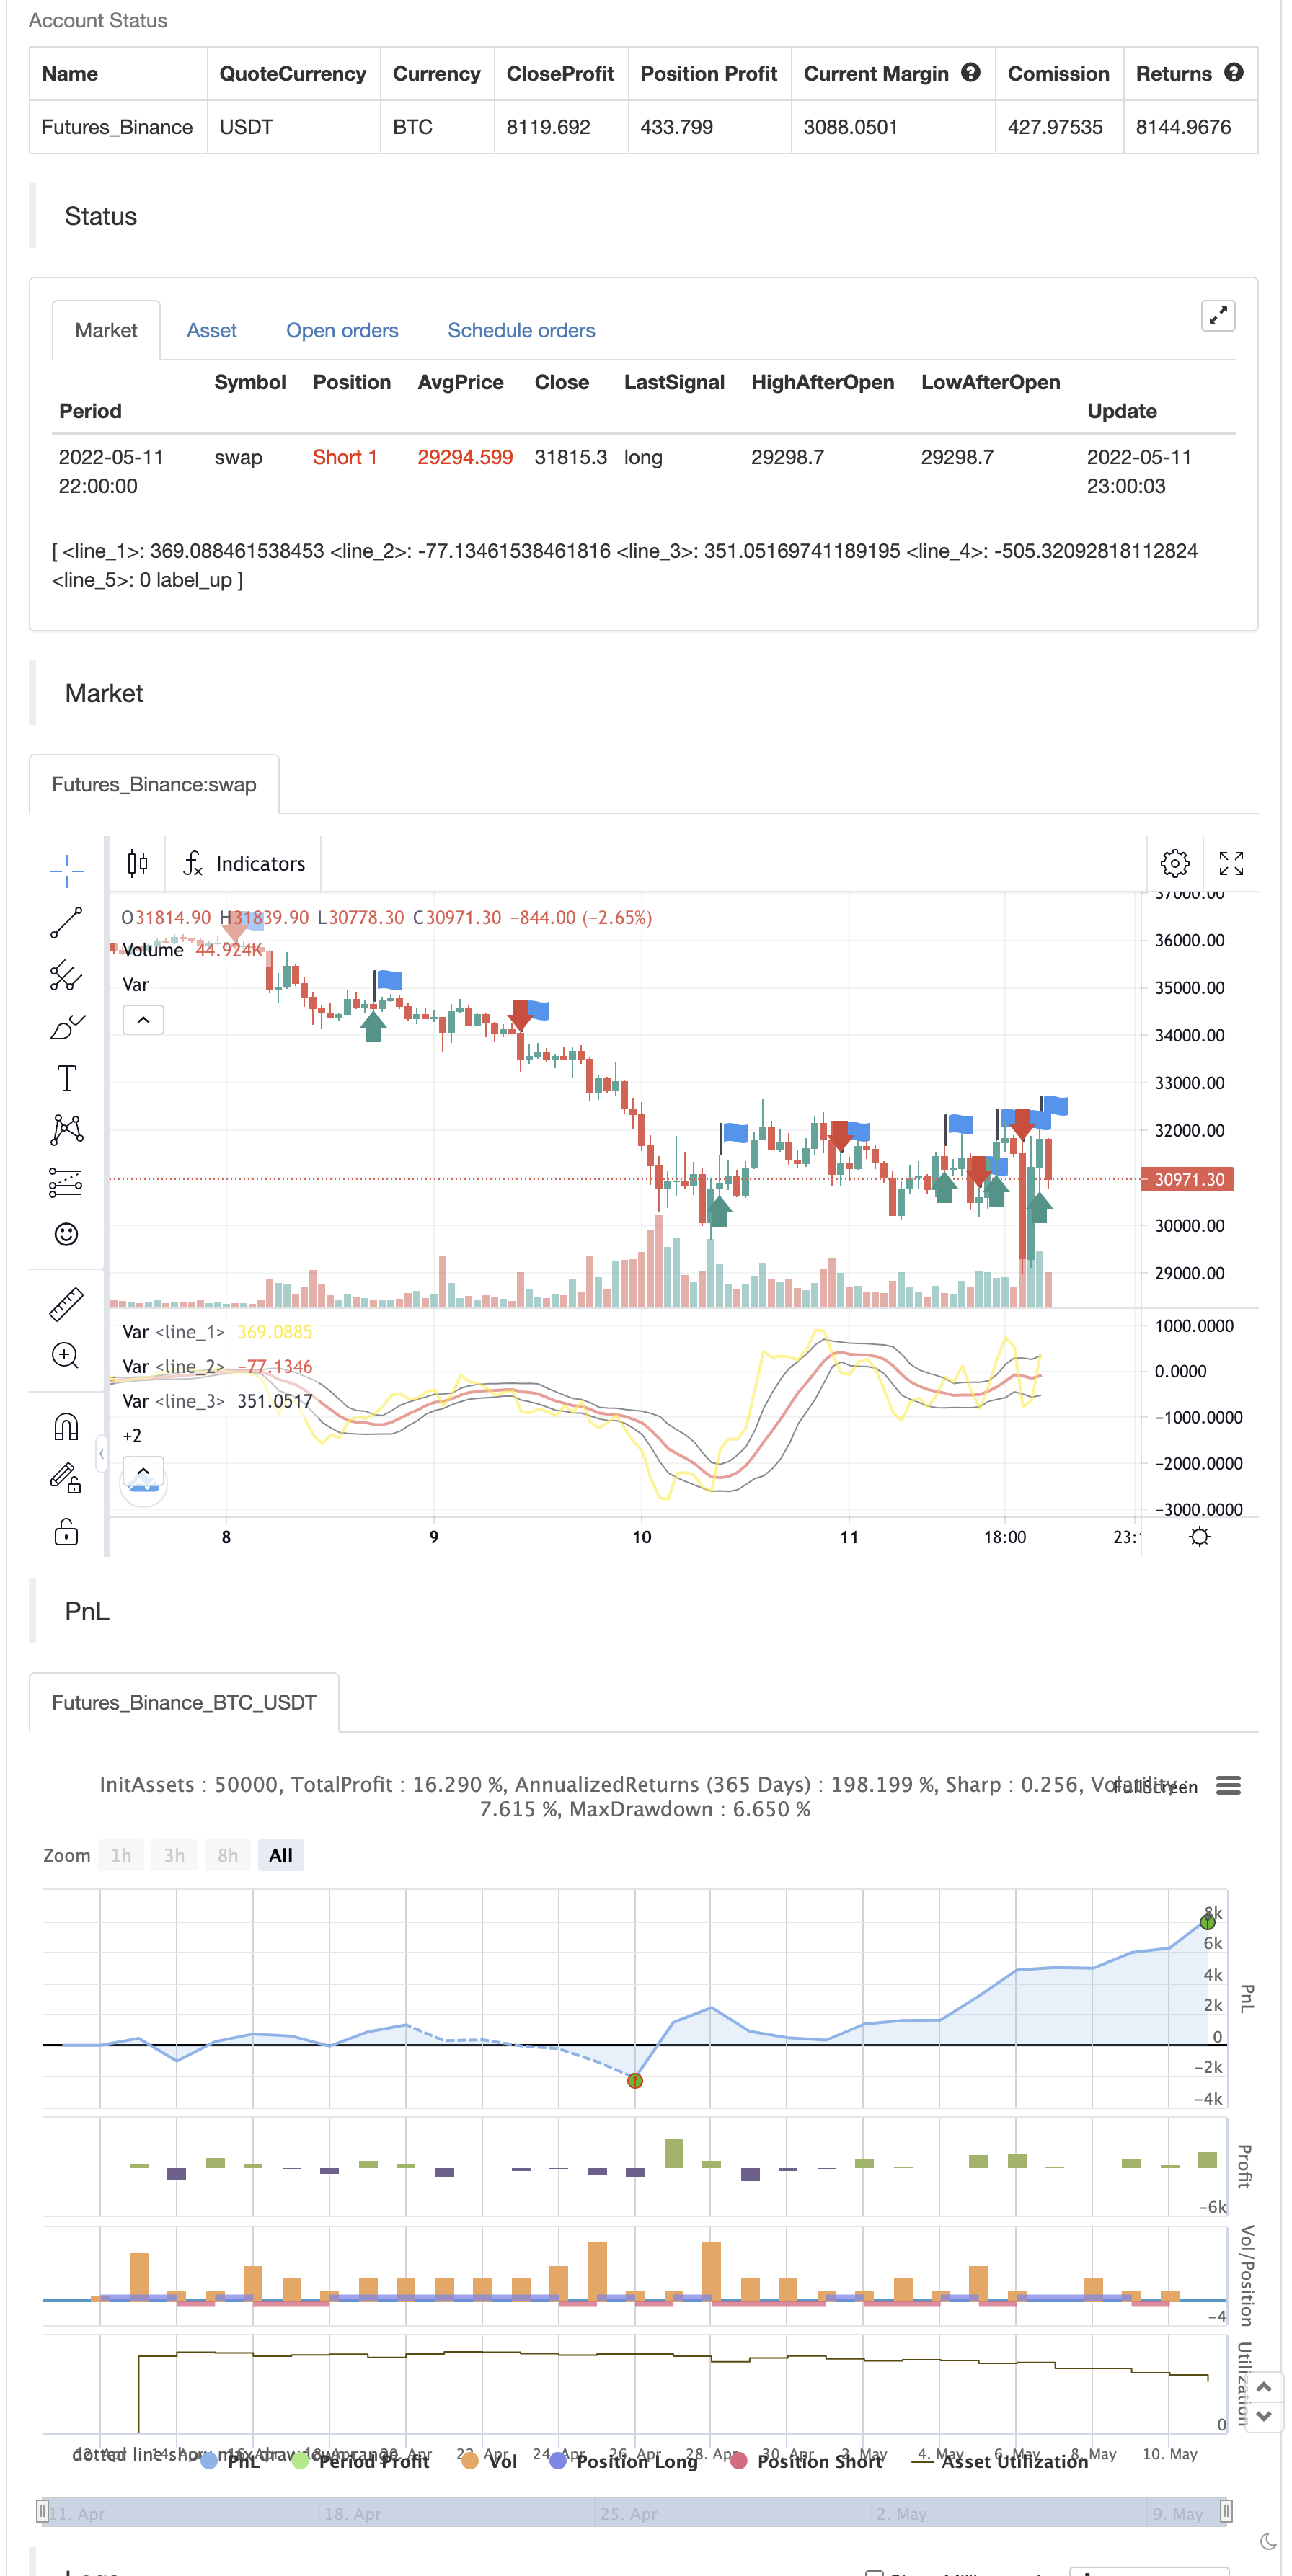
Cet indicateur est les bandes de Mobo (bandes de rupture de momentum). Ces bandes sont des bandes de Bollinger qui ont un écart type ajusté. Il y a des signaux d'achat lorsqu'il a des ruptures de momentum au-dessus des bandes pour les mouvements vers le haut et des signaux de vente lorsqu'il a des ruptures de momentum en dessous des bandes pour les mouvements vers le bas. Les bandes suggèrent simplement que tous les marchés ont des périodes dont nous savons tous qu'elles sont vraies. Alors que le prix est à l'intérieur des bandes, on dit qu'il est sans tendance. Une fois les ruptures survenues, vous pouvez effectuer des transactions dans le sens de la rupture.
test de retour
/*backtest
start: 2022-04-12 00:00:00
end: 2022-05-11 23:59:00
period: 1h
basePeriod: 15m
exchanges: [{"eid":"Futures_Binance","currency":"BTC_USDT"}]
*/

//@version=4
study("Mobo Bands", overlay=false)

price           = input(hl2, "Price")
colorNormLength = input(3, "colorNormLength", input.integer)
dpoLength       = input(13, "dpoLength", input.integer)
moboDisplace    = input(0, "moboDisplace", input.integer)
moboLength    = input(10, "moboLength", input.integer)

numDevDn  = input(-0.8, "numDevDn", input.float)
numDevUp  = input(0.8, "numDevUp", input.float)

coloredMobo     = input(true, "coloredMobo")
coloredFill     = input(true, "coloredFill")
breakArrows     = input(true, "breakArrows")
moboShowMid     = input(true, "moboShowMid")


//def DPO = price - Average(price[DPO_length / 2 + 1], DPO_length);
xsma = sma(price[int(dpoLength / 2 + 1)], dpoLength)
//alert(int(dpoLength / 2 + 1))
//xsma = sma(price, dpoLength)
DPO = price - xsma


Midline = sma(DPO, moboLength)

sDev = stdev(DPO, moboLength)

LowerBand = Midline + numDevDn * sDev
UpperBand = Midline + numDevUp * sDev

plot(DPO, color=color.yellow,linewidth=2)

plot(Midline, color=Midline > Midline[1] ? color.lime : color.red,linewidth=2)

Upper = plot(UpperBand, color=color.black,linewidth=1)
Lower = plot(LowerBand, color=color.black,linewidth=1)

plot(0, color=color.white,linewidth=1)

Signal1 = DPO > UpperBand and DPO[1] < UpperBand[1]
Signal2 = DPO < LowerBand and DPO[1] > LowerBand[1]

wasUp = 1
wasDn = 1

wasUp := Signal1 ? 1 : (Signal2 ? 0 : nz(wasUp[1]))
wasDn := Signal2 ? 1 : (Signal1 ? 0 : nz(wasDn[1]))

//plotshape(Signal1 and wasDn[1] ? UpperBand : na, style=shape.arrowup, location=location.absolute, size=size.normal, color=color.red)
//plotshape(Signal2 and wasUp[1] ? LowerBand : na, style=shape.arrowdown, location=location.absolute, size=size.normal, color=color.green)

plotshape(Signal1 and wasDn[1] ? UpperBand : na, style=shape.labelup, location=location.absolute, size=size.normal, color=color.green, text="Buy",textcolor=color.white)
plotshape(Signal2 and wasUp[1] ? LowerBand : na, style=shape.labeldown, location=location.absolute, size=size.normal, color=color.red, text="Sell",textcolor=color.white)


//fill(Upper, Lower, color=color.purple)

alertcondition(Signal1 and wasDn[1], "Break Out Arrow", "Break Out Arrow")
alertcondition(Signal2 and wasUp[1], "Break Down Arrow", "Break Down Arrow")


if Signal1 and wasDn[1]
    strategy.entry("Enter Long", strategy.long)
else if Signal2 and wasUp[1]
    strategy.entry("Enter Short", strategy.short)
Relationnée
- Stratégie de double entrée croisée de la moyenne mobile
- Stratégie de croisement des moyennes mobiles
- Stratégie de rupture des bandes de Bollinger
- Stratégie de rupture des bandes de Bollinger par écarts types
- Bollinger Bands Filtrage des écarts types doubles Stratégie de négociation quantitative de 5 minutes
- Stratégie de négociation de Bitcoin, de Binance Coin et d'Ethereum sur plusieurs délais
- MA99 Stratégie tactile et dynamique d'arrêt-perte
- La stratégie de négociation des doubles moyennes mobiles DCA
- RSI2 Stratégie Réversion intradienne Taux de victoire Test de retour
- Les lignes futures de la stratégie de démarcation
- Tendance à la suite d'une stratégie basée sur les signaux croisés OBV et MA
Plus de
- Les phantômes suivent les stratégies de l'entreprise
- Les stratégies de suivi de la tendance fantôme
- Oscillateur arc-en-ciel
- Exemple de dimensionnement des positions de négociation de la courbe des actions
- Une démonstration de KLineChart
- Stratégie de super-tendance à pivot dynamique
- La super tendance de Crodl
- RSI par zdmre
- FTL - Filtre de portée X2 + EMA + UO
- Le BRAHMASTRA
- SAR + 3SMMA avec SL et TP
- Résultats
- Modèle d'alerte de lancement lunaire [indicateur]
- HALFTREND + HEMA + SMA (stratégie du faux signal)
- RSI Divergence avec le pivot, BB, SMA, EMA, SMMA, WMA, VWMA
- RSI et BB et survendus simultanément
- Des bougies Heikin Ashi en roulement
- Combo 2/20 EMA et filtre à bande passante
- Les États membres
- 3EMA