Tests de retour - indicateur
Auteur:ChaoZhang est là., Date: 2022-05-17 13:59:05 La date est fixée àLes étiquettes:Le taux d'intérêt
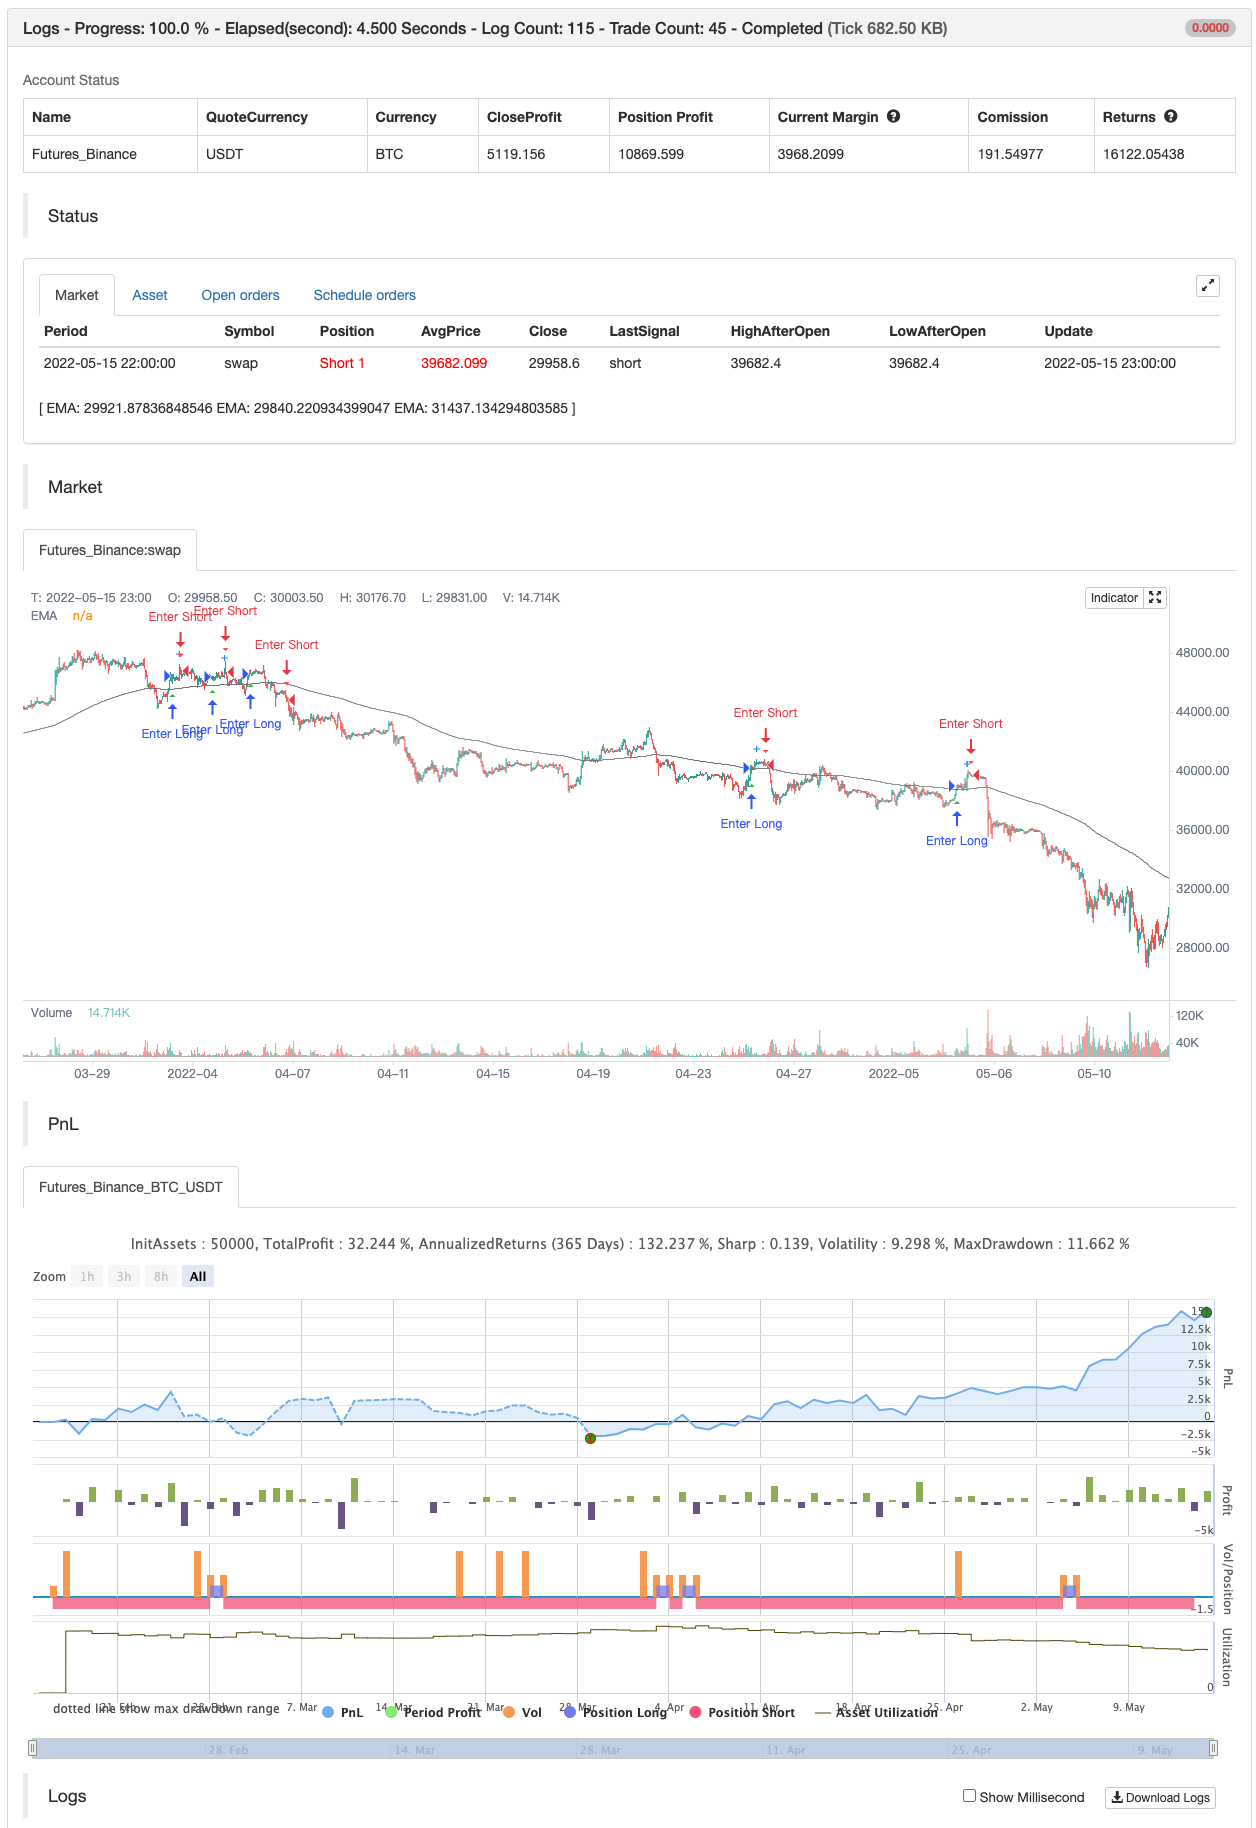
Pour toute personne intéressée, voici un exemple de la façon de mettre les résultats de backtesting dans un indicateur. Cela calcule les mêmes valeurs que vous trouverez dans l'écran de résumé du backtester de stratégie intégré. Cela utilisera la même taille de résultat que le backtester standard, c'est-à-dire que le graphique de 5 minutes récupère environ 1 mois de données, le graphique de 1 minute récupère 1 semaine de données, etc... J'ai essayé de garder cela aussi autonome que possible, alors j'ai mis la plupart du code pour les résultats dans le bas de l'indicateur. Les résultats s'arrêtent au dernier signal commercial terminé, c'est-à-dire qu'un achat a une vente. C'est le même indicateur que j'ai publié plus tôt avec le PCT Trailing StopLoss, vous verrez donc ce code ici aussi. Comme je l'ai dit dans mon article précédent, l'indicateur n'est qu'un simple EMA pour lui donner quelque chose d'utile et je ne recommande pas d'utiliser cet indicateur sur
Note complémentaire:
- Les résultats se situent dans une marge d'erreur acceptable en raison du fait que l'indicateur doit calculer en fonction du moment où le signal d'achat et de vente se produit, par opposition au moment où les transactions réelles se produisent comme dans le Backtester de stratégie.
- J'essayais de trouver un moyen de définir le nombre de signaux d'achat à utiliser, c'est-à-dire de me montrer les résultats des 100 dernières transactions, mais je n'ai pas pu trier la logique. Je suis ouvert aux suggestions. Gardez également à l'esprit que je ne suis pas un codeur de profession, donc si vous avez des idées sur ce front, veuillez m'expliquer comme si j'étais un enfant de 5 ans et fournir des exemples de code si possible:)
- J'ai inclus les résultats de la Stratégie dans les captures d'écran pour que vous puissiez voir où les résultats se rangent. Note complémentaire complémentaire: Ce n'est pas un conseil financier, utilisez-le à vos risques et périls.
test de retour
/*backtest
start: 2022-02-16 00:00:00
end: 2022-05-16 00:00:00
period: 1h
basePeriod: 15m
exchanges: [{"eid":"Futures_Binance","currency":"BTC_USDT"}]
*/

// This source code is subject to the terms of the Mozilla Public License 2.0 at https://mozilla.org/MPL/2.0/
// © Thumpyr
//@version=5

/////////////////////////////////////////////////////////////////////////////////////////////
// Comment out Strategy Line and remove // from Indicator line to turn into Indicator  //////
// Do same for alertConidction at bottom                                               //////
/////////////////////////////////////////////////////////////////////////////////////////////
//strategy("Backtesting-Strategy", shorttitle="Backtesting- Strategy", overlay=true, margin_long=100, margin_short=100, default_qty_type=strategy.percent_of_equity,default_qty_value=90, commission_type=strategy.commission.percent, commission_value=.075)
indicator(title="Backtesting- Indicator", shorttitle="Backtesting - Indicator", overlay=true)//


openBalance  =input.float(3000, minval=0, title="Opening Balance:", group="Back Test")
pctAllocated =input.float(.9, minval=0, title="Allocated % (90% = .9):", group="Back Test")
commission   =input.float(.075, minval=0, title="Commission%", group="Back Test")


sellLow=input.float(.035, minval=0, title="Stop Loss Loss: 1% = .01", group="Sell Settings")
trailStopArm=input.float(.0065, minval=0, title="Trailing Stop Arm: 1%=.01", group="Sell Settings")
trailStopPct=input.float(.003, minval=0, title="Trailing Stop Trigger: 1%=.01 ", group="Sell Settings")

/////////////////////////////////////////////////
//               Indicators                    //
/////////////////////////////////////////////////
ema1Len = input.int(14, minval=1, title=" ema 1 Length", group="Trend Line Settings")
ema1Src = input(close, title="ema 1 Source", group="Trend Line Settings")
ema1 = ta.ema(ema1Src, ema1Len)
plot(ema1, title="EMA", color=color.blue)

ema2Len = input.int(22, minval=1, title=" ema 2 Length", group="Trend Line Settings")
ema2Src = input(close, title="ema 2 Source", group="Trend Line Settings")
ema2 = ta.ema(ema2Src, ema2Len)
plot(ema2, title="EMA", color=color.orange)

ema3Len = input.int(200, minval=1, title=" ema 3 Length", group="Trend Line Settings")
ema3Src = input(close, title="ema 2 Source", group="Trend Line Settings")
ema3 = ta.ema(ema3Src, ema3Len)
plot(ema3, title="EMA", color=color.gray)


/////////////////////////////
////   Buy Conditions    ////
/////////////////////////////

alertBuy = ta.crossover(ema1,ema2) and close>ema3

////////////////////////////////////////////////////////////////////
////   Filter redundant Buy Signals if Sell has not happened    ////
////////////////////////////////////////////////////////////////////
var lastsignal = 0
showAlertBuy   = 0
if(alertBuy and lastsignal != 1)
    showAlertBuy           := 1
    lastsignal             := 1
buyAlert= showAlertBuy     > 0

var buyActive = 0
if  buyAlert
    buyActive :=1

//////////////////////////////////////////////////////////////////
////          Track Conditions at buy Signal                  ////
//////////////////////////////////////////////////////////////////

alertBuyValue = ta.valuewhen(buyAlert, close,0)
alertSellValueLow = alertBuyValue - (alertBuyValue*sellLow)

////////////////////////////////////////////////////////////
/////            Trailing Stop                         /////
////////////////////////////////////////////////////////////
var TSLActive       = 0         //Check to see if TSL has been activated
var TSLTriggerValue = 0.0 //Initial and climbing value of TSL
var TSLStop         = 0.0       //Sell Trigger
var TSLRunning      = 0       //Continuously check each bar to raise TSL or not

//  Check if a Buy has been triggered and set initial value for TSL //
if buyAlert
    TSLTriggerValue := alertBuyValue+(alertBuyValue*trailStopArm)
    TSLActive  := 0
    TSLRunning := 1
    TSLStop := TSLTriggerValue - (TSLTriggerValue*trailStopPct)


//  Check that Buy has triggered and if Close has reached initial TSL//
//  Keeps from setting Sell Signal before TSL has been armed w/TSLActive//
beginTrail=TSLRunning==1 and TSLActive==0 and close>alertBuyValue+(alertBuyValue*trailStopArm) and ta.crossover(close,TSLTriggerValue)
if beginTrail
    TSLTriggerValue :=close
    TSLActive :=1
    TSLStop :=TSLTriggerValue - (TSLTriggerValue*trailStopPct)

//  Continuously check if TSL needs to increase and set new value //
runTrail= TSLActive==1 and (ta.crossover(close,TSLTriggerValue) or close>=TSLTriggerValue)
if runTrail
    TSLTriggerValue :=close
    TSLStop :=TSLTriggerValue - (TSLTriggerValue*trailStopPct)

//  Verify that TSL is active and trigger when close cross below TSL Stop//
TSL=TSLActive==1 and (ta.crossunder(close,TSLStop) or (close[1]>TSLStop and close<TSLStop))

// Plot point of inital arming of TSL//
TSLTrigger=TSLActive==1 and TSLActive[1]==0
plotshape(TSLTrigger, title='TSL Armed', location=location.abovebar, color=color.new(color.blue, 0), size=size.small, style=shape.cross, text='TSL Armed')


////////////////////////////////////////////////////////////
/////             Sell Conditions                    ///////
////////////////////////////////////////////////////////////
Sell1 = TSL
Sell2 = ta.crossunder(close,alertSellValueLow)

alertSell = Sell1 or Sell2
////////////////////////////////////////////////////////////

////////////////////////////////////////////////////////////
////        Remove Redundant Signals                    ////
////////////////////////////////////////////////////////////
showAlertSell = 0
if(alertSell and lastsignal != -1)
    showAlertSell           := 1
    lastsignal              := -1
sellAlert= showAlertSell    > 0

if sellAlert
    TSLActive  :=0
    TSLRunning :=0
    buyActive  :=0
/////////////////////////////////////////
//  Plot Buy and Sell Shapes on Chart  //
/////////////////////////////////////////
plotshape(buyAlert,  title='Buy' , location=location.belowbar , color=color.new(color.green, 0), size=size.small , style=shape.triangleup   , text='Buy')
plotshape(sellAlert, title='Sell', location=location.abovebar , color=color.new(color.red, 0)  , size=size.small , style=shape.triangledown , text='Sell')

/////////////////////////////////////////////////////////////////////////////////////////////
//                        Remove // on alertCondition to enable Alerts                     //
/////////////////////////////////////////////////////////////////////////////////////////////
//Alerts
alertcondition(title='Buy Alert', condition=buyAlert, message='Buy Conditions are Met')
alertcondition(title='Sell Alert', condition=sellAlert, message='Sell Conditions are Met')
/////////////////////////////////////////////////////////////////////////////////////////////


////////////////////////////////////////////////////////////
////  Comment out this section if setup as Indicator    ////
////////////////////////////////////////////////////////////
//longCondition = buyAlert
//if (longCondition)
//    strategy.entry("Buy", strategy.long)
//    alert(message='Buy', freq=alert.freq_once_per_bar_close)

//shortCondition = sellAlert
//if (shortCondition)
//    strategy.close_all(sellAlert,"Sell")
//    alert(message='Sell', freq=alert.freq_once_per_bar_close)
/////////////////////////////////////////////////////////////


if buyAlert
    strategy.entry("Enter Long", strategy.long)
else if sellAlert
    strategy.entry("Enter Short", strategy.short)
- Stratégie de négociation basée sur les croisements consécutifs MACD or et mort
- Stratégie de négociation des bandes de Bollinger améliorées RSI
- Stratégie d'échange croisé à trois EMA
- Stratégie d'effet de levier croisé sur la moyenne mobile exponentielle
- Stratégie de moyenne mobile double GM-8 et ADX
- La stratégie de croisement renforcée de l'EMA avec le RSI/MACD/ATR
- La tendance du score Z suivant la stratégie
- L'entrée longue sur l'EMA croise avec la stratégie de gestion des risques
- Stratégie de négociation du VWAP
- La stratégie de WaveTrend Cross LazyBear
- Stratégie de négociation AlphaTradingBot
- SSL hybride
- Sortie du lustre
- Le rizotto
- Stratégie intraday de l'EMA dans le cloud
- Supertendance du point pivot
- Supertrend+4 en mouvement
- ZigZag basé sur l'élan
- VuManChu chiffrement B + stratégie de divergence
- Concept du double SuperTrend
- Super scalper
- Des tendances
- Le tueur de Sma BTC
- Modèle d'alerte ML
- La progression de Fibonacci avec des pauses
- RSI MTF Ob+Os
- Fukuiz Octa-EMA + Ichimoku est une marque américaine.
- Le montant de l'impôt sur les sociétés est calculé à partir de l'impôt sur les sociétés.
- Le MACD est plus intelligent
- Stratégie R5.1 du CCO
- Bienvenue sur le marché aux ours.