विलियम्स %R - चिकनी
लेखक:चाओझांग, दिनांक: 2022-05-09 12:04:48टैगःडब्ल्यूएमएईएमए
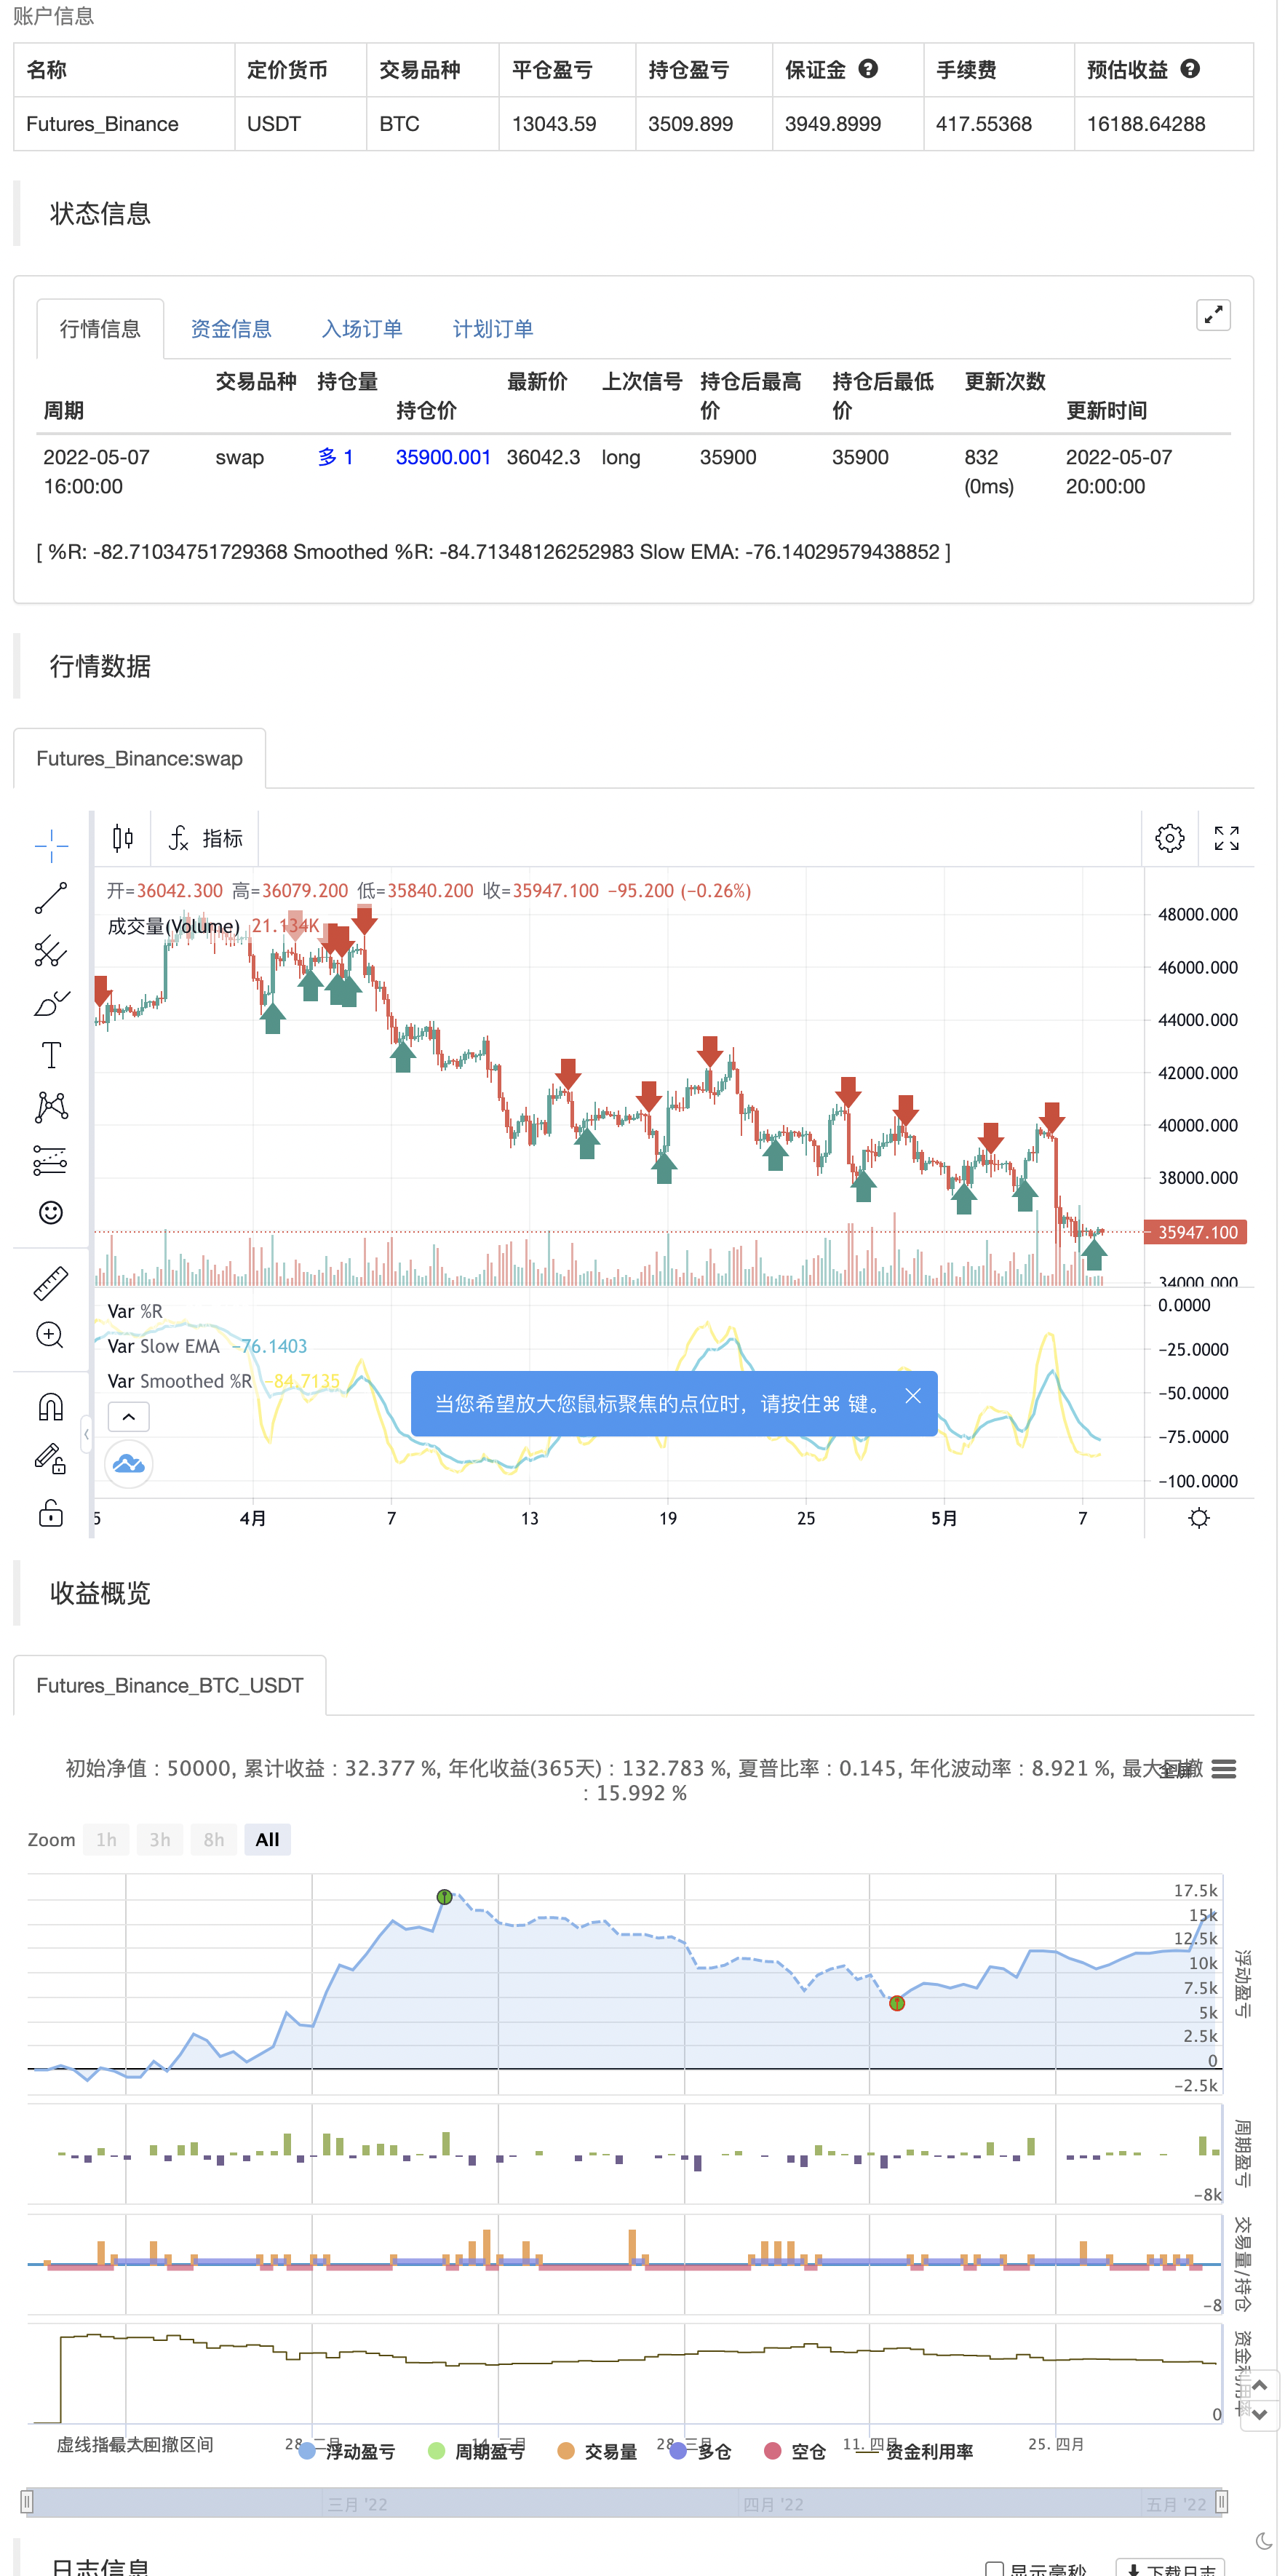
ट्रेडिंगव्यू के विवरण सेः विलियम्स %R (%R) एक गति-आधारित थरथरानवाला है जिसका उपयोग तकनीकी विश्लेषण में मुख्य रूप से ओवरबॉट और ओवरसोल्ड स्थितियों की पहचान करने के लिए किया जाता है। %R उपयोगकर्ता द्वारा परिभाषित बैकपैक अवधि के लिए वर्तमान बंद और उच्चतम उच्च के बीच तुलना पर आधारित है। %R 0 और -100 के बीच थरथरानवाला है (नकारात्मक मानों पर ध्यान दें) शून्य के करीब पढ़ने के साथ अधिक ओवरबोल्ड स्थितियों को इंगित करता है और -100 के करीब पढ़ने से ओवरसोल्ड को इंगित करता है। आमतौर पर %R ओवरबोल्ड और ओवरसोल्ड स्थितियों के साथ-साथ गति में समग्र परिवर्तनों के आधार पर सेटअप उत्पन्न कर सकता है।
क्या खास है? यह संकेतक मूल विलियम्स %R संकेतक के लिए दो अतिरिक्त ईएमए लाइनें जोड़ता है। डिफ़ॉल्ट ईएमए लंबाई 5 और 13 हैं। परिणाम 2 चिकनी औसत लाइनें हैं, जिन्हें पढ़ना आसान है। इस सूचक में निम्नलिखित शामिल हैंः
- ईएमए क्रॉस के लिए संकेत। ईएमए क्रॉस पुष्टि की प्रवृत्ति परिवर्तनों को इंगित करने में मदद कर सकते हैं। डिफ़ॉल्ट रंग हरे और लाल हैं
- तेजी से ईएमए लाइन पर प्रवृत्ति उलट के लिए संकेत. डिफ़ॉल्ट रंग नीले और नारंगी हैं
तेजी/बैरिस क्रॉसओवर और रिवर्स के लिए अलर्ट उपलब्ध हैं।
आनंद लें!
बैकटेस्ट
/*backtest
start: 2022-02-08 00:00:00
end: 2022-05-08 00:00:00
period: 4h
basePeriod: 15m
exchanges: [{"eid":"Futures_Binance","currency":"BTC_USDT"}]
*/

// This source code is subject to the terms of the Mozilla Public License 2.0 at https://mozilla.org/MPL/2.0/
// © platsn

//@version=5
indicator(title='Williams %R - Smoothed', shorttitle='The Smooth Willy')

// Williams %R
length = input.int(defval=34, minval=1)
upper = ta.highest(length)
lower = ta.lowest(length)

output = 100 * (close - upper) / (upper - lower)

fast_period = input(defval=5, title='Smoothed %R Length')
slow_period = input(defval=13, title='Slow EMA Length')

fast_ema = ta.wma(output,fast_period)
slow_ema = ta.ema(output,slow_period)

// Plot
//h1 = hline(-20, title='Upper Band')
//h2 = hline(-80, title='Lower Band')
//fill(h1, h2, title='Background', transp=90)

plot(output, title='%R', color=color.new(color.white, 80), linewidth=1)
plot(fast_ema, title='Smoothed %R', color=color.new(color.yellow, 0), linewidth=2)
plot(slow_ema, title='Slow EMA', color=color.new(color.aqua, 0), linewidth=2)

bullX = ta.crossover(fast_ema, slow_ema)
bearX = ta.crossunder(fast_ema, slow_ema)
bullreverse = fast_ema[2] > fast_ema[1] and fast_ema > fast_ema[1] and fast_ema < -30
bearreverse = fast_ema[2] < fast_ema[1] and fast_ema < fast_ema[1] and fast_ema > -70

plotX = input.bool(true, "Show EMA Crossovers")
plotRev = input.bool(true, "Show trend reversals")

//plotshape(plotX and bearX ,"Cross down", color=color.red, style=shape.triangledown, location = location.top, size =size.tiny, offset=-1)
//plotshape(plotX and bullX ,"Cross up", color=color.green, style=shape.triangleup, location = location.bottom, size =size.tiny, offset=-1)
//plotshape(plotRev and bearreverse ,"Bear reversal", color=color.orange, style=shape.triangledown, location = location.top, size =size.tiny, offset=-1)
//plotshape(plotRev and bullreverse ,"Bull reversal", color=color.blue, style=shape.triangleup, location = location.bottom, size =size.tiny, offset=-1)

//alertcondition(bearX,"Bearish Crossover", "Bearish cross on William %R")
//alertcondition(bullX,"Bullish Crossover", "Bullish cross on William %R")
//alertcondition(bearreverse,"Bearish Reversal", "Bearish Reversal on William %R")
//alertcondition(bullreverse,"Billish Reversal", "Bullish Reversal on William %R")

if plotRev and bullreverse
    strategy.entry("Enter Long", strategy.long)
else if plotRev and bearreverse
    strategy.entry("Enter Short", strategy.short)
- कम स्कैनर रणनीति क्रिप्टो
- चलती औसत और बोलिंगर बैंड पर आधारित मात्रात्मक ट्रेडिंग रणनीति
- RedK वॉल्यूम-एक्सेलेरेटेड दिशात्मक ऊर्जा अनुपात
- HALFTREND + HEMA + SMA (गलत संकेत की रणनीति)
- स्विंग हॉल/आरएसआई/ईएमए रणनीति
- चलती औसत क्रॉस अलर्ट, मल्टी टाइमफ्रेम (MTF)
- बेस्ट एग्लोविंग + ब्रेकआउट रणनीति
- एनर्जी बार के साथ रेडके डुअल वेडर
- रेडके मोमेंटम बार
- इंद्रधनुष दोलन
- बड़े स्नैपर अलर्ट R3.0 + चाइकिंग अस्थिरता की स्थिति + TP RSI
- चंदे क्रॉल स्टॉप
- आरएसआई क्रॉस रणनीति के साथ सीसीआई + ईएमए
- ईएमए बैंड + लेलेडसी + बोलिंगर बैंड ट्रेंड कैचिंग रणनीति
- आरएसआई एमटीएफ ओबी+ओ
- एमएसीडी विली रणनीति
- आरएसआई - खरीदें बेचें संकेत
- हेकिन-अशी प्रवृत्ति
- एचए बाजार पूर्वाग्रह
- इचिमोकू क्लाउड स्मूथ ऑसिलेटर
- क्यूक्यूई एमओडी + एसएसएल हाइब्रिड + वाद्दाह अट्टार विस्फोट
- स्ट्रैट खरीदें/बेचें
- ईएमए और एडीएक्स के साथ ट्रिपल सुपरट्रेंड
- टॉम डेमार्क अनुक्रमिक ताप मानचित्र
- jma + dwma मल्टीग्रेन द्वारा
- मैजिक एमएसीडी
- संकेतों के साथ Z स्कोर
- पाइन भाषा संस्करण
- 3EMA + बोलिंगर + PIVOT
- मल्टीग्रेन द्वारा बैगेट