Pengujian balik- Indikator
Penulis:ChaoZhang, Tanggal: 2022-05-17 13:59:05Tag:EMA
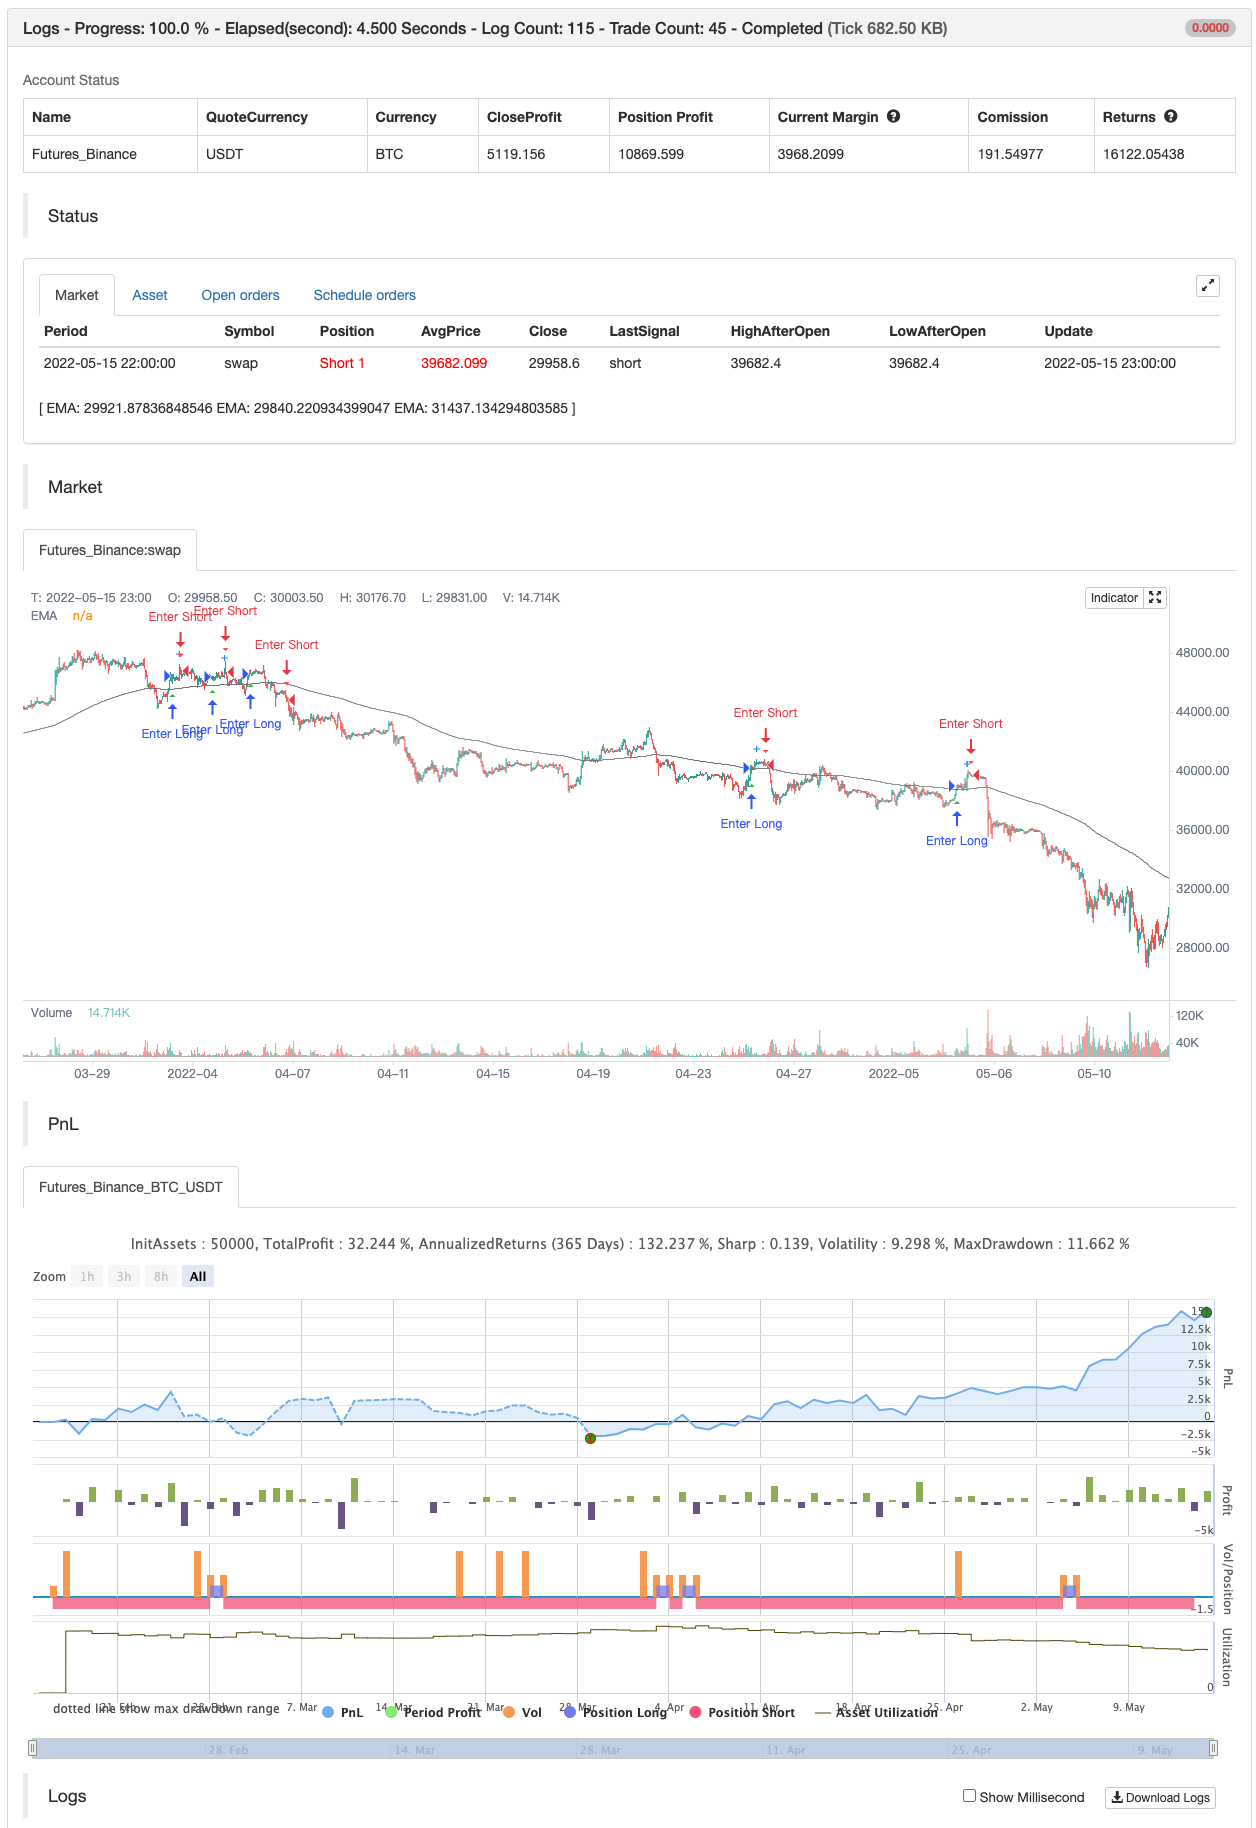
Untuk siapa saja yang tertarik, berikut adalah contoh cara memasukkan hasil backtesting ke dalam indikator. Ini menghitung nilai yang sama seperti yang Anda temukan di Summary Screen dari built-in Strategy backtester. Ini akan menggunakan ukuran hasil yang sama dengan backtester standar yaitu grafik 5 menit mengambil data sekitar 1 bulan, grafik 1 menit mengambil data 1 minggu, dll... Saya mencoba untuk menjaga ini sebagai mandiri mungkin sehingga saya menempatkan sebagian besar kode untuk hasil di bagian bawah indikator. Hasil berhenti pada sinyal perdagangan terakhir yang selesai yaitu beli memiliki jual. Ini adalah indikator yang sama yang saya posting sebelumnya dengan PCT Trailing StopLoss sehingga Anda akan melihat kode di sini juga. Seperti yang saya katakan dalam posting sebelumnya, indikator ini hanya crossover EMA sederhana untuk memberikan sesuatu yang berguna dan saya tidak akan merekomendasikan menggunakan indikator ini pada indikatornya sendiri, tetapi jika Anda ingin menyalinnya, Anda juga dapat menemukan kode yang berguna untuk memverifikasi jika Anda ingin memindahkan kode ke kiri pada indikator Anda sendiri.
Catatan tambahan:
- Hasilnya berada dalam margin kesalahan yang dapat diterima karena fakta bahwa Indikator harus menghitung berdasarkan ketika sinyal Beli dan Jual terjadi sebagai lawan ketika perdagangan yang sebenarnya terjadi seperti dalam Strategi Backtester
- Saya mencoba mencari cara untuk mengatur jumlah sinyal beli untuk digunakan yaitu menunjukkan hasil dari 100 perdagangan terakhir tetapi tidak bisa mengurutkan logika. Saya terbuka untuk saran. Juga ingat bahwa saya bukan seorang coder dengan profesi jadi jika Anda memiliki ide di depan itu, tolong jelaskan kepada saya seolah-olah saya adalah anak berusia 5 tahun dan berikan contoh kode jika memungkinkan :)
- Saya menyertakan hasil Strategi dalam screenshot sehingga Anda dapat melihat di mana hasilnya berbaris. Catatan tambahan tambahan: Ini bukan saran keuangan.
backtest
/*backtest
start: 2022-02-16 00:00:00
end: 2022-05-16 00:00:00
period: 1h
basePeriod: 15m
exchanges: [{"eid":"Futures_Binance","currency":"BTC_USDT"}]
*/

// This source code is subject to the terms of the Mozilla Public License 2.0 at https://mozilla.org/MPL/2.0/
// © Thumpyr
//@version=5

/////////////////////////////////////////////////////////////////////////////////////////////
// Comment out Strategy Line and remove // from Indicator line to turn into Indicator  //////
// Do same for alertConidction at bottom                                               //////
/////////////////////////////////////////////////////////////////////////////////////////////
//strategy("Backtesting-Strategy", shorttitle="Backtesting- Strategy", overlay=true, margin_long=100, margin_short=100, default_qty_type=strategy.percent_of_equity,default_qty_value=90, commission_type=strategy.commission.percent, commission_value=.075)
indicator(title="Backtesting- Indicator", shorttitle="Backtesting - Indicator", overlay=true)//


openBalance  =input.float(3000, minval=0, title="Opening Balance:", group="Back Test")
pctAllocated =input.float(.9, minval=0, title="Allocated % (90% = .9):", group="Back Test")
commission   =input.float(.075, minval=0, title="Commission%", group="Back Test")


sellLow=input.float(.035, minval=0, title="Stop Loss Loss: 1% = .01", group="Sell Settings")
trailStopArm=input.float(.0065, minval=0, title="Trailing Stop Arm: 1%=.01", group="Sell Settings")
trailStopPct=input.float(.003, minval=0, title="Trailing Stop Trigger: 1%=.01 ", group="Sell Settings")

/////////////////////////////////////////////////
//               Indicators                    //
/////////////////////////////////////////////////
ema1Len = input.int(14, minval=1, title=" ema 1 Length", group="Trend Line Settings")
ema1Src = input(close, title="ema 1 Source", group="Trend Line Settings")
ema1 = ta.ema(ema1Src, ema1Len)
plot(ema1, title="EMA", color=color.blue)

ema2Len = input.int(22, minval=1, title=" ema 2 Length", group="Trend Line Settings")
ema2Src = input(close, title="ema 2 Source", group="Trend Line Settings")
ema2 = ta.ema(ema2Src, ema2Len)
plot(ema2, title="EMA", color=color.orange)

ema3Len = input.int(200, minval=1, title=" ema 3 Length", group="Trend Line Settings")
ema3Src = input(close, title="ema 2 Source", group="Trend Line Settings")
ema3 = ta.ema(ema3Src, ema3Len)
plot(ema3, title="EMA", color=color.gray)


/////////////////////////////
////   Buy Conditions    ////
/////////////////////////////

alertBuy = ta.crossover(ema1,ema2) and close>ema3

////////////////////////////////////////////////////////////////////
////   Filter redundant Buy Signals if Sell has not happened    ////
////////////////////////////////////////////////////////////////////
var lastsignal = 0
showAlertBuy   = 0
if(alertBuy and lastsignal != 1)
    showAlertBuy           := 1
    lastsignal             := 1
buyAlert= showAlertBuy     > 0

var buyActive = 0
if  buyAlert
    buyActive :=1

//////////////////////////////////////////////////////////////////
////          Track Conditions at buy Signal                  ////
//////////////////////////////////////////////////////////////////

alertBuyValue = ta.valuewhen(buyAlert, close,0)
alertSellValueLow = alertBuyValue - (alertBuyValue*sellLow)

////////////////////////////////////////////////////////////
/////            Trailing Stop                         /////
////////////////////////////////////////////////////////////
var TSLActive       = 0         //Check to see if TSL has been activated
var TSLTriggerValue = 0.0 //Initial and climbing value of TSL
var TSLStop         = 0.0       //Sell Trigger
var TSLRunning      = 0       //Continuously check each bar to raise TSL or not

//  Check if a Buy has been triggered and set initial value for TSL //
if buyAlert
    TSLTriggerValue := alertBuyValue+(alertBuyValue*trailStopArm)
    TSLActive  := 0
    TSLRunning := 1
    TSLStop := TSLTriggerValue - (TSLTriggerValue*trailStopPct)


//  Check that Buy has triggered and if Close has reached initial TSL//
//  Keeps from setting Sell Signal before TSL has been armed w/TSLActive//
beginTrail=TSLRunning==1 and TSLActive==0 and close>alertBuyValue+(alertBuyValue*trailStopArm) and ta.crossover(close,TSLTriggerValue)
if beginTrail
    TSLTriggerValue :=close
    TSLActive :=1
    TSLStop :=TSLTriggerValue - (TSLTriggerValue*trailStopPct)

//  Continuously check if TSL needs to increase and set new value //
runTrail= TSLActive==1 and (ta.crossover(close,TSLTriggerValue) or close>=TSLTriggerValue)
if runTrail
    TSLTriggerValue :=close
    TSLStop :=TSLTriggerValue - (TSLTriggerValue*trailStopPct)

//  Verify that TSL is active and trigger when close cross below TSL Stop//
TSL=TSLActive==1 and (ta.crossunder(close,TSLStop) or (close[1]>TSLStop and close<TSLStop))

// Plot point of inital arming of TSL//
TSLTrigger=TSLActive==1 and TSLActive[1]==0
plotshape(TSLTrigger, title='TSL Armed', location=location.abovebar, color=color.new(color.blue, 0), size=size.small, style=shape.cross, text='TSL Armed')


////////////////////////////////////////////////////////////
/////             Sell Conditions                    ///////
////////////////////////////////////////////////////////////
Sell1 = TSL
Sell2 = ta.crossunder(close,alertSellValueLow)

alertSell = Sell1 or Sell2
////////////////////////////////////////////////////////////

////////////////////////////////////////////////////////////
////        Remove Redundant Signals                    ////
////////////////////////////////////////////////////////////
showAlertSell = 0
if(alertSell and lastsignal != -1)
    showAlertSell           := 1
    lastsignal              := -1
sellAlert= showAlertSell    > 0

if sellAlert
    TSLActive  :=0
    TSLRunning :=0
    buyActive  :=0
/////////////////////////////////////////
//  Plot Buy and Sell Shapes on Chart  //
/////////////////////////////////////////
plotshape(buyAlert,  title='Buy' , location=location.belowbar , color=color.new(color.green, 0), size=size.small , style=shape.triangleup   , text='Buy')
plotshape(sellAlert, title='Sell', location=location.abovebar , color=color.new(color.red, 0)  , size=size.small , style=shape.triangledown , text='Sell')

/////////////////////////////////////////////////////////////////////////////////////////////
//                        Remove // on alertCondition to enable Alerts                     //
/////////////////////////////////////////////////////////////////////////////////////////////
//Alerts
alertcondition(title='Buy Alert', condition=buyAlert, message='Buy Conditions are Met')
alertcondition(title='Sell Alert', condition=sellAlert, message='Sell Conditions are Met')
/////////////////////////////////////////////////////////////////////////////////////////////


////////////////////////////////////////////////////////////
////  Comment out this section if setup as Indicator    ////
////////////////////////////////////////////////////////////
//longCondition = buyAlert
//if (longCondition)
//    strategy.entry("Buy", strategy.long)
//    alert(message='Buy', freq=alert.freq_once_per_bar_close)

//shortCondition = sellAlert
//if (shortCondition)
//    strategy.close_all(sellAlert,"Sell")
//    alert(message='Sell', freq=alert.freq_once_per_bar_close)
/////////////////////////////////////////////////////////////


if buyAlert
    strategy.entry("Enter Long", strategy.long)
else if sellAlert
    strategy.entry("Enter Short", strategy.short)
- Strategi perdagangan berdasarkan MACD Golden dan Death Crosses berturut-turut
- Strategi Perdagangan RSI Bollinger Bands yang Ditingkatkan
- Triple EMA Crossover Strategi
- Strategi leverage crossover rata-rata bergerak eksponensial
- Strategi GM-8 & ADX Dual Moving Average
- Strategi Crossover EMA yang ditingkatkan dengan RSI/MACD/ATR
- Tren Z-Score Mengikuti Strategi
- Long Entry pada EMA Cross dengan Strategi Manajemen Risiko
- Strategi Perdagangan VWAP
- Strategi WaveTrend Cross LazyBear
- Strategi Perdagangan AlphaTradingBot
- SSL hibrida
- Landelier Exit
- RISOTTO
- EMA Cloud Intraday Strategi
- Titik Pivot Supertrend
- Supertrend+4 bergerak
- ZigZag berdasarkan momentum
- VuManChu Cipher B + Divergences Strategi
- Konsep Dual SuperTrend
- Super Scalper
- Trendycious
- Pembunuh Sma BTC
- Cithakan Alerts ML
- Progressi Fibonacci Dengan Jeda
- RSI MTF Ob+Os
- Fukuiz Octa-EMA + Ichimoku
- CCI MTF Ob+Os
- MACD yang lebih cerdas
- Strategi OCC R5.1
- Selamat datang di BEARMARKET