Strategi pembalikan tren berbasis Bollinger Bands

Ringkasan
Strategi ini didasarkan pada indikator Bollinger Bands dan Moving Averages, yang menentukan apakah harga mendekati Bollinger Bands dan melakukan posisi long atau short ketika harga mendekati Bollinger Bands dan mendapatkan keuntungan. Jika harga menembus Bollinger Bands dan naik ke Bollinger Bands, maka Anda akan melihat ke bawah. Jika harga turun ke Bollinger Bands dan turun ke bawah, maka Anda akan melihat ke bawah.
Prinsip
Strategi ini didasarkan pada dua sinyal masuk:
-
Sinyal multihead: ketika harga close out menyentuh rel bawah, dan harga close out lebih tinggi dari garis rata-rata EMA, entitas garis K sebelumnya adalah garis negatif, entitas garis K saat ini adalah garis positif.
-
Sinyal kosong: Bila harga tutup menyentuh lintasan atas, dan harga tutup berada di bawah garis rata-rata EMA, entitas garis K sebelumnya adalah garis positif, entitas garis K saat ini adalah garis negatif, maka kosonglah.
Metode Stop Loss: Stop loss tetap. Stop loss adalah faktor risiko-reward yang beberapa kali lipat dari harga masuk ke jarak lintasan lawan.
Cara penutupan: Tujuan untuk mendapatkan keuntungan dari lawan. Yaitu melakukan penutupan lebih banyak untuk downrail, melakukan penutupan kosong untuk uprail.
Keunggulan
-
Keuntungan dari kombinasi antara strategi trend dan reversal adalah kinerja yang lebih baik dalam situasi tren yang bergejolak.
-
Menggunakan indikator BRI untuk menilai area overbought dan oversold, dan untuk menentukan peluang reversal.
-
Stop loss tetap diatur secara masuk akal untuk membantu pengendalian risiko.
-
"Mobil Stop" adalah cara untuk memaksimalkan keuntungan.
Risiko
-
Strategi penembusan mudah untuk di-arbitrage, jadi waspadalah terhadap penembusan palsu.
-
Stop loss dapat sering dipicu ketika situasi terlalu kacau.
-
Stop loss tetap tidak dapat disesuaikan dengan fluktuasi pasar dan mungkin terlalu longgar atau terlalu radikal.
-
Jika parameter Brinet tidak disetel pada waktu yang tepat, efeknya mungkin kurang memuaskan.
Optimalkan Pikiran
-
Anda dapat mempertimbangkan untuk memfilter sinyal masuk dengan kombinasi indikator RSI, misalnya RSI lebih tinggi dari 50 dan RSI lebih rendah dari 50 dan RSI lebih rendah dari 50 untuk menghindari sinyal yang salah.
-
Menambahkan fungsi untuk menyesuaikan jarak stop loss secara otomatis, membuat stop loss lebih fleksibel. Misalnya, pengaturan jarak stop loss secara dinamis berdasarkan indikator ATR.
-
Mengoptimalkan parameter Brin, mencari kombinasi parameter terbaik.
-
Anda dapat menguji parameter EMA yang berbeda untuk mengoptimalkan efek pagar di garis rata.
Meringkaskan
Strategi ini secara komprehensif mempertimbangkan tren dan reversal, menggunakan Brin band untuk menentukan overbuy oversell titik masuk, dengan bergerak stop stop untuk memaksimalkan keuntungan. Dalam situasi goyangan tren, kinerja yang lebih baik. Namun, perlu berhati-hati untuk mencegah terjadinya kebocoran, sambil menyesuaikan parameter untuk mengoptimalkan efektivitas strategi. Secara keseluruhan merupakan strategi yang lebih praktis dan efisien.
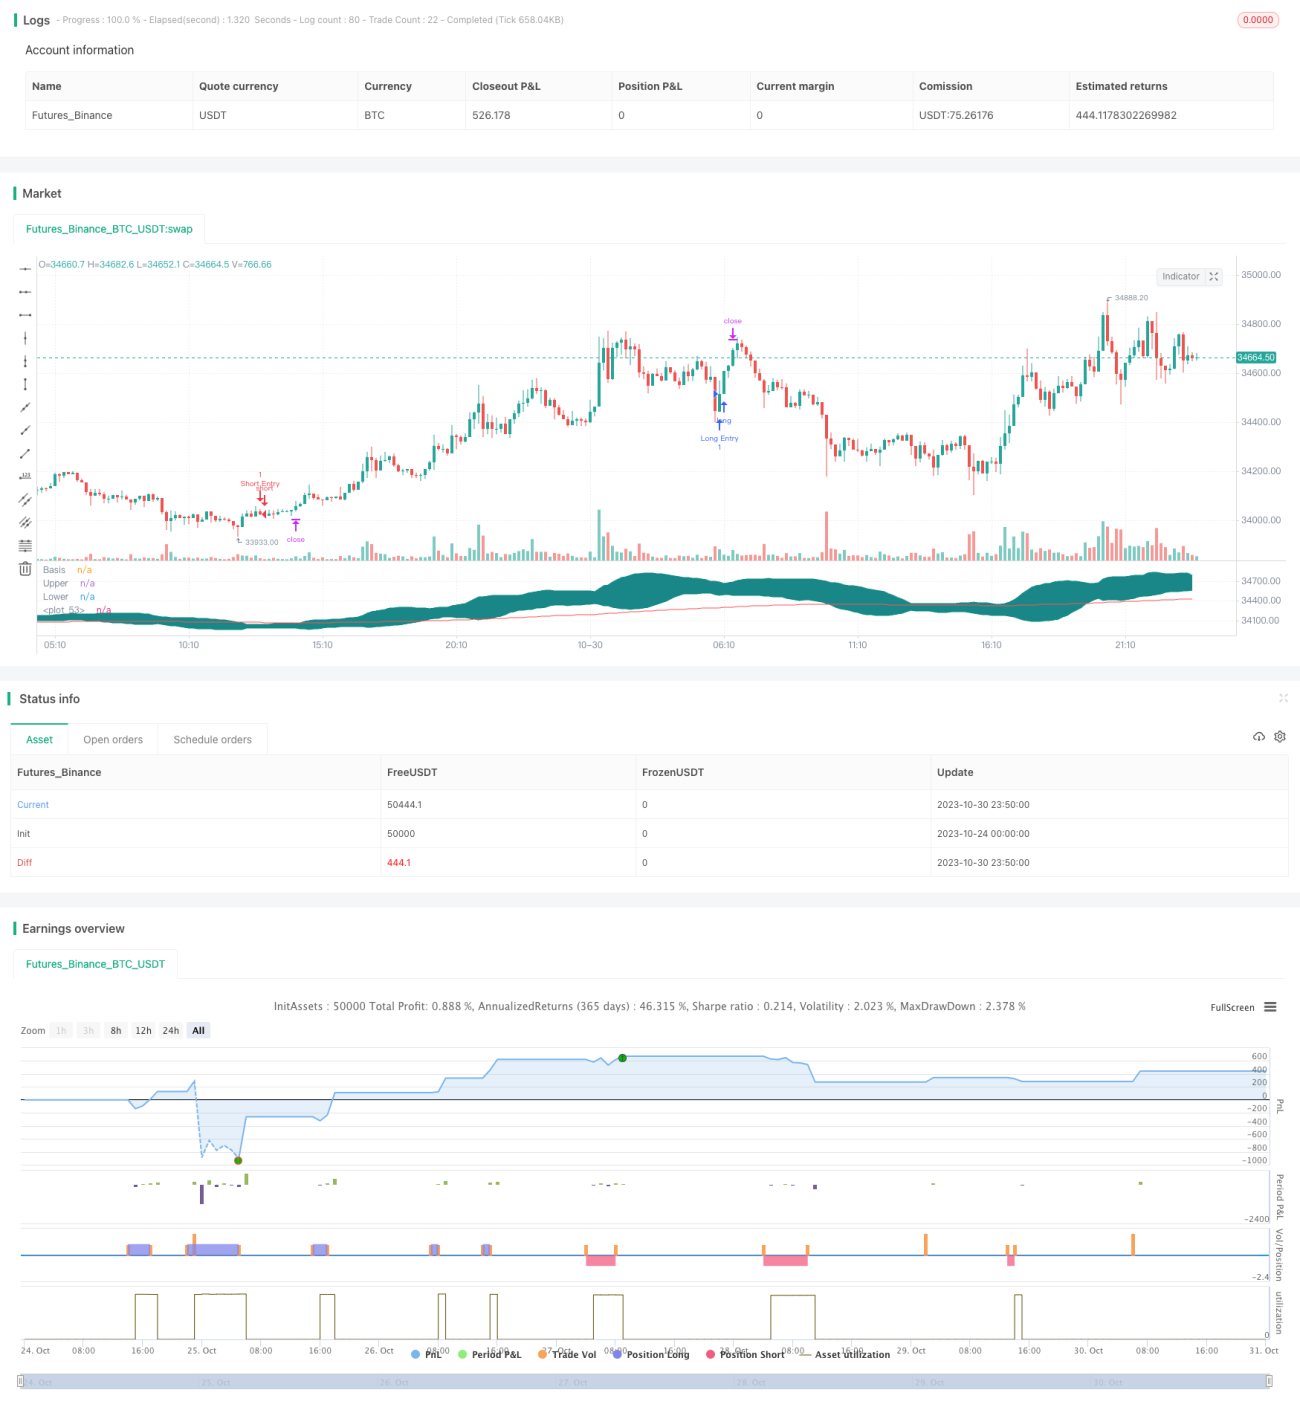
/*backtest
start: 2023-10-24 00:00:00
end: 2023-10-31 00:00:00
period: 10m
basePeriod: 1m
exchanges: [{"eid":"Futures_Binance","currency":"BTC_USDT"}]
*/

//@version=4

// Welcome to yet another script. This script was a lot easier since I was stuck for so long on the Donchian Channels one and learned so much from that one that I could use in this one
// This code should be a lot cleaner compared to the Donchian Channels, but we'll leave that up to the pro's- 1