Strategi Pengujian Ulang Indikator Transformasi Fisher
Ringkasan
Strategi ini adalah strategi feedback berdasarkan indikator konversi Fisher. Formula konversi Fisher dapat mengubah data harga menjadi distribusi normal yang digunakan untuk mengidentifikasi titik-titik harga yang ekstrem dan titik-titik konversi. Strategi ini dikombinasikan dengan indikator konversi Fisher untuk menentukan tren harga dan memungkinkan perdagangan otomatis.
Prinsip Strategi
- Perhitungan indikator HL2
- HL2 dalam periode Length terbaru dihitung dari xMaxH dan xMinL
- Perhitungan indikator konversi Fisher:
- nValue1 adalah 0,33 × (standarisasi HL2) + 0,67 × nValue1 dari periode sebelumnya
- nValue2 membatasi nValue1 antara -0.99 dan 0.99
- Konversi nFish ke fungsi logarithm nValue2
- Periksa apakah nFish positif atau negatif, dan tentukan arah posisi
- Posisi sinyal possig, jika diatur untuk berdagang mundur, posisi akan mundur
- Masuk: possig = 1 melakukan lebih, possig = -1 melakukan kosong
Analisis Keunggulan Strategi
- Indikator Fisher Conversion dapat mengidentifikasi titik-titik tertinggi dan titik-titik terbalik dalam harga dan menentukan tren yang akurat
- Kombinasi dengan indikator HL2 dan getaran penyaring, meningkatkan tingkat kemenangan
- Bisa diatur untuk berdagang mundur, sesuai dengan kondisi pasar yang berbeda
- Otomatisasi transaksi, tanpa penilaian manusia, mengurangi biaya transaksi
Analisis risiko
- Indeks Fisher Conversion Terlambat, Mungkin Melewatkan Perubahan Harga Garis Pendek
- Bencana Gempa Berkekuatan Tinggi
- Pengaturan perdagangan terbalik yang tidak tepat dapat menyebabkan perdagangan yang salah secara sistematis
- Tidak mempertimbangkan verifikasi lintas siklus waktu, ada risiko tertentu untuk positif palsu
Solusi Risiko:
- Menyesuaikan parameter dengan tepat untuk mengurangi latensi
- Meningkatkan Stop Loss, Mengontrol Kerugian Tunggal
- Optimalkan penyaringan reverse trading dengan indikator lain
- Menambahkan beberapa verifikasi seperti tren, tingkat harga, dan bandwidth
Arah optimasi strategi
- Filter indikator tren untuk memastikan konsistensi tren besar
- Menambahkan indikator bandwidth untuk meningkatkan keakuratan penilaian harga
- Verifikasi multi siklus waktu untuk menghindari hasil negatif palsu
- Dinamika penyesuaian stop loss
- Parameter pengoptimalan, kemenangan maksimum dan faktor keuntungan
Strategi optimasi di atas dapat lebih meningkatkan strategi kemenangan, mengunci keuntungan, dan mengendalikan risiko, sehingga menghasilkan hasil perdagangan yang lebih stabil dan efisien.
Meringkaskan
Strategi Fisher Conversion Indicator Retracement Strategi Fisher Conversion Indicator mengintegrasikan penilaian harga titik balik dan arah tren. Strategi ini akurat, tingkat otomatisasi yang tinggi, dengan optimasi parameter dapat memperoleh hasil perdagangan yang stabil dan efisien. Namun, ada juga risiko tertentu seperti lag, false positives, dan lain-lain.
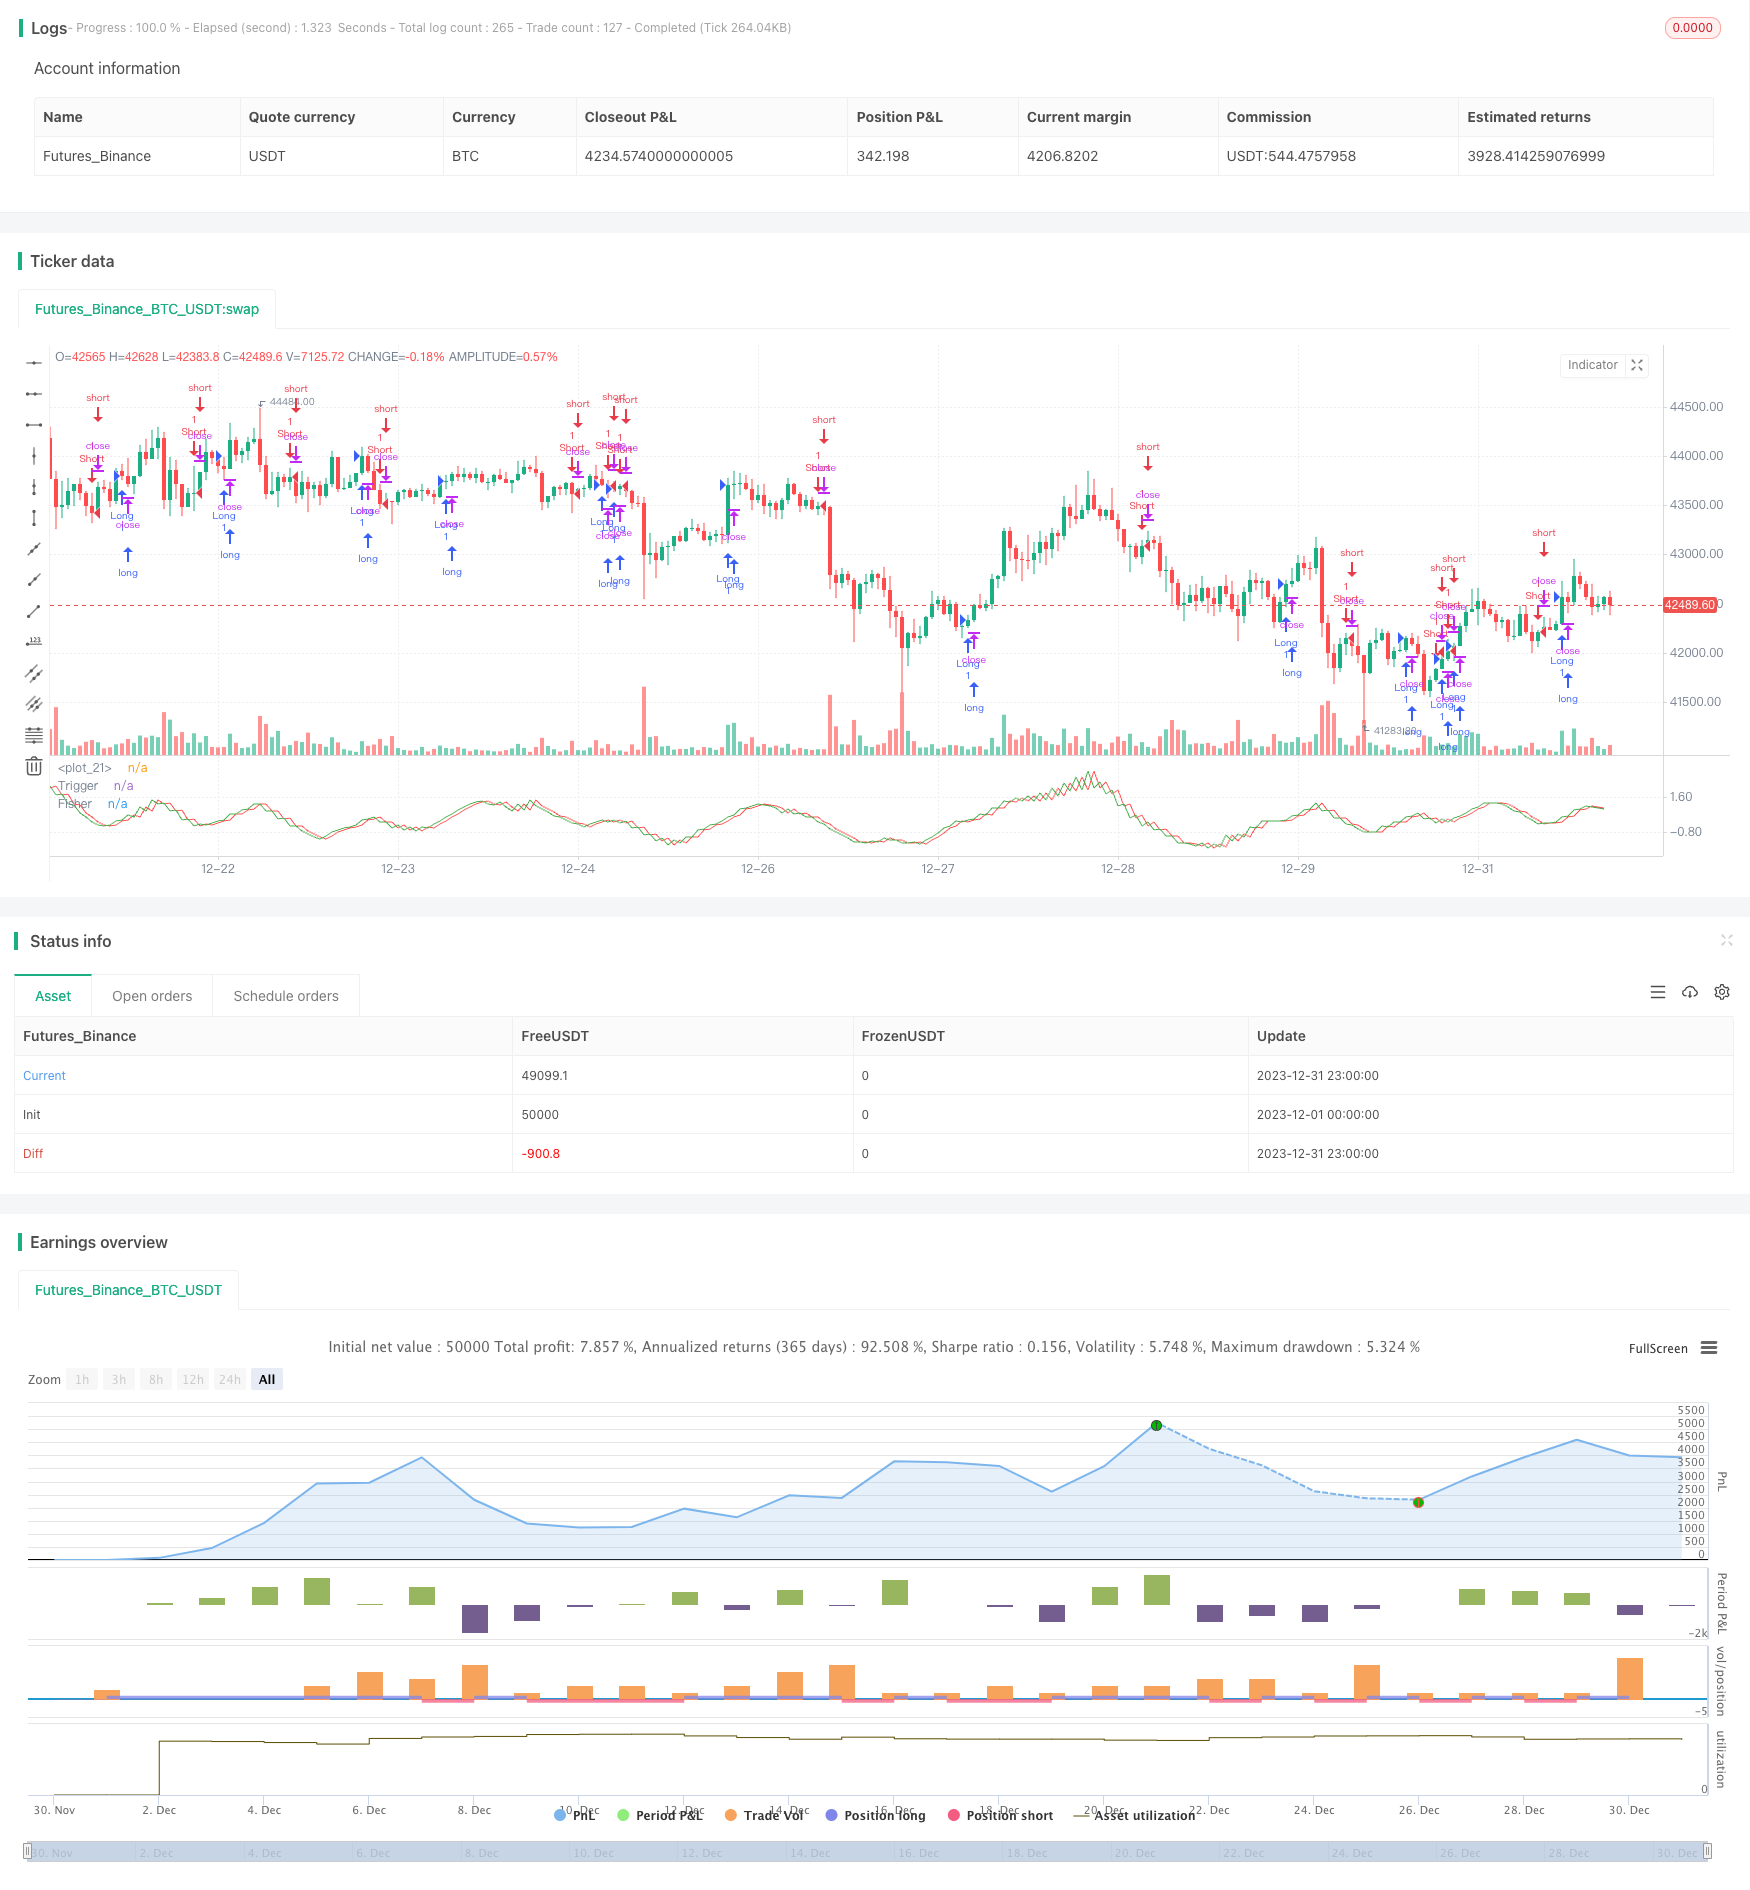
/*backtest
start: 2023-12-01 00:00:00
end: 2023-12-31 23:59:59
period: 1h
basePeriod: 15m
exchanges: [{"eid":"Futures_Binance","currency":"BTC_USDT"}]
*/

//@version = 2
////////////////////////////////////////////////////////////
//  Copyright by HPotter v2.0 22/12/2016
// 	Market prices do not have a Gaussian probability density function
// 	as many traders think. Their probability curve is not bell-shaped.
// 	But trader can create a nearly Gaussian PDF for prices by normalizing
// 	them or creating a normalized indicator such as the relative strength
// 	index and applying the Fisher transform. Such a transformed output
// 	creates the peak swings as relatively rare events.
// 	Fisher transform formula is: y = 0.5 * ln ((1+x)/(1-x))
// 	The sharp turning points of these peak swings clearly and unambiguously
// 	identify price reversals in a timely manner.
//
//  For signal used zero.
// You can change long to short in the Input Settings
// Please, use it only for learning or paper trading. Do not for real trading.
////////////////////////////////////////////////////////////
strategy(title="Fisher Transform Indicator by Ehlers Backtest", shorttitle="Fisher Transform Indicator by Ehlers")
Length = input(10, minval=1)
reverse = input(false, title="Trade reverse")
hline(1, color=white)
xHL2 = hl2
xMaxH = highest(xHL2, Length)
xMinL = lowest(xHL2,Length)
nValue1 = 0.33 * 2 * ((xHL2 - xMinL) / (xMaxH - xMinL) - 0.5) + 0.67 * nz(nValue1[1])
nValue2 =   iff(nValue1 > .99,  .999,
	         iff(nValue1 < -.99, -.999, nValue1))
nFish = 0.5 * log((1 + nValue2) / (1 - nValue2)) + 0.5 * nz(nFish[1])
pos = iff(nFish > 0, 1,
	   iff(nFish < 0, -1, nz(pos[1], 0)))
possig = iff(reverse and pos == 1, -1,
          iff(reverse and pos == -1, 1, pos))
if (possig == 1)
    strategy.entry("Long", strategy.long)
if (possig == -1)
    strategy.entry("Short", strategy.short)
// barcolor(possig == -1 ? red: possig == 1 ? green : blue )
plot(nFish, color=green, title="Fisher")
plot(nz(nFish[1]), color=red, title="Trigger")