MACD + SMA 200 戦略
作者: リン・ハーンチャオチャン, 日時: 2022-05-07 17:13:32タグ:マックド
ここでは,クラシックMACD (移動平均収束分散指標) とクラシックスロー移動平均SMAを組み合わせて 200期を戦略として示しています.
この戦略は,MACDヒストグラムとMACDモメンタムの両方がゼロ以上で,高速MACD移動平均がスローMACD移動平均以上である場合,長引く.追加のロングフィルターとして,最近の価格はSMA200以上である必要があります.逆論理が正しい場合,戦略は短引きます.最悪のケースでは,最大50%のフィルターの日中の株式損失があります.
私の無料戦略で 999ドル貯める
この戦略はビットコインの日々のチャートやS&P500とダウ・ジョーンズ・インダストリアル・平均日々のチャートでバックテストで動作します. 2015年11月30日現在SPX500CFDの日々の業績は利潤率: 1970年以来68%で利潤率は6.4です. 2015年11月30日現在DOWI指数は利潤率: 1915年以来51%で利潤率は10.8です.
すべての取引には高いリスクが伴う.過去のパフォーマンスは必ずしも将来の結果を示すものではない.仮説的またはシミュレーションされたパフォーマンスの結果は,特定の固有の制限があります.実際のパフォーマンス記録とは異なり,シミュレーションされた結果は実際の取引を表現しません.また,取引が実際に実行されていないため,結果は,流動性の欠如などの特定の市場の要因の影響のために,または過剰に補償されている可能性があります.シミュレーションされた取引プログラムは,一般的に,後見の利益のために設計されているという事実にも従います.いかなるアカウントも,示されたものと同様の利益や損失を達成するか,または達成する可能性が高いことを表現していません.
バックテスト
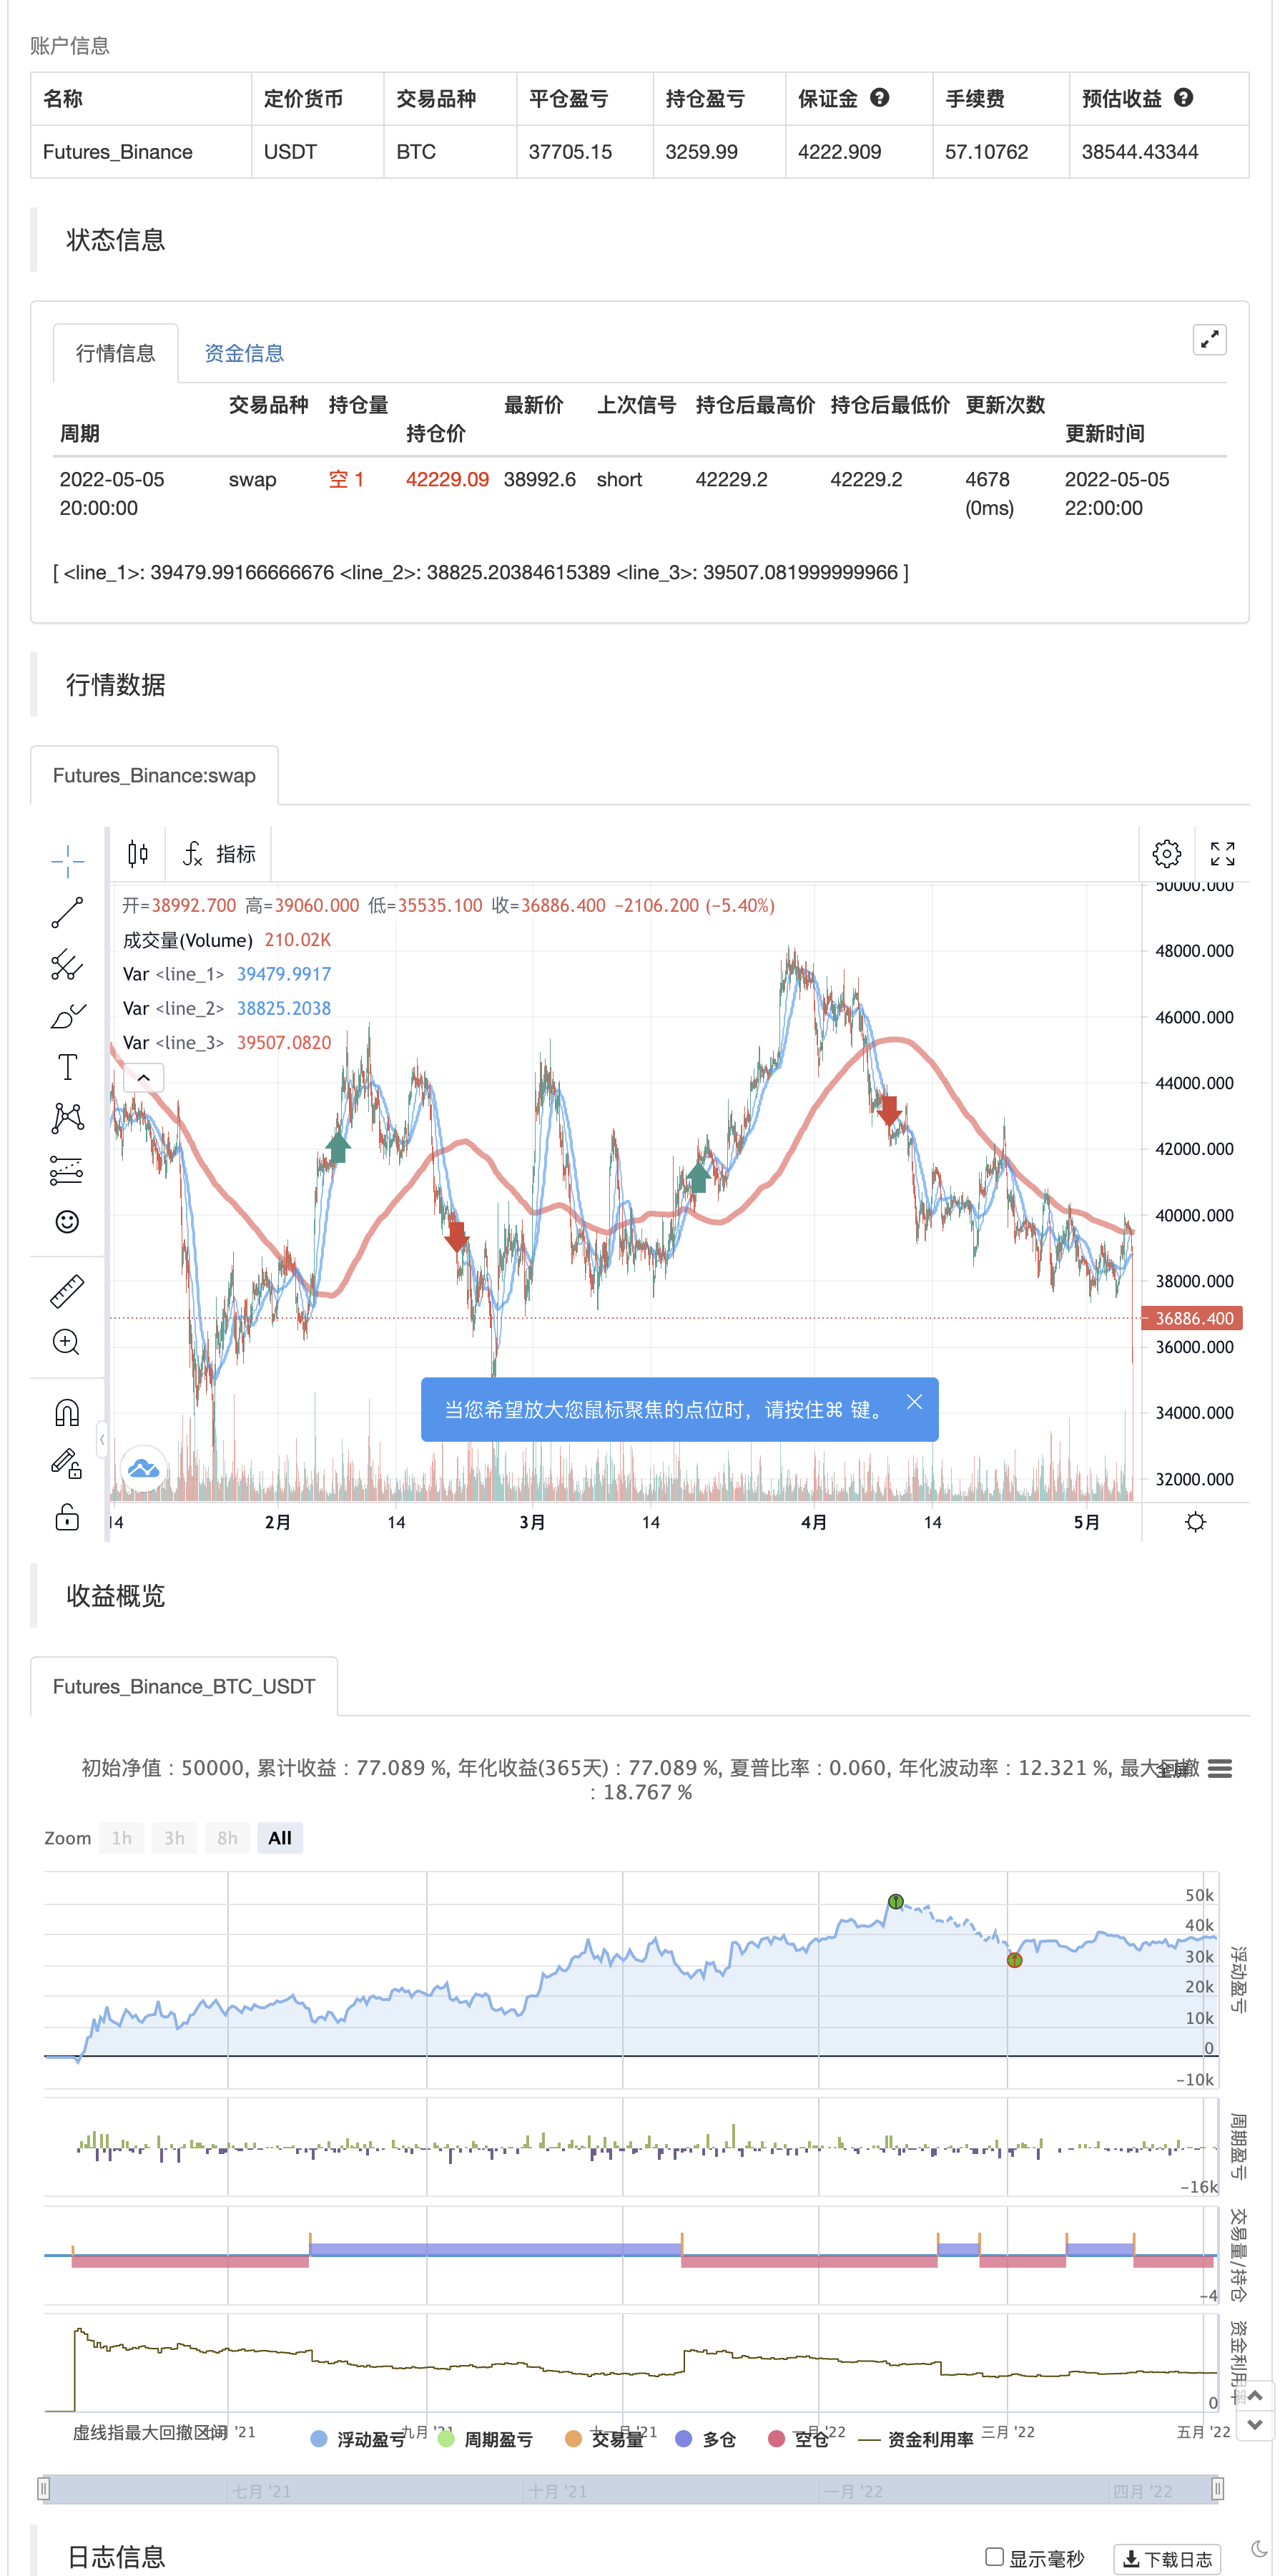
/*backtest
start: 2021-05-06 00:00:00
end: 2022-05-05 23:59:00
period: 2h
basePeriod: 15m
exchanges: [{"eid":"Futures_Binance","currency":"BTC_USDT"}]
*/

//@version=2
strategy("MACD + SMA 200 Strategy (by ChartArt)", shorttitle="CA_-_MACD_SMA_strategy", overlay=true)

// ChartArt's MACD + SMA 200 Strategy
//
// Version 1.0
// Idea by ChartArt on November 30, 2015.
//
// Here is a combination of the MACD with the
// slow moving average SMA 200 as a strategy.
//
// This strategy goes long if the MACD histogram
// and the MACD momentum are both above zero and
// the fast MACD moving average is above the
// slow MACD moving average. As additional long filter
// the recent price has to be above the SMA 200.
// If the inverse logic is true, the strategy
// goes short. For the worst case there is a
// max intraday equity loss of 50% filter.


// Input
source = input(close)
fastLength = input(12, minval=1, title="MACD fast moving average")
slowLength=input(26,minval=1, title="MACD slow moving average")
signalLength=input(9,minval=1, title="MACD signal line moving average")
veryslowLength=input(200,minval=1, title="Very slow moving average")
switch1=input(true, title="Enable Bar Color?")
switch2=input(true, title="Enable Moving Averages?")
switch3=input(true, title="Enable Background Color?")

// Calculation
fastMA = ta.sma(source, fastLength)
slowMA = ta.sma(source, slowLength)
veryslowMA = ta.sma(source, veryslowLength)
macd = fastMA - slowMA
signal = ta.sma(macd, signalLength)
hist = macd - signal

// Colors
MAtrendcolor = change(veryslowMA) > 0 ? color.green : color.red
trendcolor = fastMA > slowMA and change(veryslowMA) > 0 and close > slowMA ? color.green : fastMA < slowMA and change(veryslowMA) < 0 and close < slowMA ? color.red : color.blue
bartrendcolor = close > fastMA and close > slowMA and close > veryslowMA and change(slowMA) > 0 ? color.green : close < fastMA and close < slowMA and close < veryslowMA and change(slowMA) < 0 ? color.red : color.blue
backgroundcolor = slowMA > veryslowMA and crossover(hist, 0) and macd > 0 and fastMA > slowMA and close[slowLength] > veryslowMA ? color.green : slowMA < veryslowMA and crossunder(hist, 0) and macd < 0 and fastMA < slowMA and close[slowLength] < veryslowMA ? color.red : na
//bgcolor(switch3?backgroundcolor:na,transp=80)
//barcolor(switch1?bartrendcolor:na)

// Output
F=plot(switch2?fastMA:na,color=trendcolor)
S=plot(switch2?slowMA:na,color=trendcolor,linewidth=2)
V=plot(switch2?veryslowMA:na,color=MAtrendcolor,linewidth=4)
//fill(F,V,color=gray)

// Strategy
buyprice = low
sellprice = high
cancelLong = slowMA < veryslowMA
cancelShort = slowMA > veryslowMA


if crossover(hist, 0) and macd > 0 and fastMA > slowMA and close[slowLength] > veryslowMA
    strategy.entry("MACDLE", strategy.long, stop=buyprice, comment="Bullish")

else if crossunder(hist, 0) and macd < 0 and fastMA < slowMA and close[slowLength] < veryslowMA
    strategy.entry("MACDSE", strategy.short, stop=sellprice, comment="Bearish")

//maxIdLossPcnt = input(50, "Max Intraday Loss(%)", type=float)
//strategy.risk.max_intraday_loss(maxIdLossPcnt, strategy.percent_of_equity)

//plot(strategy.equity, title="equity", color=red, linewidth=2, style=areabr)
関連性
- MACD RSI イチモク・モメンタム・トレンド 長期戦略に続く
- MACDの金と死の交差値に基づいた取引戦略
- RSI/MACD/ATRとの強化されたEMAクロスオーバー戦略
- MACD と RSI の組み合わせた長期取引戦略
- 多指標組み合わせ戦略 (CCI,DMI,MACD,ADX)
- 戦略をフォローする多指標の傾向
- CCI,DMI,MACD ハイブリッド・ロング・ショート戦略
- エリオット波理論 4-9 インパルス波自動検出 取引戦略
- MACD ゴールデンクロスとデスクロス戦略
- MACD-V と フィボナッチ 多期ダイナミック・テイク・プロフィート戦略
- MACD BB ブレイクストラテジー
もっと
神 易波動率戦略 パイン語版 - 3EMA + ボーリンガー + PIVOT
- 多粒のバゲット
- ミルマシーン
- Kの逆転指標 I
- 飲み込める ろうそく
- MA 皇帝 インシリコノット
- デマルクの逆転点
- スイング・ハイス/ローズ&キャンドル・パターン
- TMA オーバーレイ
- CM スリングショットシステム
- ボリンガー+RSI,ダブル戦略 v1.1
- ボリンジャー・バンド戦略
- オプティマイズされたトレンドトラッカー
- パインスクリプト戦略における月間リターン
- v4 の ADX と DI
- MacD カスタム インディケーター - 多重タイムフレーム+すべてのオプション!
- インディケーター: WaveTrend オシレーター
- 圧縮モメント インディケーター
- アルファトレンド